Author: Damjan Milenkovic

  • Safest Cities in Wisconsin Safest Cities in Wisconsin

    Safest Cities in Wisconsin Safest Cities in Wisconsin

    The Midwestern state of Wisconsin offers its residents and visitors the opportunity to enjoy fantastic scenery, beautiful lakes, and a simple and safe lifestyle. If you’re interested in exploring the vibe of Wisconsin, check out the safest cities in Wisconsin list. With a reputation for small and inviting communities, this state has something for students, retirees, and families alike. 

    For city slickers, take a look at the last half of the list ranked by crime rate, so you can choose a city that’s both exciting and safe. 

    About Wisconsin

    Wisconsin lies in the Great Lakes Region. It borders Minnesota, Michigan, Illinois, and Iowa. It’s connected to Lake Superior and Lake Michigan, and according to the latest estimates, Wisconsin has 5,893,718 residents. As one of America’s most astonishing states, there are many good places to live in Wisconsin.

    Wisconsin was named after the Wisconsin River. Many believe that name means “this stream meanders through something red.” Even though there are many badgers in the state, Wisconsin’s nickname actually came from miners. During the 19th century, miners looking for lead usually slept in the caves, just like badgers!

    Even though Minnesota is famous for its 10,000 lakes, Wisconsin actually has 5,000 more. The beautiful lakes and ponds that litter the area are a result of glacier movement thousands of years ago. 

    The main drivers of Wisconsin’s economy are healthcare, agriculture, and manufacturing, and this state is the leading producer of cheese in the whole country. 

    What is the safest place to live in Wisconsin?

    Wisconsin is one of the safest states in America. Its crime rate is 1,765 offenses per 100,000 residents, and the state has one of the lowest property crime rates in the country.

    What are the median earnings in Wisconsin?

    The median household income in Wisconsin is $61,747, and the per capita earnings amount to $33,375. Around 10.4% of residents live in poverty.

    What are the average property prices in Wisconsin?

    The median house cost in the state is $231,300, and the median gross rent is $856.

    Safest Places to Live in Wisconsin in 2021

    Safest Cities in Wisconsin - Madison

    1. Muskego

    Muskego belongs to Waukesha County of Wisconsin. It’s the fifth-largest community in the county, and it has attracted quite a large Norwegian population. According to the latest data available, the city has 25,032 residents.

    Muskego was the home of the Potawatomi, who named the community after sunfish, but the community became entirely European after 1833. 

    Muskego’s official incorporation came in 1964, when two unincorporated communities, Tess Corners and Durham Hill, merged with the town. With this rise in population, housing developments increased, creating what many now call a bedroom community of Milwaukee.

    Today, Muskego is among the best places to live in Wisconsin. The residents enjoy a high quality of living, with a median household income of $95,242, and per capita earnings of $42,702, just below the state average. Less than 3% of people live in poverty.

    The city is one of the safest in the state. The crime rate sits at 357 per 100,000 residents, and in 2019, law enforcement reported only 85 property and five violent crimes.

    High earnings and safety mean pricier properties. The median house price in Muskego is $391,600, and the median gross rent is $1,096.

    2. Lake Mills

    Lake Mills is part of Jefferson County, and a portion of the city belongs to the Town of Lake Mills. This little place is among the best small towns to live in Wisconsin, and it appears that many people realized that, as the city’s population increased by 4.6% in the last ten years. The latest available data shows that Lake Mills now has 6,211 residents.

    Captain Megan was the first settler of Lake Mills, naming the area after a grist and sawmill that operated nearby. Lake Mills lies on the east shore of Rock Lake. The city was officially founded in 1836 and incorporated in 1852, and at one point, the community was renamed “Tyranena,” which means “sparkling waters.” The name was quickly changed back to Lake Mills.

    Lake Mills is one of the safest cities in Wisconsin, with a crime rate of 420 per 100,000 people. There were ten violent and 15 property crimes in the city in 2019.

    Residents of Lake Mills have high earnings. The median household income is $70,239, and the per capita income sits at $31,182. Less than 8% of residents live in poverty, which is below the state average.

    On the other hand, properties are more expensive than in most other cities. The median house cost is $302,000, and the median gross rent is $978.

    3. Waupun

    Waupun is one of the safest towns in Wisconsin, and it belongs to two counties: Dodge and Fond du Lac. The city has 11,344 residents. Waupun has a crime rate of 575 per 100,000 people, and in 2019, residents reported 62 property and three violent crimes.

    The founder of Waupun is Seymour Wilcox, on recommendation from John Bannister who called the Rock River Valley the most beautiful and fertile land. Waupun received its name after the Native American words that mean “the morning,” “dawn of day,” “the east,” and “the twilight of the dawn.”

    Even though it’s a beautiful, safe city, Waupun is not among the best Wisconsin towns to live in. Earnings in the city are below the state average, and the median household income is $56,587. Per capita earnings sit at $26,898, and around 8% of residents live in poverty, which is below the average for Wisconsin. Rents are much cheaper than in most other cities, with a median gross rent of $701 and a median house price of $159,300.

    4. Kaukauna

    Kaukauna is a city that’s part of Outagamie and Calumet counties. It lies on the Fox River, 100 miles north of Milwaukee, and it currently has 17,089 residents.

    Those searching for the best towns to live in Wisconsin that are safer and don’t have too many people living there should look into Kaukauna. The city has a crime rate of only 759 offenses per 100,000 residents, and in 2019, the police reported 110 property crimes and 14 violent offenses.

    Earnings in Kaukauna are close to the state average. The median household income is $62,822, and the per capita earnings are $30,948. Less than 7% of people live in poverty, far below the Wisconsin average. The properties for one of the safest places in Wisconsin are moderately priced. The median gross rent is $855, and the median house cost is $202,900.

    Kaukauna was the home of French settlers, and its name means “place of pike” and “portage.” Its incorporation came in 1885 when the city decided to separate from the rural portions of the community.

    5. Mequon

    Mequon belongs to Ozaukee County, and it’s the biggest city in the area. It’s also the third-largest one in Wisconsin by land area, but the population is quite small. According to official stats, Mequon has a population of 25,142, and as an official suburb, Mequon is one of the safest neighborhoods in Milwaukee.

    Even though it’s an official city of Wisconsin, most of Mequon’s land is underdeveloped.

    The meaning of the city’s name is “the ladle,” which refers to the shape of the river in the surrounding area. Throughout history and today, Mequon has had a deep connection with the town of Thiensville, as it is surrounded by Mequon. That is why many residents call it “Mequon’s donut hole.”

    Residents of Mequon have very high earnings. The median household income in the city is $116,486, and the per capita income is $68,275. Only 5% of residents live in poverty.

    Mequon is one of the safest cities in Wisconsin, with a crime rate of 774 per 100,000 people, and in 2019, law enforcement reported 176 property and 14 violent crimes.

    Higher earnings and safer living come with pricier properties. The median gross rent in Mequon is $1,561, and the median house price is $477,200.

    6. Sheboygan Falls

    The city of Sheboygan Falls is part of Sheboygan County of Wisconsin. It lies on the east side of the state, and it belongs to the Sheboygan Metro Area. The data from the 2020 census shows that the city has 8,210 residents.

    Sheboygan Falls belongs to the list of the safest places to live in Wisconsin as its crime rate is only 780 offenses per 100,000 people, and there were a total of 59 property crimes and three violent offenses in 2019 in the city.

    The city was named after the nearby falls on the Sheboygan River. The river’s name means “hollow bone,” “river disappearing underground,” or “noise underground,” and at one point, Sheboygan Falls was called Rochester.

    Today, residents of this city earn slightly below the state average. The median household income is $57,552, and the per capita earnings in one of the safest places to live in WI are $31,529. There are approximately 7% of residents who live in poverty, which is below the state average.

    On the upside, rents are cheaper than in many other cities in the state. The median gross rent is $764, and the median home cost is $208,000.

    7. Cedarburg

    Cedarburg belongs to Ozaukee County of Wisconsin. The official data shows that the city has 12,121 residents, and it is located about 20 miles away from Milwaukee as part of the Milwaukee Metro Area. Cedarburg is considered one of the best suburbs of Milwaukee.

    This city used to be a small mill town. German settlers built various wooden mills and hydro gristmills along Cedar Creek during the 1840s. The mills attracted many new residents to the area. Still, the city was primarily German during the first half of the 20th century. After World War II, Cedarburg experienced suburbanization, the mills closed, which led to massive population growth. 

    Today, Cedarburg residents enjoy high earnings, with the median household income being $88,487. The per capita earnings amount to $46,720, and around 6% of residents live in poverty, below the state average.

    Cedarburg is among the safest cities to live in Wisconsin. Its crime rate is 788 per 100,000 people, and in 2019, residents committed 89 property and two violent crimes.

    If you like what you learned and you want to move to this little city, know that the median house price there is $387,600, and the median gross rent amounts to $860.

    8. Burlington

    Burlington is part of Walworth and Racine counties, but the majority of this city lies within Racine County. According to the official reports on Wisconsin cities, with small populations, Burlington has 11,047 residents.

    The city’s first settlers were Moses Smith and William Whiting. They marked the land using a jackknife via the popular “jackknife claim.” They carved the date and their names on nearby trees. After some time, they came back with two other men and started building a community on the east side of the Fox River. Most of the settlers that arrived later were from New England. They decided to name the place Foxville, and in 1839, residents decided to change the name after the city of Burlington in Vermont.

    Today, Burlington is in the top 10 safest cities in Wisconsin. Its crime rate is 841 per 100,000 residents, and in 2019, the police reported a total of six violent and 87 property crimes.

    Burlington residents have a median household income of $68,564, which is above the state average. The per capita earnings sit at $35,456, and around 10% of residents live in poverty. The median gross rent of $846, and the median home price in Burlington is $303,200.

    9. De Pere

    De Pere is a Wisconsin city that belongs to Brown County. It’s part of the Green Bay Metro Area, and De Pere has 25,410 residents. Those who keep searching, “what cities have the lowest crime rate?” trying to find safe cities with a high quality of life may need to look into De Pere. The city’s crime rate sits at 942 offenses per 100,000 residents, and in 2019, law enforcement reported 217 property and 20 violent crimes.

    De Pere became an attractive option for relocating, especially for fishermen, in the 1600s due to its proximity to Fox River. During the year 1671, French Explorer Père Claude-Jean Allouez created the St. Francis Xavier Mission on the rapids known as Rapides Des Pères, and that’s how the modern-day De Pere got its name.

    Many call De Pere the best place to live in Wisconsin. Besides the low crime rate, this city also has high earnings. The median household income is $72,286, while per capita earnings amount to $33,036. About 6.6% of residents live in poverty, and rents are close to the state average, with the median gross rent amounting to $895, and the median home price is $269,400.

    10. Port Washington

    Port Washington is a city that lies on Lake Michigan’s western shore. It’s considered a suburb of Milwaukee and is 27 miles away from the city. Port Washington is also the county seat of Ozaukee County, one of the safest counties in Wisconsin. It has a population of 12,353, according to the 2020 census.

    The U.S. federal government expelled the Native Americans from the area in the 1830s. In 1835, the first settlers arrived and decided to call the place “Wisconsin City.” It was later renamed “Port Washington” to honor President George Washington. 

    Most of Port Washington’s economy was transporting lumber, grains, and fish through the Great Lakes. The government constructed the Port Washington Harbor in 1871 which operated up until the early 2000s.

    Port Washington has a crime rate of 983 per 100,000 residents, making it one of the safest cities in WI. The police reported 29 violent crimes and 88 property offenses in the city in 2019.

    The median household income in Port Washington is $68,167, and the per capita income is $34,328. About 6% of residents live in poverty, and residents have a higher quality of life than most others in the state. The median gross rent sits at $890, while the median house cost is $252,400.

    Safest Cities in Wisconsin - Madison

    11. Waukesha

    Waukesha is the county seat of Waukesha county. The city belongs to the Milwaukee Metro Area, and was named after the leader of a local Native American tribe. Currently, the city has 71,158 residents.

    Most of the early residents of Waukesha were from New England, and they came to the area after the Black Hawk War. As the land was mostly dense forest and wild prairie, the residents used the free space to layout farms as well as construct roads. That attracted more people to Waukesha.

    Waukesha is among the safest cities in southeastern Wisconsin with a crime rate of 1,041 offenses per 100,000 people. In 2019, there were 690 property and 67 violent crimes.

    Residents of Waukesha earn slightly above the average for Wisconsin, with per capita earnings of $34,002. The median household income in the city is $65,260, and around 10% of people live in poverty, which is close to the state average.

    Properties are slightly higher than you might expect, with the median house price sitting at $283,100, and the median gross rent is $944. Still, Waukesha is a great place to relocate to, especially if you are thinking about where the best place is to retire in Wisconsin.

    12. Racine

    Racine is the county seat of Racine County in Wisconsin. It lies on the shore of Lake Michigan, around 20 miles south of Milwaukee. Racine represents the principal municipality of the Racine Metro Area and is the fifth-largest city in Wisconsin, with a population of 77,816. 

    Racine was the home to French Settlers who wanted to relocate to an area close to the Root River. That’s probably how the city got its name, as Racine is a derivation of the French word for root. The area became a popular place for relocation after the Blackhawk War.

    According to the Wisconsin crime map, Racine has a crime rate of 1,658 per 100,000 people, just slightly below the state average. There were 291 violent and 990 property crimes in Racine in 2019.

    The median household income in the city is on the lower side, and it sits at $44,056. The per capita earnings are $22,808, and over one-fifth of people live in poverty. Properties are some of the most affordable in the state, with a median home price of $139,400, and a median gross rent of $831.

    13. Appleton

    Appleton is part of Winnebago, Calumet, and Outagamie counties. It’s among the biggest cities in Wisconsin, with a population of 75,644. Appleton lies on the Fox River, 30 miles southwest of Green Bay, and it’s part of the Fox Cities Metro Area.

    The first settlers came to the land of today’s Appleton in 1847. That same year, Amos A. Lawrence financially backed the opening of Lawrence University, which was then called the Lawrence Institute. His father-in-law, Samuel Appleton, donated money for the university’s library. To show appreciation, residents decided to name the village Appleton, and it became a city of Wisconsin in 1857.

    Today, the Appleton, WI crime rate is slightly above the average for Wisconsin with 1,711 offenses per 100,000 people, and in 2019, law enforcement reported a total of 1,073 property and 206 violent crimes in Appleton.

    Property prices in Appleton are below the state average with median house prices of $202,900, and a median gross rent of $808.

    The residents of this city have salaries that are slightly below the average for Wisconsin. The median household income is $58,112, while per capita earnings sit at $31,313. Nearly 11% of residents live in poverty.

    14. Oshkosh

    Oshkosh is the county seat of Winnebago County. It’s one of the best cities in Wisconsin for everyone that wants to live in a bigger place with more opportunity. At the moment, Oshkosh has 66,816 residents.

    The city’s name was in honor of Chief Oshkos, and the fur trade was the staple of the town. The first significant population increase came after the Black Hawk War, and the city’s incorporation came in 1853. Even though the south was more economically significant, Oshkosh remains a relevant city in Wisconsin, especially in the wood industry.

    The crime rate in Oshkosh sits at 1882 offenses per 100,000 residents. According to the Wisconsin crime statistics, that’s slightly above the state average, and in 2019, residents reported 1,067 property and 190 violent crimes.

    Residents of Oshkosh have a lower quality of living and a high poverty rate of 17%. The median household income in the city is $50,892, and the per capita earnings are $24,949. On the upside, the median gross rent is below the state average at $752, and properties are inexpensive, with a median house cost of $159,400.

    15. Kenosha

    Kenosha is the county seat of Kenosha County, and it lies on Lake Michigan’s shore. Looking at the Wisconsin population by city, Kenosha is in fourth place with 99,986 residents. This city is part of the Chicago Metro Area despite being closer to Milwaukee.

    Kenosha’s original name was Kenozia, or “the place of pike.” The first settlers came in the 1830s and were part of the Western Emigration Company. In the 1850s, the town became a vital shipping port for the Great Lakes, and during that time, its name was changed to Kenosha. In the 1900s, Kenosha was crucial for the automotive industry, producing millions of cars and trucks.

    Today, the Kenosha, WI crime rate is above the average for Wisconsin with 1,888 offenses per 100,000 residents, and in 2019, law enforcement reported 311 violent and 1,582 property crimes.

    The median household income in Kenosha is $55,417, and the per capita earnings are $28,680. A big percentage of the population lives in poverty at 16%. Rents tend to be higher than the state average at $908, while the median house price is $197,200.

    16. Green Bay

    Green Bay is the county seat of Brown County and the third-biggest city on Lake Michigan. It’s also the principal city of the Green Bay Metro Area. Despite the high Green Bay crime rate, this city is one of the most popular ones in the state, and it’s vital for Wisconsin’s economy. The city currently has 107,395 residents, making it the third-largest city in Wisconsin.

    The potential for fur trade was what got the French to form an alliance with Native Americans in the area. Jean Nicolet was responsible for that alliance, and he formed a small trading post in Green Bay in 1634 and called it “the Bay of Stinking Waters.” His settlement was among the oldest European settlements in the U.S., but Green Bay wasn’t incorporated until 1754.

    The Green Bay crime report shows the city’s crime rate is 2,146 per 100,000 people, and in 2019, residents committed 1,724 property crimes and 529 violent offenses.

    The median household income is below the state average at $49,251, and the per capita earnings are $26,618. Nearly 15% of residents live in poverty, but properties tend toward the cheap side, with a median house price of $177,200 and a median gross rent of $730.

    17. Eau Claire

    Eau Claire belongs to the Chippewa and Eau Claire counties, with the majority of the city falling into Eau Claire County. As one of the Wisconsin biggest cities, it’s the principal city of the Eau Claire Metro Area, with a population of 69,421.

    Eau Claire got the name after Eau Claire County. The name means “clear water,” which is how the nearby river was called. The French explorers decided to give it such a name because of the contrast from the muddy Chippewa River. The first permanent settlement of the area happened in 1845, and logging was the main industry in the city, with many sawmills built at that time. Eau Claire’s incorporation came in 1872.

    The Eau Claire, Wisconsin crime rate sits at 2,638 offenses per 100,000 people, and there was a total of 1,634 property and 191 violent crimes in the city in 2019.

    Residents of Eau Claire earn below the state average, with per capita income sitting at $29,252 and the median household earnings of $55,477. A large number of residents live in poverty, with 16.6%, and properties are still relatively expensive. The median home price is $222,800, while the median gross rent sits at $835.

    18. Janesville

    Janesville is the principal municipality of the Janesville Metro Area and the county seat of Rock County. Janesville is one of the best places to live in Wisconsin for families, with tons of parks and excellent schools. Located in the south of the state, it has a population of 65,615.

    The first settlers of Janesville were Joshua Holmes, John Inman, William Holmes, Jr, and George Follmer. They came to the town in 1835 and built a log cabin. A few months later, Henry F. Janes, a Virginian native, also relocated to Janesville. He was one of the crucial figures in the city’s history. He laid out the plan for the city and started building houses. To honor his great work, residents decided to name the town after him. 

    For those who wonder, “is Janesville, Wisconsin safe?”, Janesville’s crime rate is 2,667 per 100,000 people, and in 2019, the police filed reports for 1,577 property and 148 violent crimes.

    The median household income in Janesville is lower than average at $56,293, and the per capita earnings sit at $29,532. Almost 12% of residents live in poverty, and properties are reasonable, with a median gross rent of $858 and a median home cost of $201,500.

    19. Madison

    Madison is Wisconsin’s capital, and it’s also the county seat of Dane County. Madison is the fastest-growing city in the state, which is why more and more people search for the best places to live in Madison, WI. It’s in the core of the Madison Metro Area and the second-most populated city with 269,840 residents. The first residents of the town named it after the state’s Founding Father and President James Madison.

    The city is surrounded by four lakes: Lake Kegonsa, Lake Waubesa, Lake Mendota, and Lake Monona. You’ll find the headquarters for American Family Insurance, Exact Sciences, Epic Systems, and Spectrum Brands in the city. It’s home of Google’s regional offices, and the University Research Park is also located there. Madison is the home of the University of Wisconsin and the Overture Center for the Arts.

    The Madison, WI crime rate is high with 2,834 offenses per 100,000 residents, and in 2019, law enforcement reported 940 violent and 6,464 property crimes.

    The median household income in the city is $65,332 and the per capita earnings are $38,285. Nearly 17% of people live in poverty. 

    Despite moderate salaries, properties in Madison are costly. The median home price is $328,700, and the median gross rent sits at $1,118.

    20. Milwaukee

    Milwaukee is by far the most populous city in Wisconsin, and it has 577,222 residents. Despite being among the most popular for relocation, the Milwaukee, Wisconsin crime rate is exceptionally high, even for U.S. standards.

    Milwaukee is the county seat of the county that carries the same name. The city lies on the southwestern shore of Lake Michigan, and it’s the fourth-largest one in the Great Lakes Area. Milwaukee is the principal city of the Milwaukee Metro Area.

    This city is an excellent option for students as it’s the home of many universities such as MSOE, Marquette University, and UW-Milwaukee. Furthermore, Fortune 500 companies Harley-Davidson, Rockwell Automation, and Northwestern Mutual are located there.

    While it’s a city of opportunities, you’re probably still wondering is Milwaukee one of the most dangerous cities? Its crime rate sits at 3,887 crimes per 100,000 people, which is way above the state average, and there were 15,097 property offenses and 7,874 violent crimes in the city in 2019.

    The earnings of the Milwaukee residents are below the state average. The median household income is $41,838, while per capita earnings amount to $23,462. An alarming number of residents live in poverty at 25.4%. It still is one of the top places to live in Wisconsin, though, with a median house cost is $162,600, and a median gross rent of $858.

    Conclusion

    Wisconsin is a beautiful Midwestern state that offers small and safe communities, as well as bigger cities with plenty of opportunity. This state has its own culture and rich history that is perfect for retirees, students, and families.

    With some of the lowest crime rates in the country, finding the safest cities in Wisconsin is easier than most other places. Still, knowing which cities are the best to live in, as well as those that come with higher rates of crime and poverty, are important considerations if you’re looking to relocate. Find a bedroom city close to Milwaukee, or settle in a small town with a quaint community, Wisconsin has something for everyone.

  • Intriguing Amazon Alexa Statistics You Need to Know in 2024

    Intriguing Amazon Alexa Statistics You Need to Know in 2024

    The use of smart speakers is increasing globally, and many consumers are keeping up with this trend. Alexa has become a household name for consumers, businesses, and more. The answers are in the facts. If you look at the recent Amazon Alexa statistics, you’ll understand its global impact.

    From its demographics to its effect on the global market, this article explains how Amazon Echo is set to become an integral part of our lives. 

    However, many questions have been raised due to its popularity.

    Is it a practical device?

    Is it safe?

    How useful can it be for work and leisure time?

    Well, check out the latest numbers and see for yourself.

    Alexa Demographics & Fascinating Stats (Editor’s Choice)

    • Since its launch, Alexa has gained more than 100,000 skills
    • In 2020, almost seven in ten smart speaker users in the US used Amazon Echo
    • About 100,000 smart home devices support Alexa
    • In 2020, around 10.8% of digital buyers relied on Amazon Alexa for online shopping
    • In 2020, Amazon made up over half of the US smart speaker market share by brand
    • By 2025, 130 million Amazon Echo speakers are projected to be shipped worldwide
    • In Q1 of 2021, Amazon shipped over 20% of all smart speakers globally

    Amazon Echo Demographics Statistics

    People’s curiosity for using smart speakers has sparked in recent years. Digital natives from different age groups and backgrounds have become accustomed to using Amazon Echo. With these ongoing developments, let’s take a look at its domestic and global reach.

    1. Almost 70% of smart speaker users in the US used Amazon Echo in 2020. 

    (Tech Crunch)

    Amazon Echo is still dominant in the world of smart speakers. As studies show, 69.7% of American citizens used Amazon Echo in 2020. This percentage dropped slightly by the end of 2021, reaching 68.2%, but it doesn’t shake up the status quo. 

    2. As Amazon Alexa competitors statistics show, Google Home had 25% market share in 2019. 

    (Globe Newswire)

    As per the Amazon Echo stats of the same survey, Alexa/Echo dominated the market that year, with 70% market share. Having 5% of the market share, Apple HomePod took the third place. 

    The survey covered several countries — the US, the UK, India, Australia, Japan, Brazil, Germany, China, South Korea, Russia, Indonesia and France. 

    3. Alexa has gained over 100,000 skills since its launch. 

    (Statista)

    Amazon Alexa is an AI-powered virtual assistant developed by Amazon. The more commands it receives, the more skills and information it learns. 

    According to Amazon Alexa facts, Alexa started with only 130 skills. However, that number increased to 100,000 skills in only six years. The progress is truly remarkable, considering that Alexa was launched in November 2014.

    4. In the US, Alexa’s number of skills reached 70,729.

    (Statista)

    As more and more people use Amazon Alexa, its ability to receive and execute commands will only improve. If we look at the impact of Alexa by country, the US has become its most significant learning environment and primary consumer market. Reportedly, the number of Alexa’s skills reached 70,729 in the United States. 

    5. Meanwhile, Amazon Alexa has grown to learn 36,341 skills in the UK.

    (Statista)

    Although fewer than in the US, Alexa has gained a significant number of skills in the UK, reaching 36,341 in January 2020.

    6. Amazon holds the highest ranking in the market for smart speakers, accounting for 21.7% of smart speaker purchases globally. 

    (Statista)

    Ever since its global launch, Amazon has been conquering the smart speaker market. As the Amazon Alexa sales show, it held the top position in the global market in 2019. More specifically, it accounted for over 21.7% of smart speaker purchases worldwide.

    7. 79% of digital buyers from the UK had an Amazon Echo in 2019. 

    (Statista)

    Aside from the US, other countries are also catching up with smart speaker hype. If we analyze the Amazon Echo user demographics, we can conclude that almost 80% of digital shoppers from the UK owned an Amazon Echo in 2019. 

    8. The international version of Amazon Alexa supports only three languages. 

    (The Ambient)

    Even though Alexa can speak English, Italian, French, Japanese, German, Portuguese and Spanish, only three languages are available on the international version—English, Spanish, and German. 

    9. 33.6% of smart speaker users in Spain have an Amazon Echo. 

    (Statista)

    Spain has also become more digitized in recent years. According to Alexa statistics, an estimated 33.6% of smart speaker consumers in Spain use an Amazon Echo. Google is in the lead with 35% of users. 

    10. 53% of American users are satisfied with Amazon Echo.

    (Statista)

    While its popularity is rising, customer satisfaction is not lacking either. According to recent studies on Alexa’s client base, more than half of US users are very satisfied with Amazon Echo functions.

    Amazon Echo Market Share Statistics

    The smart speaker industry is moving fast, with the number of units hitting 163 million in 2021. To learn more about it, check out the following statistics. 

    11. Amazon accounted for more than 50% of the US smart speaker market share by brand in 2020. 

    (Voicebot)

    The purchase and usage of smart speakers have become more of a trend in the modern era. According to smart speaker statistics, Amazon is the leader in the industry. The Amazon market share on smart speakers in the US accounted for 53% in 2020. 

    12. 18% of millennials use Amazon Alexa for voice-assisted shopping. 

    (Voicebot)

    Different generations are becoming more familiar with smart speakers and their functions. Millennials who are now a considerable part of the population use Alexa for various reasons. As seen from Amazon Echo facts, around 18% of them use Amazon Alexa for shopping-related purposes. 

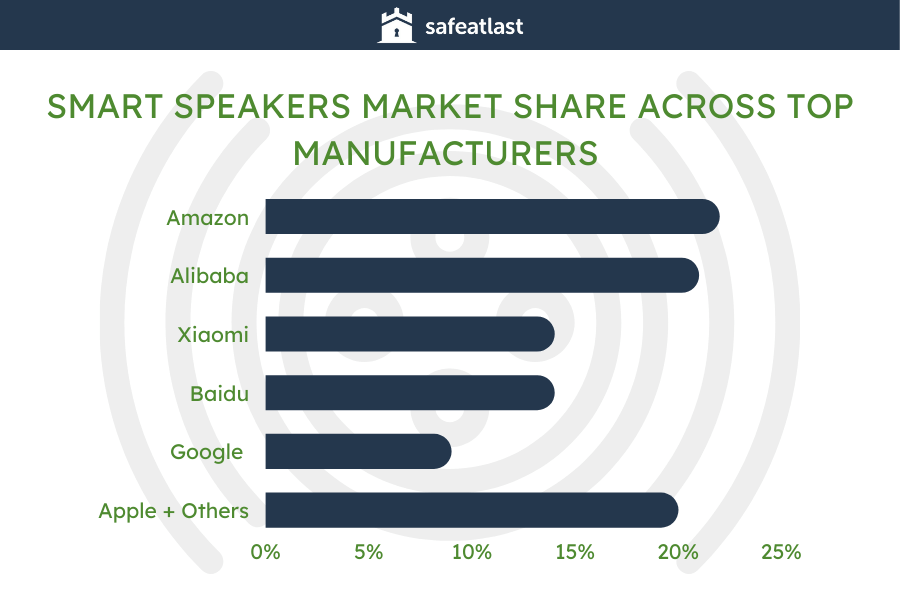
    13. In the first quarter of 2021, Amazon shipped around 22% of all smart speakers worldwide. 

    (Tech Hive)

    Alibaba was right after Amazon, shipping 21% of the smart speakers during that period. Moreover, Xiaomi and Baidu accounted for 14% each, and Google’s market share was 9%. The remaining 20% were divided by Apple and other manufacturers. 

    Amazon Alexa Statistics

    14. In January 2019, Amazon Echo Dot had the biggest market share. 

    (Voicebot)

    According to smart speaker statistics, its market share was 31.4%. Moreover, it was more popular than Echo, Echo Spot, Echo Plus, and Echo Show — Amazon’s higher-priced products. As for Google, the Home and Home Mini were equally popular, each having an 11.2% share.

    15. Amazon retains the top spot for smart speaker sales globally. 

    (Voicebot)

    With the world put on pause because of the pandemic, several industries’ sales markets have slowed down considerably. This effect includes the smart speaker market. 

    However, Amazon has retained the top spot in global sales for Amazon Echo despite a slight decline. According to Alexa web statistics, Amazon accounted for 23% of the global sales for smart speakers in the first quarter of 2020, which was more than all its competitors. 

    16. Since 2020, Alexa has become compatible with over 100,000 smart home devices. 

    (Statista)

    One of the main concerns when buying a smart speaker is that it may not be a practical choice for you if you’re building a smart home. However, this problem is solved thanks to Amazon Echo’s increasing compatibility.

    As Amazon Echo stats show, Alexa is now compatible with 100,000 smart home devices. That’s a 40% increase since 2019 when Alexa was compatible with 60,000 devices. Ranging from voice-activated lights to automatic smart door locks, you can connect almost any device to a smart speaker.

    17. Approximately 10.8% of digital buyers used Amazon Alexa for online shopping in 2020. 

    (eMarketer)

    More and more consumers consider using smart speakers and voice assistants for shopping. According to Alexa facts, around 10.8% of consumers used Amazon Alexa for at least one purchase in 2020. That percentage increased to 11.5% by the end of 2021. That’s hardly surprising, considering that the volume of all global digital payments in the first half of 2020 increased by 21%.

    18. The third generation Echo Dot was the UK’s most purchased Amazon product during Black Friday in 2019. 

    (Statista)

    Another main concern for potential consumers is the affordability of smart speakers, which can be alleviated with seasonal and holiday discounts. In the UK, the Amazon Alexa sales growth soared during Black Friday.

    Many online buyers purchased the third generation Echo Dot. More precisely, 32.6 thousand units were sold, and it became the most purchased Amazon product in the UK.

    19. 130 million Amazon Echo speakers are expected to be shipped globally by 2025. 

    (Statista)

    With its continual growth over the years, Amazon is projected to make more sales soon. As Amazon Alexa trends show, about 130 million Amazon Echo speakers will be shipped to different parts of the world by 2025.

    20. There were 91,700 downloads of the Alexa App in the UK. 

    (Statista)

    Setting up an Amazon Echo in your home means you will have to utilize the Alexa app. iPhone users in the UK downloaded the app more than 91,000 times in February 2020 alone. 

    Amazon Echo Data Usage and Consumer Statistics

    Some of the main aspects of using Alexa are its availability, practical functions, and data usage. How practical is it to have a smart speaker in your house? Let’s find out. 

    21. For the most part, consumers use Amazon Echo more as a source of information than entertainment.

    (Voicebot)

    Smart speakers are multipurpose. Still, more than 60% of Amazon Echo users utilize this device to find information, as Amazon Alexa statistics show. Examples of such activities are checking the time, weather, and recent news.

    22. At least 63% of US citizens are familiar with Amazon Alexa. 

    (Voicebot)

    Considering the fact that people use the internet for everything from shopping and entertainment to business communication, it’s not surprising that smart speakers have become the norm. 

    Therefore, if we take a look at the Amazon Echo statistics, we can see that around 63% of the American population knows about Amazon Echo and its functions. At the very least, those who are 12 years of age and older know about Alexa.

    23. On average, Amazon Alexa uses 36MB of data daily. 

    (Good Home Automation)

    If you have a limited data plan, it’s worth knowing how much data Amazon Alexa uses. According to Amazon Echo data usage statistics, Alexa uses 36MB per day, which translates to 252MB per week or 1.08GB per month. The numbers are based on 30 minutes of music streaming, two smart-home commands, one question about the weather, and one general question. 

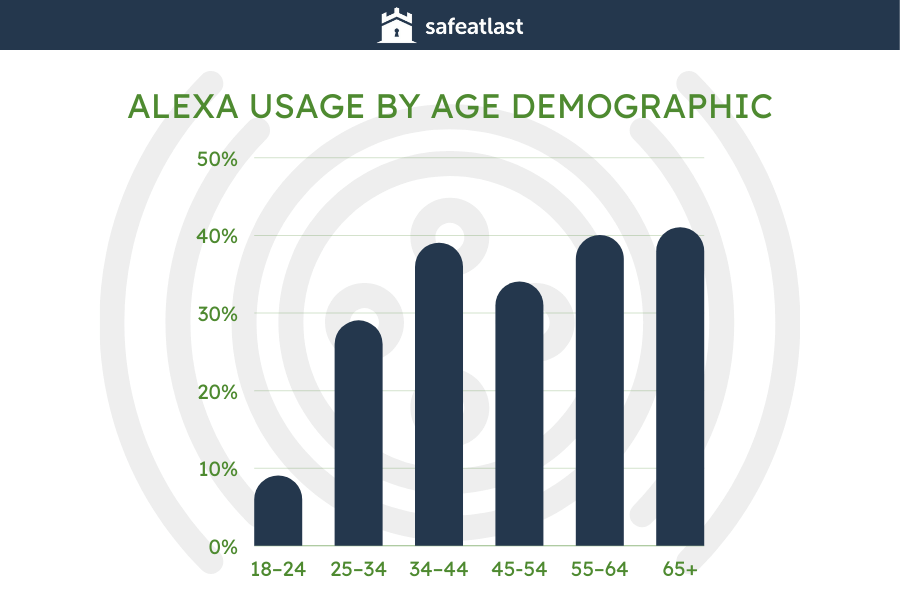
    24. A survey finds that 41% of people aged 65 and over use Alexa. 

    (eMarketer)

    Stats on Amazon Echo demographics reveal that younger people don’t use Alexa as much. Namely, four out of ten respondents aged 55–64 use Alexa, and 34% of those between the ages of 45 and 54 use it. 

    25. In the 34–44 age group, 39% of respondents use Alexa.

    (eMarketer)

    Moreover, the percentage is even lower for those 25–34 (29%). Alexa stats show that the lowest share of respondents using Alexa is in the 18–24 age group — 19%. 

    In comparison, Siri takes the leading role among adult Gen Zers, as six in ten voice assistant users 18–24 use it. 

    Even though Google Assistant doesn’t dominate any age group, it has a considerable share of users across the board. 

    Amazon Alexa Statistics #2

    26. Amazon extended the audio clip limit for Alexa from 90 to 240 seconds.

    (Voicebot)

    Recently, Amazon has upgraded Alexa functions to meet customers’ needs. One of those upgrades is the extended limit of audio clips that can be analyzed by the device. 

    From its original 90 seconds, Amazon Echo has increased the audio file time limit to 240 seconds, according to Amazon Alexa facts. This audio file time is more than double its former length. With this upgrade, it opens up more opportunities for a completely new set of uses. 

    27. 84.9% of Echo owners used Amazon Alexa to set a timer at least once. 

    (Voicebot)

    Aside from asking for information, Amazon Alexa is often used to assist with everyday tasks. According to more recent Alexa voice statistics, 84.9% of Echo owners have used the device to set a timer, followed by 82.4% who used it to play songs and 66% who used it to read the news. 

    28. There were 53.6 million Amazon Echo shipments worldwide in 2020.

    (Statista)

    Amazon Echo is one of the most sought-after smart speakers, and the number of sold items speaks volumes about its dominance. 

    According to Amazon Alexa statistics 2020, 53.6 million Amazon Echo speakers were sold in the same year. The number grew to 65 million in 2021. 

    29. More than 250,000 marriage proposals have been made to Alexa. 

    (Statista)

    Amazon Echo statistics affirm that Amazon Echo is one of the most popular gadgets, and interacting with Alexa is a daily occurrence. Thanks to artificial intelligence and machine learning, it can answer almost any question. 

    It’s also useful for entertainment and can even hold simple conversations. One of the more amusing facts is that more than a quarter of a million marriage proposals have been made to Alexa.

    Conclusion

    The sales growth and usage rate of Amazon Alexa have been increasing in many countries. Starting from North America, Amazon Alexa has gained millions of customers and became an integral part of thousands of households. Its usage rates have also increased exponentially in other countries. A stark example is the UK, where Amazon Alexa also dominates the market. 

    According to Amazon Alexa statistics, it’s main use is as a digital assistant for daily activities. For the most part, it gives information such as time, weather, and news reports. Moreover, Amazon Alexa can stream music, make to-do lists, set alarms, and control your smart video doorbell and various other smart home devices. Alexa is truly a multipurpose assistant—it can even be your personal sommelier if you don’t know which wine compliments your dish. According to some Amazon Echo facts and trivia, all you need to do is ask the “Wine Gal” for advice. 

    You can order food without getting off your couch or find a board game manual. Alexa can even help you plan a vacation. If you don’t want to spend a lot of money, you can simply ask your assistant to find a travel deal that suits your budget. One thing is certain — Amazon Alexa will continue to be the most convenient virtual assistant you can get.

    People Also Ask

    Does Amazon own Alexa?

    Amazon Alexa is a virtual assistant launched in 2014. It’s one of Amazon’s products, among many others, such as smart home gadgets and appliances. It’s available for purchase in multiple locations around the world.
    Moreover, current trends have played a significant role in getting Amazon to where it is today. It has been estimated that around 63% of US citizens know what Amazon Echo is and what it does for its digital users.

    How many users does Amazon Alexa have?

    In the US alone, stats show that around 70% of smart speaker users have an Amazon Echo in their homes. This number continues to grow as consumers shift toward voice-activated services.
    Therefore, it’s not surprising that many consumers use or plan on using Amazon Alexa. According to reports, there are 40 million Alexa users in the US alone. With the increasing number of devices Alexa is compatible with and skills it can learn, it’s expected that Amazon Alexa will have even more users in the future.

    Are Alexa and Siri the same thing?

    If we compare their primary functions, Alexa and Siri are rather similar. Both of them are virtual assistants based on AI that evolves and learns skills through client’s inquiries. If you interact with Alexa or Siri, you will get a verbal response.
    However, Alexa functions as a smart home assistant found in Amazon’s line of Echo smart devices.
    On the other hand, Siri is a virtual assistant built for Apple’s devices only. It’s typically connected to iPhones, and it comes in the form of Apple HomePod devices. Siri operates on a natural language processing program, while Alexa uses conversational artificial intelligence.

    Who is better, Siri or Alexa?

    Alexa and Siri are the top-ranked contenders in the battle of virtual assistants. Despite their similarity, their functions and abilities may not be ideal for every user. So, when it comes to the question of Siri vs Alexa, It all boils down to customers’ needs. 
    If you are looking to turn your home into a smart home that’s easy to control, Amazon Echo can be a practical choice. Moreover, according to statistics, Amazon Echo has more potential for automating daily tasks. For example, Alexa can help you with online shopping, manage connected appliances, and secure the house with a smart lock.
    On the other hand, Siri is more suitable for mobile users, especially those familiar with Apple devices. Instead of being a third-party device, Siri is usually built into the mobile devices’ systems. You can activate it for setting up schedules, sending emails, and calling people in your contact list.

    Is Alexa’s voice a real person?

    Even though Alexa’s voice sounds human, it was not originally a real person’s voice. Thanks to the woman behind Echo, Toni Reid, Alexa became the voice of modern technology. This voice-activated virtual assistant originated from the latest text-to-speech systems and artificial intelligence. 
    More updates have been added to the device for a friendlier, more human-like sound. For example, you can change an accent to match yours. Celebrities such as Samuel L. Jackson can also be heard on Amazon Echo. If you’re interested in adding personality to your smart speaker’s voice, Jackson is here to set your alarm, reply to your question about the weather, and more. 
    It’s not surprising that Amazon has decided to implement such neat features since voice search trends are expected to continue rising. According to Amazon Alexa statistics, 44.7% of consumers use smart speakers like Amazon Echo for voice search, and this percentage will only grow in the future.

  • Safest Cities in Indiana

    Safest Cities in Indiana

    With 6,785,528 residents and an average of 186 sunny days per year, Indiana is one of the most pleasant states to live in. From smaller, safer towns full of rich history to larger cities with more options, Indiana has it all. 

    If you’re looking for the safest cities in Indiana to move to, keep reading. Find a safe town among our list of favorite cities perfect for families and retirees, or skip to the last half of the list to see which places have the highest crime rates.

    About Indiana

    Indiana was the 19th state admitted to the union, and it’s part of the American Midwest region. Indiana borders Illinois, Kentucky, Ohio, and Michigan, and the state capital has been Indianapolis since 1825. 

    This state is divided into three regions, the first of which is the Great Lakes Plains region located in the north of the state. As one of the best places to live in northern Indiana, the strip along Lake Michigan is full of star dunes that you can’t see anywhere else.

    Till plains cover the center of Indiana., and the state is full of valleys and lower hills. Residents call it the “Corn Belt,” for the vast fields of corn grown there. 

    The Southern Plains and Lowlands region is in the south. Limestone caves and steep hills are typical for this part of the state.

    Indiana’s crime rate is 2,342 per 100,000 people. The median household income sits at $56,303, and the per capita earnings amount to $29,777. Nearly 12% of people live in poverty.

    Safest Places to Live in Indiana for 2021

    Indian Dunes State Park

    1. West Lafayette

    West Lafayette is a city that belongs to Wabash Township in Tippecanoe County of Indiana. The Wabash River separates this town from its sister city Lafayette. According to the latest available data, West Lafayette has 44,595 residents. The city is among the most densely populated in the entire state, and it’s also the home of Purdue University. According to various sources, West Lafayette is the safest city in Indiana.

    Augustus Wylie was responsible for laying out the city plan in 1836, but due to floods from the Wabash River, he backed out, leaving the land empty. A new village was established in 1888 and operated under the name Chauncey until it was changed to Lafayette. In 2013, West Lafayette separated from the rest of the city.

    West Lafayette has low salaries and an extremely high poverty rate. The median household income is $34,650, and the per capita earnings amount to only $21,041. Approximately 38% of residents are living in poverty.

    Despite the impoverished population, the West Lafayette, Indiana crime rate is 791 per 100,000 residents, and in 2019, the police reported 357 property and 32 violent crimes.

    If you’re interested in relocating to West Lafayette, know that the median gross rent is higher than the state average at $912, and the median house price is $283,600.

    2. Westfield

    Westfield is part of Hamilton County of Indiana and belongs to the Indianapolis Metro Area. The latest official data shows that the city has 46,410 residents. With a crime rate of only 819 per 100,000 people, Westfield is among the safest cities in Indiana. In 2019, residents reported only 338 property and 16 violent crimes.

    North Carolina Quakers Ambrose Osborne, Asa Bales, and Simon Moon founded the city in 1834, with the primary purpose of creating an essential railway stop for the Underground Railroad. The town’s official incorporation came in 1849, and Westfield became a city of Indiana in 2008. Due to the city’s growing population, Westfield’s officials are planning a significant revitalization of the downtown, which will include a city hall and a new library.

    Aside from being one of the safest neighborhoods in Indianapolis, Westfield also offers high earnings. The median household income sits at $98,376, and the per capita earnings amount to $42,592, with only 6% of residents living in poverty. 

    As it’s among the best options for relocation, properties in Westfield are more expensive than in other cities. The median home price is $355,800, while the median gross rent sits at $1,207.

    3. Fishers

    Fishers is a city in Hamilton County, and it belongs to the Delaware and Fall Creek townships. With a population of 98,977, Fishers is among the most populated and best place to live in Indiana, as its residents enjoy a high quality of life.

    The city’s history dates back to 1802, when William Conner settled in the area and built a trading post and a cabin. 

    Settlers were attracted to the area after Indiana became an official state, and the second big population growth was in 1849 after the Peru & Indianapolis Railroad was built. The town was known as “Fisher’s Switch,” but only the Fishers part remained after the post office was built in 1908. In 2015, Fishers became an official city of Indiana.

    If we look at the Indiana crime rate by city, the Fishers crime rate is 822 per 100,000 people, and in 2019, residents committed a total of 51 violent and 734 property offenses.

    The median household income in Fishers is very high at $109,454, and the per capita income is above average, at $51,312. Less than 3% of residents live in poverty, and the median gross rent is $1,250, and the median house price is $344,600.

    4. Hartford City

    Hartford City is the center of Blackford County, and it lies in the northeast central part of Indiana. Hartford City has 6,086 residents, and it’s in the top safest and cheapest cities in Indiana.

    The city’s original name was “Hart’s ford,” which marked a place to cross Lick Creek. Hartford City used to be a small farming community that experienced a substantial economic boom in the late 1880s. The boom was a result of the discovery and exploitation of the natural gas that was present in the land around Hartford City.

    The earnings of the residents of Hartford City, however, are below the state average. The median household income in the town sits at $34,850, and the per capita earnings amount to $22,680, with nearly 16% of residents living in poverty. 

    On the upside, Indiana crime statistics show that Hartford City is among the safest ones in the state. The crime rate per 100,000 people sits at 840 offenses, and there were 33 property crimes and 15 violent offenses in the city in 2019.

    Properties are affordable, with a median house price of only $70,400 and a median gross rent of $633.

    5. Tipton

    Tipton is the county seat of Tipton County, and it belongs to the Kokomo Metropolitan Area. The 2020 census showed that the city has 5,275 residents, and Tipton is one of the safest towns in Indiana, with a moderate to low cost of living.

    Until 1845, the area that is now Tipton was mostly empty, but all that changed when the post office called Canton was supposed to be built. There was already another town of the same name in Indiana, so residents chose something else. The town of Tipton was finally named in honor of John Tipton, a war veteran, and a politician who served as the United States Senator for Indiana. Tipton became an incorporated city of Indiana in 1884.

    As one of the safest places to live in Indiana today, Tipton has a crime rate of 848 offenses per 100,000 people, and in 2019, law enforcement reported 34 property and only nine violent crimes.

    The median household income is close to the state average at $52,538, and the per capita income is $25,839. Around 11.1% of residents live in poverty, which is below the average for Indiana, and rents are cheaper than in most other cities. The median gross rent sits at $775, and the median house cost is $146,800.

    6. Carmel

    Carmel is a suburb of Indianapolis, and it belongs to Clay County. If we were to list cities in Indiana by population, Carmel would be in the top largest ten, with 99,757 residents. Many people know Carmel as the “Roundabout Capital of the United States” as there are over 130 roundabouts in this city. Interestingly enough, one of the first electronic automated traffic signals was constructed there.

    Carmel’s original name was Bethlehem. It was founded by Quakers Seth Green, Alexander Mills, Daniel Warren, and John Phelps. As Indiana already had a post office with that name, the town had to change the name to Carmel in 1874, and that same year, it officially became a town of Indiana. 

    Some ask the question, “is Carmel, Indiana safe?”. Especially for low incidences of violent crime, Carmel is very safe. Its crime rate is only 878 per 100,000 residents, and in 2019 the police reported 30 violent and 807 property crimes.

    People living in Carmel earn way above the state average. With per capita earnings of $60,895 and a median household income of $112,765. Only 3.5% of residents live in poverty, and the median house price in Carmel is $437,80, with a median gross rent of $1,207.

    7. Crown Point

    Crown Point is the center of Lake County. This city is among the best places to live in Indiana near Chicago, as it’s just 47 miles away, and according to the latest official estimates, Crown Point has 33,899 residents.

    Crown Point is commonly referred to as the “Hub of Lake County.” The first settlers of the area were the Robinson family, and in 1837, the family donated money for a wooden county house enabling Crown Point to become the county seat. 

    Crown Point officially became a city of Indiana in 1868. A new courthouse called “Grand Old Lady” was built in 1878, while the old one was placed on the National Register of Historic Places. Even though it’s one of the safest cities to live in Indiana today, Crown Point’s reputation was tarnished in the 1930s because of a famous prison break by John Dillinger.

    Residents of Crown Point earn above the state average, with a median household income of $76,927 and a per capita income of $35,670. Less than 6% of residents live in poverty, and rents are higher than average. The median gross rent is $1,046, and the median house price is $282,300.

    Crown Point is one of the safest cities in Indiana near Chicago, with a crime rate of 979 per 100,000 people, and in 2019, residents reported 290 property and seven violent crimes.

    8. Noblesville

    Noblesville is the county seat of Hamilton County. It’s a suburb of Indianapolis and belongs to the townships of Fall Creek, Delaware, Wayne, and Noblesville. Currently, the city has 69,604 residents.

    With a crime rate of only 1,007 offenses per 100,000 residents, Noblesville is among the safest cities in Indiana, and in 2019, the police reported a total of 32 violent and 618 property crimes.

    The first settler of the area was William Conner, the founder of Fishers. The second important settler of the town was Josiah Polk, and together they laid out the downtown and opened a trading post. 

    There are two stories of how the city got its name: The first claims that the city was named after James Noble, who was a U.S. senator, and the second says the city received the name after Lavina Noble, Josiah Polk’s fiancée. 

    As one of the best cities in Indiana to relocate to, Noblesville has a median household income of $82,218 and per capita earnings of $37,275. Around 6.5% of residents live in poverty, with the median house price settling a bit higher than in most other cities, at $284,600, and the median gross rent is $1,039.

    9. Portland

    Portland is the county seat of Jay County in Indiana. It’s part of Wayne Township, and the latest official data shows that the city has only 6,320. That makes it one of the best small towns to live in Indiana.

    The city’s history dates back to 1837 and it’s the only community in Jay County which didn’t change its original name after the county started developing. This town had only about 300 residents during the 1850s, but the population drastically increased by 1871 with the arrival of the first train.

    Residents of Portland earn below the Indiana average and have a high poverty level. The median household income in the city is $38,281, and the per capita earnings are $21,133, with more than 15% of Portland residents living in poverty.

    Still, Portland is among the top safest cities in Indiana. The city’s crime rate is 1,269 crimes per 100,000 people, and there were 65 property offenses and 12 violent crimes in Portland in 2019. Properties are inexpensive, with a median house price of $101,400 and a median gross rent of $660.

    10. Greenfield

    Greenfield is another city that’s also a county seat. It belongs to Hancock County and is part of the Indianapolis Metro Area. The city lies within the borders of Center Township and is one of the best cities to live in Indiana for all those looking for a medium-sized city with many fun activities. Around 23,488 reside in Greenfield.

    Greenfield used to be a vital stop along the Pittsburgh, Cincinnati, Chicago, and St. Louis Railroad. This railroad connected Pittsburgh to St. Louis and Chicago, and after forming Hancock County, residents decided to make Greenfield the county seat in 1828. In 1876, Greenfield officially became a city, and about ten years later, residents discovered natural gas, which led to a massive population boom.

    Greenfield’s economy is connected to the capital, and it’s one of the best areas to live in Indianapolis. Residents earn close to the state average, with per capita incomes of $27,590 and median household incomes of $53,270. Around 11% of people live in poverty. Rents are similar to the state average, with a median gross rent of $867 and a median house price of $191,200.

    Greenfield has a crime rate of 1,425 per 100,000 people, and in 2019, residents reported 304 property and 21 violent crimes.

    Safest Cities in Indiana

    11. Fort Wayne

    Fort Wayne is the center of Allen County, located in northeastern Indiana, and it currently has a population of 263,886 people.

    The United States Army built Fort Wayne in 1794 under the direction of General Anthony Wayne, after whom the city got its name. Throughout history, Fort Wayne was a famous manufacturing town on the Rust Belt. 

    Today’s economy is based on transportation, healthcare, services, distribution, hospitality, and financial services. It’s also a vital city for the defense industry, and due to its variety, Fort Wayne is among the best towns to live in Indiana for working people. The city has won an All-America City Award multiple times as well as an Outstanding Achievement City Livability Award.

    Salaries in Fort Wayne are below the average for Indiana, though, with per capita earnings of $26,970 and median household incomes of $49,411. Around 16% of residents live in poverty, and properties are cheaper than in most other cities. The median gross rent is $764, and the median house price is $172,600.

    The Fort Wayne, Indiana crime rate is above the state average at 3,123 per 100,000 people, and there were 7,437 property and 974 violent offenses in the city in 2019.

    12. Bloomington

    Bloomington is a city in central Indiana, and it’s the county seat of Monroe County. It currently has 79,168 residents, which places it on the list of top ten most populated cities in the state. As it’s the home of Indiana University Bloomington, the largest campus of Indiana University, a large number of residents are students. 

    Because of its youthful spirit, Bloomington is among the cities that first come to people’s minds when asked, “what is the best area to live in Indiana?”. 

    Bloomington was established in 1818 when a group of settlers from surrounding states discovered the “haven of blooms.” The first post office started working in 1825, attracting new residents, and two years later, Bloomington officially became a city of Indiana.

    Despite many awards praising its quality of living, salaries in Bloomington are below Indiana average. The median household income in the city is $37,077, and the per capita income is $23,816. More than 35% of residents live in poverty, which is almost three times higher than the state average.

    The Bloomington, Indiana crime rate sits at 3,194 offenses per 100,000 people, and residents reported 2,275 property and 463 violent crimes in 2019.

    If you still think moving to Bloomington is a good idea, the median gross rent is $917, and the median home cost sits at $256,600.

    13. Kokomo

    Kokomo is the county seat of Howard County. It’s also the principal municipality of the Kokomo Metro Area, which encompasses a total of six counties. Kokomo has 59,604 residents, and official numbers show a considerable increase in Kokomo’s population in recent years. The Indiana crime map may tell a different story, though.

    The city got its name after Chief Kokomo. He was a Native American of the Miami tribe who spent a part of his life in Indiana. The discovery of natural gas in the 1880s attracted many residents, which led to an economic boom. The automobile industry was also popular at that time, and it remains the staple of Kokomo’s economy.

    Residents of Kokomo earn below the state average, with the median household income being $45,797 and the per capita earnings of $26,398. Nearly 19% of residents live in poverty.

    The Kokomo, Indiana crime rate sits at 3,259 offenses per 100,000 people, which is above the state average, however, and in 2019, the police reported 392 violent and 1,493 property crimes.

    Properties are affordable, with a median house price of $124,800, and a median gross rent of $695.

    14. Muncie

    Muncie is the principal city of the Muncie Metro Area and the county seat of Delaware County. It’s located in East Central Indiana, around 50 miles away from Indianapolis, and according to the latest stats, the city has 65,194 residents. 

    This beautiful city is the home of Ball State University and is known as the best city to live in Indiana for researchers, as it’s one of the most studied places in the U.S. 

    When the Lenape people arrived in the area, they created a couple of small villages along the White River, and one of them was Muncie. The city’s original name was Muncietown, and it, at first, was a tiny trading post before becoming the county seat in 1827. Since then, it has become a manufacturing and industrial center. Muncie officially became a city of Indiana in 1865, and it experienced a rise in population after the Indiana gas boom.

    The Muncie, Indiana crime rate sits at 3,655 per 100,000 people, which is above the state average, and in 2018, residents reported 2,281 property and 219 violent crimes. The median household income is very low at $33,944, and the per capita earnings are $20,386, with over one-third of residents living in poverty.

    The city offers relatively low housing costs, with a median house price of $100,500 and a median gross rent of $722.

    15. Lafayette

    Lafayette is the county seat of Tippecanoe County, and it’s the principal city of the Lafayette Metro Area. It’s full of parks, museums, and things to do, but many wonder, “is Lafayette, Indiana safe?” due to the area’s growing reputation for crime.

    It was founded in 1825 when the first residents liked the area on the southeast bank of the Wabash River. The city gained its name after the French general Marquis de Lafayette, a hero in the Revolutionary War.

    The most recent data on the Lafayette population tells us that the city has 70,783 residents. Residents earn less than most other people living in Indiana, with per capita earnings of $26,197 and a median household income of $46,374. Nearly 17% of residents live in poverty.

    The Lafayette, Indiana crime rate is high and sits at 3,775 offenses per 100,000 residents, and there were a total of 352 violent crimes and 2,388 property offenses in Lafayette in 2019.

    Properties are not as cheap as the low income might make you think. The median house price in Lafayette is $176,300, and the median gross rent is $817.

    16. Gary

    Gary belongs to Lake County of Indiana and is only 25 miles away from Chicago, Illinois. The city is close to the Indiana Dunes National Park and Lake Michigan, making it an excellent choice for nature lovers.

    It was once one of the best places to live in southern Indiana, but now, Gary is practically a ghost town. Many residents claim that almost a third of the houses in the city are empty. Just like many cities in the Rust Belt, Gary experiences a decaying infrastructure and low employment rates. Today, Gary has only 69,093 residents.

    Gary was established in 1906 and gained its name in honor of the lawyer Elbert Henry Gary, the founding chairman of the United States Steel Corporation. In the first 30 years, Gary was among the most prosperous towns in the area, with over 100,000 residents.

    Today, the Gary, Indiana crime rate is 4,111 per 100,000 residents, which comes as no surprise considering the state of the economy. In 2019, residents committed 2,656 property and 414 violent crimes.

    The median household income in Gary is below average at $31,936, and the per capita earnings are just $19,448. More than 30% of residents live in poverty, and the median home cost is $57,100, and the median gross rent sits at $785.

    17. Evansville

    Evansville is the county seat of Vanderburgh County, and it’s the principal city of the Evansville Metro Area. It has 117,298 residents and ranks third on our list of Indiana towns by population. 

    This city is the hub of cultural, medical, and commercial activities in the south of the state. There are three NYSE companies with headquarters in Evansville: Berry Global, OneMain Financial, and Accuride. 

    The city’s nicknames are the “River City” and “Crescent Valley.” Evansville is the home of the University of Southern Indiana and the University of Evansville.

    Evansville became a town in Indiana in 1812, but its official incorporation came in 1817. The city got its name after General Robert Morgan Evans, an influential figure and the ninth Speaker of the Indiana House of Representatives.

    The Evansville, Indiana crime rate is 4,790 per 100,000 people. That’s over two times higher than the state average, and in 2019, the police reported 721 violent and 4,917 property offenses.

    The median household income in Evansville falls below the state average at $40,178, and the per capita earnings are $24,675. Almost 22% of residents live in poverty, but properties are inexpensive, with the median gross rent sitting at $774 and the median house price at $159,400.

    18. Anderson

    Anderson is the county seat of Madison County in Indiana, and the principal municipality of the Anderson Metropolitan Area. It’s not one of the safest counties in Indiana, but it is the headquarters of the Church of God and the home of Anderson University.

    Anderson was founded in 1823, where a Delaware Indian village once existed. It gained its name after Koktowhanund, also known as Chief William Anderson. The city’s population and economic growth started in 1886 when residents discovered an abundance of natural gas in the area. Currently, Anderson has 54,788 residents.

    Anderson residents have a lower quality of life. The median household income is $31,936, and the per capita earnings are $19,448. Over 30% of residents live in poverty, and the Anderson, Indiana crime rate is very high at 4,259 per 100,000 people. In 2019, law enforcement reported 2,096 property and 242 violent crimes.

    Property values remain low, with a median home value of only $73,000 and a median gross rent of $757, which is below the state average.

    19. Indianapolis

    Indianapolis is the state capital and the largest city in Indiana, and it’s the county seat of Marion County. According to the 2020 census data, “Indy” as many call it, has 887,642 residents.

    As it offers the largest number of options, Indianapolis is the first choice for many potential residents, which raises the question: “is Indianapolis safe to live?”. The city has a crime rate of 5,402 offenses per 100,000 people, and it’s among the most dangerous cities in the country. In 2019, residents reported 36,237 property and 11,170 violent crimes.

    Still, the population of Indianapolis has been on the rise for decades. It first became famous upon the completion of the National and Michigan roads and the arrival of the railway, giving it the nicknames “Crossroads of America” and the “Railroad City.”

    While it’s not the safest option to move to, Indianapolis offers so many possibilities. Some areas are better than others, so looking at the Indianapolis crime rate by neighborhood can help find a safe haven in this bustling metropolis. A typical home costs $183,000, and the median gross rent is $892.

    Residents of Indianapolis earn below the state average, with a median household income of $47,873 and per capita earnings of $28,363. About 18% of people live in poverty.

    20. South Bend

    As the county seat of St. Joseph County and one of the largest cities in Indiana, South Bend is a crucial region in the state. It’s the principal city of the South Bend Metro Area, and according to the latest estimates, it has 103,453 residents.

    The South Bend, Indiana crime rate is exceptionally high, with 5,545 offenses per 100,000 people. There were 1,357 violent and 4,296 property crimes in the city in 2019. 

    South Bend does offer many possibilities, however. The biggest industries in the city are education, tourism, health care, and small business. The city is currently developing a technology center, and officials believe it will attract new residents. They might be right because, despite being among the most dangerous cities in Indiana in 2021, the city is experiencing its first population growth in 50 years.

    The per capita income in South Bend is $22,863, and the median household earnings are $40,265. Nearly 24% of residents live in poverty, which is above the state average. The median gross rent is below average, at $789, and the median house cost is only $138,500.

    Safest Cities in Indiana – Conclusion

    If you’re looking for your next home in America’s midwest, Indiana is a popular choice. While its crime rate may not be ideal, when compared to its neighbors it’s a friendly and secure place with a rich heritage.

    Like with most places, the safest cities in Indiana are often the smallest ones, offering lower costs of living in exchange for lower levels of opportunity. That being said, it’s a great place for retirees looking for a quieter life or students who want to find themselves in a bustling University town.

  • 29 Alarming Violent Crime Statistics To Raise Awareness

    29 Alarming Violent Crime Statistics To Raise Awareness

    Violent crime highlights humanity’s ugly side. That’s why the law is very hard on violent crime perpetrators. Nevertheless, the latest violent crime statistics show that this kind of crime still occurs quite frequently. In fact, some forms of it happen at alarming rates.

    To shed more light on this issue, we gathered a series of insightful data on violent crime. This collection will show you just how the situation with violent crime in the US has developed over the years.

    From aggravated assaults to robberies, you’ll see dozens of stats that outline the most pressing violent crime problems in the United States. We’ll also present you with statistics from other countries around the world.

    While solving this problem is ultimately the authorities’ role, the best way to initiate change is to spread awareness.

    Top Stats on US Violent Crime Rate (Editor’s Pick)

    • In the United States, a murder happens every 32.5 minutes
    • In 2019, there were 1,690 homicides in California
    • There were more than 21,570 murder and manslaughter cases in the US in 2020
    • In 2019, D.C. had a reported crime rate of 1,049 per 100,000 people
    • The murder rate in Los Cabos, Mexico, is 111.3 per 100,000 people
    • Aggravated assaults comprised almost 70% of violent crimes in 2019
    • In 2019, 73.7% of murder cases in the US involved a firearm

    Recent Trends in US Violent Crime

    1. Most recent info suggests that one murder happens every 32.5 minutes in the US.

    (FBI)

    FBI violent crime statistics show that an instance of violent crime takes place every 26.2 seconds. Rape happens every 3.8 minutes, one robbery takes place every 1.9 minutes, and an aggravated assault occurs every 39.2 seconds.

    From this data, it’s clear that murder is among the rarest types of violent crime.

    2. In 2019, 7,484 murder victims in the US were Black individuals.

    (FBI)

    The data on homicide by demographic highlights that Black individuals make up a disproportionate number of victims per year.

    Violent crime statistics by race show that, out of 13,927 murder victims in 2019, almost half were Black males. To be more precise, 6,446 Black males and 1,035 Black females were victims of murder.

    Meanwhile, 5,787 white people were murdered in 2019. Out of those, 4,026 were males, and 1,759 were females.

    3. The US recorded over 21,570 murder and manslaughter cases in 2020.

    (Statista)

    Homicide and manslaughter rates have been descending over the years. Except for a few spikes, these rates have slowly been going down since the 1990s.

    To illustrate, national crime statistics show us that 2019 saw a slight decrease in murder and manslaughter cases than the previous year. However, there was a substantial increase in 2020 that hadn’t been reported since 1995. 

    4. In 2020, the United States reported 921,505 aggravated assaults.

    (Statista)

    An aggravated assault usually involves some sort of weapon with which the attacker can inflict a serious injury.

    According to violent crime statistics from 2019, when there were 822,017 cases of aggravated assault, that was the only type of crime that recorded a rise in the number of criminal cases in recent years. In 2018, there were 810,982 such cases.

    5. 243,600 robbery cases were reported in 2020.

    (Statista)

    Similar to murder cases, the number of robbery cases has also gone down over the years. Back in 1990, there were 639.270 reported instances. Although generally declining, they experienced a slight increase during the Great Recession from 2007 to 2009.

    Violent crime statistics show that the number of robbery cases is significantly higher than the one of murder cases.

    6. 126,430 rape cases were reported in 2020.

    (Statista)

    Unlike robbery and murder, rape cases’ trajectory hasn’t been nearly as steady. Over the decades, it has seen several dips and jumps. For example, the number of cases shot up from 85,141 to 143,765 between 2012 and 2018.

    Moreover, violent crime statistics in the US show that the number of rape cases has fluctuated in the last few decades. Law agencies reported 109,060 cases in 1992. From there, the number nosedived till 1999, when it reached 89,411 instances.

    In 2000, the number of rapes started growing again. Crime statistics in the USA show that they increased from 90,178 to 95,235 in 2002. 

    7. In 2019, California recorded 1,690 murder cases.

    (Statista)

    California has the largest population in the United States. Therefore, it makes sense that it also has the greatest number of violent crimes happening within its borders.

    Looking at the data on US murders per year, we can see that California had the most murders in 2019. Next on the list was Texas with 1,409, and the third was Florida with 1,122 murders.

    These three states also happen to be the ones with the most people. On the other end of the spectrum, Vermont and Wyoming, two of the least populated states in the US, had 11 and 13 cases, respectively.

    Highlights of the Violent Crime Rates in the US

    8. The arrest rate of violent crimes was 156.3 per 100,000 citizens in 2019.

    (FBI)

    Violent crimes happen less often than property crimes. The 2019 rate of the former was 366.7, while it was 2,109.9 for the latter. But proportionally, there are significantly more arrests for violent than for property crimes. In comparison, the arrest rate for property crimes was 343.3 per 100,000 citizens.

    9. For Black males, the murder rate per 100,000 people is 8.3 times higher than that of white males.

    (BJS)

    When we look at the US homicide rate, we can see that the Black males’ rate is 18.5 per 100,000 persons, while the white males’ rate is only 2.8. On the other hand, the Native American murder rate is 4 cases per 100,000 people. Meanwhile, the Asian rate is only 1.3—the lowest of all ethnicities in the United States.

    10. The rate of murder and nonnegligent manslaughter was five cases per 100,000 residents in 2019.

    (Statista)

    The 1990s had the highest crime rates in US history, violent or otherwise. For example, back in 1991, there were 9.8 cases per 100,000 residents. Nowadays, they’re remarkably low compared to that decade.

    11. Murder and manslaughter had a clearance rate of 54.4% in 2020.

    (Statista)

    Crime clearance means arresting a person for the crime they’ve committed and bringing them to trial. Alternatively, it can refer to a situation where a said person cannot be brought to trial because of uncontrollable situations (like death).

    According to violent crime rates, murder and manslaughter had the highest clearance rate in 2020. In second place was aggravated assault, with a rate of 46.4%. Overall, violent crimes had a 41.7% clearance rate.

    Property crimes had a significantly lower crime clearance rate of 14.6%. Out of these, different types of burglary and motor vehicle theft had 14% and 12.3% clearance rates, respectively.

    Violent Crime Statistics by State

    12. The District of Columbia’s violent crime rate in 2019 was 1,049 per 100,000 residents.

    (Statista)

    The District of Columbia had the largest number of violent crime cases per 100,000 people in 2019. In fact, it had the highest rate by a wide margin. The other two states that made the top-three list were Alaska and New Mexico, with 867.1 and 832.2 crime rates, respectively.

    The violent crime rate by state shows that all three states were far above the national average of 379.4 cases per 100,000 people. A total of 22 US states had above-average violent crime rates. With 381 cases for every 100,000 residents, Colorado had the rate closest to the average.

    13. In 2020, Maine had the lowest violent crime rate of 108.6 cases per 100,000 residents.

    (Statista)

    New Hampshire and Vermont were also among the safest countries in the US, with 146.4 and 173.4 violent crime rates per 100,000 citizens, respectively. These three states had the lowest violent crime rates by state in the US in 2020. 

    14. Louisiana has a homicide rate of 12.4.

    (World Population Review)

    Louisiana has an alarmingly high homicide rate, the highest in the United States. We can see the proof of this claim in the violent crime statistics from 2021. Just to compare, the other two countries with the highest homicide rate are Missouri and Nevada, with 9.8 and 9.1 homicide rates.

    15. Detroit had a violent crime rate of 1965.33 crimes per 100,000 residents in 2019.

    (Statista)

    According to violent crime statistics by the city, Detroit had the highest number of violent offenses in 2019.

    St. Louis was the second-most dangerous city with 1927.32 cases. Meanwhile, Memphis was third, reporting 1901.42 crimes per 100,000 citizens.

    16. The sexual assault rate in Alaska is 161.9.

    (World Population Review)

    Sexual assault statistics show that Alaska has an abnormally high number of rapes per 100,000 residents.

    The state’s rate is almost four times bigger than the average national US violent crime rate for this category. Despite this extremely high rate, rape isn’t the most common violent crime in Alaska. That would be aggravated assault.

    Apart from sexual assault, Alaska also has the third-highest crime rate in the US. Its authorities report 3,777.89 cases per 100,000 people. Violent crime makes 21% of all crimes in Alaska, whereas 79% are property crimes.

    Violent Crime Statistics by Country

    17. The city of Los Cabos in Mexico has the biggest murder rate in the world — 111.3 per 100,000 people.

    (Statista)

    All these statistics probably sound very concerning to you. But you’ll get a clearer picture of the situation when we compare the rates in the United States to those in other countries around the world.

    Violent crime rates by the city show that Los Cabos, Mexico, has the greatest number of murders per 100,000 people. Not far behind is Venezuela’s capital, Caracas, with a similar murder rate of 111.2.

    Interestingly, the majority of the world’s most dangerous cities are located in Central and South America. Cities like Acapulco, Natal, Tijuana, la Paz, and Fortaleza are in either Mexico or Brazil.

    The United States also has the highest violent crime rates by country, though only four cities are present on the said list. In the ascending order of crime rates, we have Detroit, New Orleans, Baltimore, and St. Louis.

    18. Australia has a homicide rate of 0.94 per 100,000 people.

    (World Population Review)

    In terms of homicides, Australia is considered one of the most peaceful countries worldwide.

    On the other hand, the Australian violent crime rate for rapes is relatively high. Research shows that the country’s rape rate is 28.6 per 100,000 citizens.

    While it is much lower than in South Africa (132.4) or Botswana (92.9), it’s far from the country with the lowest number of recorded rapes per 100,000 people (Azerbaijan with 0.2).

    19. El Salvador has the highest murder rate of 82.84.

    (World Population Review)

    According to the data on the violent crime rate by country, El Salvador has the highest murder rate per 100.000 residents. Jamaica is second with 57, and Honduras is third with a 41.7 murder rate.

    Violent Crime Statistics

    20. The highest rape rate is in South Africa—132.4.

    (World Population Review)

    South Africa has an extreme incidence of rape, outpacing any other country in the world. In second place is Botswana, with a 92.9 rate. The third is Lesotho, with an 82.7 rape rate.

    If we rank the countries by violent crime rate, South Africa is among the top five with 35.9. It sits just under Belize with 37.9.

    21. Japan’s homicide rate is 0.28.

    (World Population Review)

    Generally speaking, Asia is the continent with the lowest violent crime rates. Japan takes first place in Asian countries. Second is Indonesia with a homicide rate of 0.5, while in third place is China with a rate of 0.62 per 100,000 inhabitants.

    The Japanese violent crime rate is also very low regarding rape—1 case per 100,000 people.

    22. The crime rate in the UK is 96.4 per 1,000 people.

    (Statista)

    Regarding countries, England and Wales have the highest crime rate of 102.8, while Scotland recorded the most significant crime rate decrease, from 82.6 in 2002/03 to 45.1 in 2019/20.

    23. The number of homicides reached 809 in the United Kingdom in 2019/20.

    (Statista)

    UK violent crime stats show an increase in the number of homicides in 2019/20 compared to 2018/19. More precisely, the 2019/2020 period had 40 more cases than 2018/2019, during which 769 cases had been reported. This rise is related to a cut in resources and workforce UK law enforcement agencies experienced at the time.

    All the same, the figures show an overall decline in the homicide rate in the last 15 years. For example, the violent crime statistics by year show much higher numbers for 2002/2003. There were 1,215 homicide cases in that period — the highest number in the country’s recent history.

    The number of homicides in the UK began dipping this time. A year later, the number slumped by almost 200 cases. It continued dropping (with mild fluctuations) until 2013/2014. This was the period with the fewest homicides — 615 cases were reported in the UK.

    Violent Crime Facts

    24. In 2019, 68.2% of violent crimes were aggravated assaults.

    (FBI)

    Aggravated assaults account for the majority of violent offenses in the United States. In 2019, their rate was 250.2 per 100,000 residents.

    On the other hand, murder statistics show that it made up a much smaller percent of reported crimes. According to crime rates in America, approximately 1.4% were murders.

    25. Rape accounted for 8.2% of violent crimes in 2019.

    (FBI)

    Out of the total number of violent crimes in the States, rape accounts for a relatively small percent. Data from 2019 demonstrates this — the rape rate in 2019 was 29.9 per 100,000 people. When converted into the overall number of cases, almost 100,000 rapes were reported that year.

    US violent crime statistics show that, although relatively rare, rape cases aren’t the least prominent kind of violent crime. That title would belong to murder. In 2019, homicide accounted for 1.4% of all reported violent crimes.

    However, if we observe rape on a year-to-year basis, we can see a clear fall in its rate. According to the FBI’s stats on violent crime rates by year, the rape rate was 31 back in 2018.

    26. Firearms were used in 73.7% of murder cases in 2019.

    (FBI)

    The United States has a unique relationship with firearms. The country has relatively high gun crime rates, but guns are also an inseparable part of its history and culture. This makes the firearm crime problem difficult to solve. The statistics on gun crimes show that firearms are a part of most murder cases.

    Although most common, guns were not the only weapon used in murder cases that year. According to violent crime stats, knives and other cutting instruments made up 10.6% of all weapons. Moreover, perpetrators used other unknown but dangerous weapons (blunt objects, tools, and the like) in 11.4% of the cases.

    In 2019, the rarest murder weapons were so-called personal weapons. The United States violent crime statistics show that only 4.3% of murders were caused by personal weapons such as hands, fists, feet, and similar.

    27. 51% of US citizens think crime is a severe problem.

    (Statista)

    Some parts of the US have a bigger problem with crime than others. Crime rates significantly correlate with population density and living conditions.

    The violent crime statistics in the USA show that more than half of people think that crime in the US has gotten out of hand. Conversely, only 10% of US citizens think the crime rate in their area is a problem.

    Violent Crime Statistics #2

    28. In 2019, 5,319,654 white people were arrested.

    (FBI)

    Out of all the arrests in 2019, white people made up the greatest percentage in the United States. As the ethnic majority of the country, it makes sense that they took up the biggest share of arrests.

    According to the FBI violent crime statistics by race, out of 7,710,900 offenses in 2019, 2,115,381 arrested persons were African Americans.

    29. 5,012,260 males were arrested in 2019.

    (FBI)

    Data from the FBI shows that men are vastly overrepresented in criminal arrests. In fact, the number of arrested males is several times bigger than that of females.

    If we look at the violent crime statistics by gender, it is clear that males dominate this category. Out of 6,917,552 cases in 2019, only 1,905,292 were committed by women.

    Conclusion

    Crime is a part of our everyday lives. We can reduce it, but we can’t eradicate it without resorting to inhumane means. However, the situation could likely be better than it is now.

    From these violent crime statistics, we see that the violent crime rate is decreasing. Some crimes, such as rape, haven’t been dropping linearly for various reasons, but overall, the situation seems to be getting better.

    Especially compared with the 1990s, the rates of robbery, murder, aggravated assault, and rape have dropped significantly. For the most part, the downward trend is still present.

    That said, we are still far from living in the closest feasible version of a crime-free world.

    People Also Ask

    What is classified as a violent crime?

    A violent crime is when the victim is threatened or harmed with violence. The term “violent crime” usually includes homicide, murder, assault, manslaughter, sexual assault, rape, extortion, and kidnapping.
    Four types of violent crimes are dominant in the US — murder (including nonnegligent manslaughter), forcible rape, robbery, and aggravated assault. Furthermore, we should also note that different countries have different systems for reporting and recording crime.

    Is stealing a violent crime?

    It depends on the category “stealing” refers to. Robbery, for example, is classified as a violent crime. On the other hand, theft and larceny fall into the scope of property crimes.
    Robberies are fairly numerous in the United States, though not to an alarming extent. In 2019, there were almost 300,000 reported robbery cases. But compared to thefts and cases of larceny, they aren’t that prevalent in the States.

    What city has the highest crime rate?

    Detroit leads the way as the most violent city in the United States. In 2019, there were over 1965.33 violent crimes per 100,000 citizens. In second place was St. Louis with around 1927.32 crimes, and in third was Memphis with 1927.42 reported crimes per 100,000 inhabitants.
    However, the city with the highest murder rate worldwide is Los Cabos in Mexico, followed by Acapulco and the capital of Venezuela, Caracas.

    Why is violent crime decreasing?

    Violent crime decreases for a variety of complex reasons. The increase of resources for policing can contribute to curbing violent crimes. Moreover, better policies have a positive effect on reducing the violent crime rate.
    Law enforcement is not the only thing that makes violent crime go down. For example, improved living standards also make society safer. According to violent crime statistics, the reduced demand for hard drugs also leads to lower crime rates.

  • Workplace Violence Statistics Amidst a Global Pandemic

    Workplace Violence Statistics Amidst a Global Pandemic

    Since the start of the pandemic, we have been approaching our work and communicating with our colleagues in new ways. Still, workplace violence statistics don’t seem to have changed much. 

    It is still hard to put all the puzzle pieces together when it comes to 2020 statistics. The pandemic still lasts, and we have no idea when it will end. Thus, let’s look at the information available so far and see how to raise workplace violence awareness in our communities. 

    The Top 7 Workplace Violence Stats (Editor’s Choice):

    • There are four types of workplace violence
    • Every year, over 2 million U.S. employees experience workplace violence 
    • Around 27% of all violent workplace events are related to domestic violence
    • 85% of workplace murders involve firearms
    • Around 35% of female fatalities on the job are the result of homicide
    • About 86 police officers were fatally injured on the job in 2019
    • In the last two years, 8 in 10 teachers have reported being victimized in the workplace 
    • Over 75% of all registered nurses have experienced workplace violence

    Most Common Types of Workplace Violence

    As defined by the U.S. Department of Labor, workplace violence includes ‘any act or threat of physical violence, harassment, intimidation, or other threatening disruptive behavior that occurs at the worksite.’

    1. Four different types of workplace violence exist. 

    (AlertMedia)

    The term ‘violence at work’ implies a couple of different categories. Namely, there are four unique varieties of workplace violence generally defined on the basis of previous incidents and history of workplace violence. For example, the perpetrator might not have any connections to the workplace or the employees. Also, he could be in touch with the workplace and the workers.

    Another type includes a former or current employee showing violent behavior. The perpetrator can also have a personal relationship with employees and none with the workplace (women are mostly victims of the last type of workplace violence). 

    2. The most dangerous U.S. states to work in are Michigan, Montana, and Indiana.

    (Rave Mobile Safety)

    Workplace injury statistics by state have revealed the most dangerous U.S. countries. Even though states like California, Florida, Texas, and New York have recorded many workplace assaults, they aren’t the most hazardous to work (these states also have the highest number of employees).

    If we compare the percentage of the working population to the rate of fatal assaults in the workplace, Michigan is the most dangerous state to work in, with 41 deadly assaults in 2019; Montana is second, with 31 assaults, and Indiana third, with 28 recorded cases. 

    Workplace Violence Statistics 2020

    In 2020, most workers were working from home, so the conditions were different. Still, the rate of bullied workers didn’t seem to drop last year. 

    3. More than 2 million U.S. employees experience workplace violence annually.

    (shrm.org, AFL-CIO)

    Unfortunately, these numbers are somewhat vague because many victims don’t talk about the assaults for various reasons. In 2019, 841 people died due to workplace violence, while workplace harassment statistics show that over 30,000 people suffered nonfatal injuries related to violence.

    (U.S. Bureau of Labor Statistics)

    In 2019, an employee died every 99 minutes as a result of a work-related injury. That year was the worst in the last decade (from 2009 to 2019) regarding workplace death statistics, with 5 333 deceased employees in the U.S. only. The worst year sincer 1992 was 1995, with more than

    6 600 fatal work injuries. In conclusion, there were 3.5 fatalities per 100 000 full-time employees in 2019. 

    5. 24% of employees are aware of previous workplace violence incidents. 

    (shrm.org)

    Almost a fourth of all workers are aware of previous violent incidents in their company, as recent workplace violence statistics suggest. While more than half of the questioned employees (57%, to be accurate) answered they were unaware of any violence at their work, 14% reported at least one case in the previous year. 

    6. 12% of employees state that they feel unsafe at work.

    (shrm.org)

    Simultaneously, 2% of questioned employees expressed feeling ‘very unsafe’ at their workplace. This means almost every seventh worker doesn’t feel safe at work, as workplace violence stats indicate. In other words, if we assume that a working area consists of 10 employees, for example, that means every active group of employees has at least one employee that feels threatened and at risk at their workplace. 

    7. 78% of all workplace violence happens to Caucasian people.

    (NCVRW Resource Guide – Workplace Violence)

    Reportedly, 78% of known workplace victimization happened to Caucasian people, 9% to Black or African-American employees, while 8% of recorded cases to Hispanic or Latino workers. 

    Workplace Violence Statistics and Domestic Violence

    8. 27% of all violent workplace events are connected to domestic violence.

    (Alice Training)

    Up to 27% of all violent workplace incidents are somehow connected to domestic violence. Also, almost 80% of all recorded cases have nothing to do with the workplace but rather with a particular employee with whom the perpetrator has a personal connection, as the workplace conflict statistics indicate.

    9. Only 20% of U.S. companies offer training on domestic violence.

    (shrm.org)

    This number comes off as even smaller and less significant if we know that 19% of all surveyed companies reported violence cases at the workplace directly connected with domestic abuse in the past twelve months. Additionally, 16% stated to have had a similar incident in the past five years. 

    Workplace Homicide Statistics

    10. In 2019, 86 police officers were fatally injured at the workplace.

    (U.S. Bureau of Labor Statistics)

    The rate of fatal work injuries in police officers was 11.1 per 100,000 full-time employees. Moreover, 81.4% of them happened to officers between the ages of 25 and 54. According to violence in the workplace statistics, only 10.5% of the fatal injuries occurred to women officers. 

    11. In 2021, there were five fatal workplace shootings, as per workplace violence statistics by year. 

    (Statista)

    The workplace shooting which involved the highest number of fatalities was the Boulder supermarket shooting in Colorado. No one was injured, but ten people died. The other workplace shootings happened in Indiana, Georgia, and there were two shootings in California. 

    12. 85% of workplace homicides include firearms.

    (NCVRW Resource Guide – Workplace Violence)

    This number is quite devastating, but the good news is that the rate of workplace violence related to firearms has dropped significantly since 1995. The number of homicidal violent incidents with guns dropped by more than a half between 1995 and 2015, from 762 registered cases in 1995 to 354 in 2015.

    13. 35% of women’s workplace fatalities result from murders.

    (Law.JRank)

    Overall, there’s a significant difference in the number of men and women killed in the workplace. In fact, the available workplace death statistics note that only 15% of males who lose their lives on the job are murdered. 

    Former or current employees are accountable for around 5% of workplace homicides.

    Violence in the Workplace Statistics by Industry

    14. Law enforcement officers suffer the highest rate of nonfatal workplace violence.

    (NCVRW Resource Guide – Workplace Violence)

    Mental health workers come second, while transportation employees come third when the nonfatal workplace violence rate is in question. 

    15. 80% of teachers reported being victimized in the workplace in the last two years.

    (Rave Mobile Safety)

    Even though often overseen and neglected, violent behavior towards teachers is widespread. Not only did most of the teachers report victimization, but 44% of them precisely stated having been physically attacked, as well.

    When that happens, it’s best if teachers are equipped with pepper sprays to easily deter attackers.

    Workplace Violence Statistics in Healthcare

    16. One in every five cases of workplace injuries happens in the private health care industry.

    (U.S. Bureau of Labor Statistics)

    In 2019, almost 600 000 cases of nonfatal injuries and illnesses happened in the health care and social assistance industry, more than in any private sector. Manufacturing industries take second place, with more than 420 000 reported cases in 2019, as national workplace violence statistics revealed. Retail trade is close by, with almost 400 000 recorded cases. The same year, 2.8 million nonfatal injuries and illnesses happened in the private industry in general. 

    17. As per data from Cox Medical Center Branson, there were 68 injuries to health care workers in 2020. 

    (Advisory Board)

    Based on workplace bullying statistics, that represented a significant increase from 2019 when there were only 17 such injuries. 

    As we can see, violence against health workers has increased since the beginning of the pandemic. As a result, many hospitals take extra steps to protect their employees. 

    That is to say; Cox Medical Center Branson is going to provide 400 employees with panic buttons on their identification badges.

    18. 76% of all registered nurses stated to have experienced workplace violence.

    (What to Become)

    Unfortunately, a study conducted in 2019 reveals that only 20%-60% of all nurses decide to report workplace violence, no matter whether physical or verbal, even though most of them have gone through a violent workplace experience at least once. 

    19. Most states adopted enhanced penalties for violence against healthcare workers.

    (The New England Journal of Medicine)

    Workplace safety statistics affirm that 37 U.S. states have adopted protective laws for nurses and other healthcare workers concerning workplace violence. Expectedly, the content of these laws varies from state to state. Still, only three states have no enhanced penalties in any form (Montana, South Carolina, and Wyoming), while the other ten states adopted protection laws only for the first responders and EMS workers.

    Conclusion 

    It seems like even though COVID-19 pandemics have changed the way we work and interact with our employers, not much has changed when it comes to workplace violence statistics. The same industries have been in greatest danger as before—law enforcement, transportation, and (now even more) health care workers. Still, there is always the other side of the coin.

    For example, the number of workplace incidents that include firearms has decreased in the last two decades. In the end, the most important goal for every company should be to raise awareness of workplace violence and offer comfort and support to the workers affected by it. 

    People Also Ask

    How Many People are Killed Annually in Incidents of Workplace Homicides?

    Every year, unfortunately, there are many fatal workplace injuries. However, in 2020, that number was the lowest one since 2013. In detail, there were around 4,764 fatal workplace injuries in 2020, with an employee dying every 111 minutes from such injury.
    Moreover, with over 1,700 fatal injuries, the most frequent types of fatal injuries involve transportation.

    How Common Is Workplace Violence?

    It depends on the industry. For example, it is the most common in law enforcement and health care industries. Some numbers in these industries come off as more than alarming. For instance, up to 76% of all registered nurses reported having been victims of workplace violence at least once in their working life. Also, 80% of teachers state that they had been victimized at their workplace as well.

    How Many Workplace Violence Incidents Were There in 2020?

    There aren’t any exact numbers for 2020 so far, but there is accurate information about the previous years. For example, each year, there are approximately 2 million workplace violence cases in the U.S. only (both reported and non-reported). The year 2019 was the worst for death cases caused by workplace violence (more than 5 500 workers were fatally injured that year).

    Which Occupation Has the Highest Rate of Workplace Violence?

    Law enforcement officers take the first place when it comes to workplace violence. Still, other sectors are at high risk, as well. Health care workers (especially the ones working in the private sector) suffer from nonfatal violence. Also, transportation workers are at higher risk.

    What Percentage of Workplace Violence Is Tied to Domestic Violence?

    Even though the connection between these two types of violent behavior is often neglected, studies have shown that many victims who suffered workplace violence also suffered domestic violence. More than fourth of the registered cases (27% to be precise) suffered both types of violence. The victims, mostly women, in most cases of female harassment knew the perpetrator, as the workplace violence statistics indicate.

  • 30+ Horrific Data Breach Statistics & The Biggest Leaks

    30+ Horrific Data Breach Statistics & The Biggest Leaks

    The cost, frequency, and sophistication of data breaches are on the rise. According to the latest data breach statistics, some high-profile companies have been targeted by major cyber attacks. As a result, data privacy and security have moved to the forefront of boardroom visibility. 

    The result was new legislation in the US, Europe, and Australia, most of it coming into effect in 2018. Organizations must now adhere to new rules specifying user notifications and timeframes, business size applications, and reporting requirements. 

    Even without the fines, the cost of data breaches was already high. Still today, there’s the cost behind updating data systems, hiring forensic investigators to look into the incident, briefing the legal department, and paying up settlements with dissatisfied customers. This also includes the potential damages from the worst hacks involving espionage and IP theft, where your competitors can learn about your business practices and future plans.

    With all this in mind, what are the risks for you as a customer, as a social network user, or as a company?

    What particular type of data breach might affect you, depending on the data you’re storing? And how can data breaches be prevented?

    Check out these statistics and find out what you should be on the lookout for, as well as what steps you should take to minimize damage if you’ve been compromised.

    Important Data Breach Statistics (Editor’s Pick)

    • 58% of the victims are categorized as small businesses
    • 48% of data breaches involved a malicious or criminal attack
    • 13% of data breaches were initiated to gain a strategic advantage (espionage)
    • 27% of all data breaches are unintentional or inadvertent in nature
    • 59% of companies experienced a data breach after going through a third party
    • 68% of breaches took months or longer to be discovered.
    • Last year, 21% of companies experienced an attack or breach because of unsecured IoT devices

    Cybercrime Facts and Statistics

    1. You have a 27.9% chance of experiencing a data breach of at least 10,000 records. 

    With 6,466,440 records breached every day worldwide, this should come as no surprise. The threat is real and affects individuals and businesses alike. In both cases, the best steps to take are the following: act quickly, seek help, and stop the problem from spreading. The quicker the recovery, the less it will cost you, especially if you’re a small business. Unless you play it smart, you might not recover. 

    2. It takes organizations around 197 days to detect a breach.

    Cybersecurity statistics from 2018 by the Ponemon Institute provided this invaluable insight. The mean time to contain the breach (MTTC) was 69 days. Companies that contained a breach in less than 30 days saved over $1 million.

    3. The average total cost of a data breach is $3.86 million, and the average total one-year cost increase is 6.4%. 

    According to the Ponemon Institute, the overall cost of a data breach involves many more losses than you can imagine. There are the business disruption and revenue loss from system downtime, the lost customers that no longer trust your brand, the new customers you will fail to acquire, and finally, the lawsuits. 

    Recent trends suggest that the consequences of company data breaches are only going to get worse. The average total cost of a data breach, the average cost for each lost or stolen record (per capita cost), and the average size of data breaches have all increased. 

    4. The average cost for each lost record increased by 4.8%, from $141 to $148.

    The United States, Canada, and Germany continue to have the highest per capita costs of cyber breaches at $233, $202, and $188, respectively. Turkey, India, and Brazil have much lower per capita costs at $105, $68, and $67, respectively. The increase isn’t too worrying, but the steady rise is still underway.

    5. Europe’s General Data Protection Regulation fines for noncompliance may be as high as €20 million. 

    Paragraph 5 of Article 83 of the GDCR states that infringements can lead to huge fines for companies that have been hacked in Europe. The Office of the Australian Information Commissioner (OAIC) implemented the mandatory Notifiable Data Breach (NBD) Scheme in February 2018. This regulation requires organizations to notify the OAIC of data breaches likely to cause harm, while also notifying the individuals affected.

    The Australian practice seems like a particularly good idea since it usually takes companies ages to admit to data breaches. In the Adobe hacking case, for example, the firm had originally admitted that 2.9 million accounts had been affected. It was later revealed that this figure amounted to 38 million. 

    6. 73% of breaches are perpetrated by outsiders, 28% by internal actors, 2% by partners, and 2% by multiple parties. 

    The scariness of this stat mainly originates from the fact that 1 in 4 data breaches was the fault of one of a company’s own people. And we don’t mean the ones who clicked on a dodgy link. The 2018 Verizon Data Breach Investigations Report (DBIR) suggested that the insider attackers were mainly motivated by financial gain, espionage, and yes, honest mistakes. System admins are the top internal actors responsible for these recent data breaches, at 25.9% of the time.

    The report also suggests that organized cybercrime is the new guy in a hoodie. They have resources, large botnets, and the inner-workings of a legitimate company. State-affiliated groups were involved in more than 1 in 10 hacks worldwide. 

    Many of these types of attacks were used in a single breach, as is the case with malware and ransomware, as a diversion for data theft. It was therefore difficult to come up with the figure for every separate attack, so action varieties in breaches were introduced. The use of stolen credentials (hacking) took the lead, with RAM scraper (malware), phishing (social), and privilege abuse (misuse) trailing behind. 

    9. According to Verizon’s cyber attacks statistics from 2018, 24% of breaches affected healthcare organizations, 15% of breaches involved accommodation and food services, and 14% were breaches of public sector entities.

    The healthcare industry has the dubious distinction of being the only one that has a greater insider threat than an external one. This somewhat bleak finding is linked closely to the fact that there can be a large number of errors and employee misuse. Healthcare is almost seven times more likely to feature a causal error than other verticals in our dataset. 

    So how can security breaches be prevented in healthcare? One huge step would be refusing to pay ransoms, not to mention securing the connected IoT devices. Paying ransom might seem like the best option to a healthcare organization. This act, however, is a guarantee that more attacks will follow, as criminals now see them as a paying client. Also, the industry’s huge number of IoT devices increases the risk of quick and easy breaches

    10. 58% of the victims are categorized as small businesses. 

    Organizations with fewer than 250 employees are considered small businesses. Most people are surprised to hear that small businesses are hackers’ primary targets, but according to data on recent cyber security breaches, it’s true. These incidents never hit the news, which is probably why they’re so invisible. Remember the Target breach when tens of millions of people lost their credit card details to hackers? 

    Here’s what most people don’t know: Target’s network was infiltrated via a small HVAC company. The attackers then stole access credentials to Target’s network. Small businesses lack sufficient security measures and, most of all, properly trained personnel. They also neglect to back up their files or data (ransomware bait right there). And finally, they are often leveraged so that bigger companies can be hacked.

    11. 60% of small to mid-sized businesses forced to suspend operations after a cyber attack never recover enough to reopen for business.

    Within 6 months of a successful cyber attack, most businesses of this size never recover. Frankly, most small businesses lack the necessary resources to recover. Because of this, sometimes a cybersecurity breach can cost you everything. For this size of company, the IT department has to protect user identities, the devices used, their network, and their cloud services. This means they have to operate on 4 separate security platforms.

    Additionally, they usually lack proper insurance coverage and the means to pay any ransom in case of ransomware. They also lack the resources and the infrastructure to handle any damage to their reputation. 

    12. Over 6,500 incidents that resulted in compromised data were disclosed publicly in 2018.

    How many data breaches were there in 2018? The number of publicly known data breaches has decreased when compared to 2017, despite harsher breach notification legislation. Two-thirds of these breaches targeted businesses, according to a report from security intelligence vendor Risk Based Security (RBS). 

    13. A malicious email was the source of the installation of 49% of non-POS malware. 

    Social engineering seems to be hugely successful at extracting data. One of the most significant takeaways from this report is that phishing and pretexting represent 93% of social attack-based breaches. Email breaches continue to be the most common vector for launching social attacks, with 99% of the actors being external to organizations. 59% of phishing and pretexting attacks are motivated by financial gain, with an additional 38% attributed to corporate espionage. 

    14. 76% of breaches were financially motivated. 

    According to Verizon’s report, 68% of breaches take months or longer to be discovered. This gives criminals a lot of leeway for putting your data up for sale on the black market. In his 2018 report for Bromium, Dr. Mike McGuire combined the data he found on the dark web with a McFee report. 

    He devised the following data breach statistics: Credit card data is worth approximately $10 each (the average sale value per record in 2016/2017). With 1.5 billion pieces of stolen data available at $10, the total revenue is $15 billion. Banking or payment system data is worth $114 billion. Login credentials are worth approximately $495 million. Stolen cards have an estimated loss (in revenues) of $30 billion. And finally, the entirety of stolen data revenue amounts to $160 billion. 

    15. 13% of these breaches were initiated to gain a strategic advantage (espionage). 

    Some of the biggest cyber attacks show that advanced hacking groups are becoming bolder when conducting campaigns, with the number of organizations targeted by the biggest campaigns rising by almost a third. A combination of new groups emerging and attackers developing successful strategies for breaking into networks has seen the average number of organizations targeted by the most active hacking groups rise from 42 between 2015 and 2017 to an average of 55 in 2018.

    According to recent data on these breaches, hackers associated with China’s Ministry of State Security breached the Hewlett Packard Enterprise and IBM, then accessed their clients’ computers. Their recent network attacks could indicate that China’s strategic plan to produce higher value products and services is taking off, and foreign intellectual property is of value for this. 

    16. 68% of breaches took months or longer to be discovered. 

    The longer it takes to both detect and contain these breaches, the costlier the repairs—and the angrier your users. With the new legislature in Europe, Australia, and the US, a failure to notify your users or your superiors about a relevant breach will result in immense fines. And yet, new data breaches list imply that things are going to get worse.

    If you want to avoid sanctions in 2022, follow the prescribed security protocols, and notify the authorities as quickly as possible. Also, don’t be tempted to play along with the attackers or pay a ransom. This would put you on the “payer” list, thereby increasing your risk of repeated attacks significantly. 

    Major Cyberattacks and How to Avoid Them

    17. 97% of people are using their sensitive data on digitally transformative technologies.

    If faced with a choice between safety and convenience, most people choose convenience and run the risk of cyberattacks. The 2019 Thales Data Threat Report concluded that people are using, and therefore exposing, a huge amount of confidential data entrusted to them by their users. The sensitive data includes client information, credit card info, payment or financial details, intellectual property, and even business databases or contract records. 

    18. 44% of users consider the complexity behind data security as a perceived barrier to implementing it. 

    For reasons of competitiveness and usability, more and more companies are moving to cloud or multi-cloud environments. The job of storing data is done either by the company or a third party, which is then even more difficult to secure, says the 2019 Thales Data Threat Report. Most organizations find it difficult to manage all these internet security breach challenges and implement proper safety measures. What’s more, when it comes to smaller and mid-sized companies, budget restraints and staff shortages make this task even more difficult.

    19. IDG Research reports that 25% of companies don’t have a cloud-first policy. Security concerns played a big role in this. 

    The ongoing migration of data to the cloud increases security risks. The data is available to multiple corporations in a shared space, and readily available to the companies’ employees. As always, if it’s there so you could have easy access, the black hat hackers will also have less trouble getting their hands on it. In one of the biggest data breaches in 2018, Facebook compromised 50 million accounts. All the platforms and third-party services that use the Facebook login feature are now vulnerable. 

    20. 59% of companies in the UK and US experienced a data breach after going through a third party. Only 16% consider their third-party risk management systems effective enough. 

    The results of the third annual Ponemon Institute’s “Data Risk in the Third-Party Ecosystem” study remind us that the worldwide data hack risks are beyond our control more than we realize. Even with proper employee training, antivirus software, and firewalls, our data is at huge risk. A company might use a third-party hosting service that again works with a fourth-party systems integrator. The oversight of suppliers isn’t something many companies can afford or manage.

    To top it off, cyber attack regulations will hold your company accountable even if a third-party was at fault. Also, in the case of 2018’s US information security breaches, as many as 61% of companies had a vendor or third-party data breach. That’s up 5% from 2017, and 12% from 2016. 

    21. In a 2018 Ponemon Institute survey, 52% of organizations that maintained IoT inventory said they had at least 1,000 IoT devices. However, the real study average was actually 15,000. 

    Knowing exactly what type of data you are storing, where you are storing it, and what the potential liabilities might be is of vital importance when implementing data security. As AON’s 2019 Cyber Security Risk Report concluded, most people can’t even do that. What causes data breaches? Criminals and human error, naturally. But most of all, it’s the failure of organizations to mind the details and do a fair assessment of their disadvantages. Weak passwords, untrained staff, improper configuration, and an outdated OS are all on you.

    22. In the last year, 21% of companies experienced an attack or breach because of unsecured IoT devices, and 18% said the attacks were caused by third-party devices.

    In a more ridiculous recent cyber security breach, hackers stole a casino’s customer data via a connected fish tank. Attackers gained access to the casino’s high-roller database. Devices with simple functions and default passwords that are rarely changed (if ever) are particularly easy targets. An IoT attack is an easy way to gain a foothold into a network. 

    23. Media reports surrounding 2018’s data breaches have speculated that each company involved could face a potential fine of at least $500 million if certain GDPR violations are discovered. 

    Data breach statistics from 2018 and 2017 must have scared individuals and governments on a global scale to produce these regulations. In January 2019, Google was fined €50 million for their failure to disclose to users exactly how their data is collected across services, including the Google search engine, YouTube, and Google Maps. 

    British Airways could lose £500 million over the 2018 data leaks.

    24. Only 4% of breaches were “secure breaches” in which proper encryption was used and no stolen data could be taken advantage of. 

    According to Breach Level Index, nearly 10 billion records have been stolen or breached since 2013, and out of said breaches, only the measly 4% mentioned above did its job. Here’s the deal: it’s a bother for most companies to use proper encryption, so they often end up switching it off. Every time you want to perform any type of data-focused operation, you have to decrypt the encryption. This makes data highly inaccessible, and, as the stats tell us, unattractive to users.

    So how can you protect your customer data? Homomorphic encryption is one alternative that can help you work both quickly and safely. Homomorphic encryption gives companies an easy way to run analytics on their data while staying safe. Up until recently, this process was way too slow. However, BM’s homomorphic encryption now runs 75 times faster, according to a paper from the International Association for Cryptologic Research. 

    25. 27% of all data breaches are unintentional or inadvertent in nature, according to the Verizon report.

    So what percent of data breaches are caused by human error? Not many, and certainly less than there were in 2013. Back then, accidents were behind more than half of the data breaches that took place, according to the Information Commissioner’s Office. The figure covers human error and system glitches, including both IT and business process failures. 

    26. 48% of data breaches involved a malicious or criminal attack. 

    What causes the highest percentage of data breaches? Criminals, according to Verizon’s most recent report. They’re the bad guys with nasty intentions for organizations in all countries. The most common types of cybercrime include malware infections, criminal insiders, phishing/social engineering, and SQL (structured query language) injection.

    However, there’s a solution to thwart inside jobs by checking employees using criminal background check services. This way you’ll know who has a history in criminal activities and can easily find the perpetrator.

    Cyber Attack Statistics by Year

    27. In 2014, 145 million eBay records became compromised in a major breach.

    The attack, which took place sometime between late February and early March, allowed the attackers access to the names, encrypted passwords, email addresses, postal addresses, phone numbers, and dates of birth of eBay’s customers, ranking this event among the biggest corporate security breaches. eBay has come under fire over its handling of the breach, in which hackers accessed personal data of all 145 million of its users. 

    28. Yahoo’s data breach was even more massive, with 3 billion of its users compromised. 

    Yeah, that’s all of them—no user was left unbreached. The next biggest data breaches are the Marriott Hotel breach in 2018, with 500 million accounts hacked, and (you’re not gonna believe this one) another Yahoo hack from 2014. The 2014 breach also compromised 500 million user accounts. 

    A simple spear-phishing email gave the attackers access to millions of accounts making this one of the biggest data breaches of all time, but they only generated cookies for about 6,500 accounts. They targeted an assistant to the deputy chairman of Russia, an officer in Russia’s Ministry of Internal Affairs. Others belonged to Russian journalists, officials of states bordering Russia, and US government employees. 

    29. In the 2014 Sony data breach, $8 million was paid to employees over hacked data 

    The Sony Pictures breached data included personal information on employees and their families, employee emails, information on salaries, even copies of yet unreleased films. Soon after the breach, the hackers threatened another 9/11 attack if the movie The Interview, which portrayed an assassination plot against North Korea’s “Dear Leader,” was released in theaters. 

    Careers were ruined, anxiety, fear, and stress were high for everyone involved, and no amount of money was requested. This is one of those data breach examples where causing damage and embarrassment are the sole motivation. Remediation costs were first estimated at $40 million to $100 million. The eventual losses amounted to $100 million.

    31. In 2017, the Equifax data breach affected 143 million consumers.

    The attackers gained access to names, social security numbers, birth dates, addresses, and driver’s license numbers when this credit company was hacked. As many as 209,000 credit card numbers were also compromised. Analysts at William Blair estimate that Equifax’s costs for this crisis could run between $200 million and $300 million. And that’s after the insurance steps in. 

    32. The US Postal Service’s website exposed data on 60 million of its users.

    It took the US Postal Service a year to fix this security weakness. In one of the more alarming famous hacks, anyone who had an account at usps.com could view account details for some 60 million other users, and in some cases modify account details on their behalf. Interestingly, this case happened back in 2014. 

    33. In July 2016, WikiLeaks released 19,252 emails and 8,034 attachments that were stolen from the US Democratic National Committee.

    This is one of the most famous recent government breaches. Nearly 20,000 emails were released by WikiLeaks, providing an embarrassing inside look at the Democratic Party’s operations on the eve of the Democratic National Convention.

    34. Timehop, the social media app, had 21 million users’ data stolen.

    Timehop collects your old photos and posts them from your iPhone, Facebook, Instagram, Twitter, and Foursquare. They cash in on your nostalgia much like the memory feature on Facebook. This cloud data breach took advantage of an obvious flaw: the account was not protected by multifactor authentication. This attitude sometimes makes password-based breaches a breeze. 

    35. The 2019 Have I Been Pwned data breach made 773 million emails and passwords vulnerable.

    The world’s most wide-reaching data breaches (not counting Yahoo, of course, because nobody beats Yahoo), have found a challenger. In most more or less famous cyber attacks, a single site is affected. Nonetheless, this one contained emails and passwords from a number of breaches—a gargantuan compilation. Troy Hunt, the guy who discovered the breach, works with other security experts to record various data breaches on his database. Anyone can search an email on his website to check if they’ve been breached. 

    In an amusing turn of events, this database has been hacked, and this is now one of the biggest data breaches to date. The final installment on this list of breached data ought to remind you: change all your passwords. Get a password manager. And finally, generate strong passwords based on word combinations impossible to figure out.

    Conclusion

    In 2018, relevant data breach notification legislation came into effect and changed everything for most of the developed world, including Europe, the US, and Australia. The first thing you’ll need to do if you want to stay safe and not pay immense fines is check out the new requirements in your region. 

    Secondly, you need to assess what type of data you’re storing and where, along with any potential liabilities, like IoT devices you weren’t even aware you had. You remember the casino breach where attackers broke in via a fish tank, right?

    The costs of data breaches have increased, and yet companies and individuals worldwide don’t seem inclined to advance their security protocols. So what could companies do to protect your data from data breaches? They can manage their security across platforms and providers, train their staff to recognize phishing attacks, get in with the newest anti-malware software, and apply multi-factored authentication. 

    As an individual, you are advised to change your passwords regularly and get a password manager. Update your OS, and avoid downloading apps from dodgy sources. Data encryption is also a must, and if you’re a smaller company and work with your own device technology, make sure you check all your devices.

    After all, you might be used as a foot in the door for an attacker to target a larger company you’re working with. Current data breach statistics are looking bleak, but if you follow the right protocol and make a fair assessment of your potential weaknesses, you’ll minimize potential risks. And remember, don’t go cheap with your security, or a particularly successful attack might cost you more than you can handle.