Author: Damjan Milenkovic

  • Life-Saving Military First Aid Kit Options in 2024

    Life-Saving Military First Aid Kit Options in 2024

    Military medical kits include supplies to handle the leading causes of preventable death on a battlefield. The correct items can save a life, whether the danger is from uncontrolled blood loss from extremities, collapsed lungs, or obstructed airways.

    Only certified medical personnel used to provide medical help on the battlefield. However, nowadays, most soldiers are trained to give self or buddy-aid, which significantly improves survival chances.

    Every option from our curated military first aid kit list can help you save your own life or assist a comrade in need without waiting for a medic.

    Keep reading to find a suitable model for your needs.

    Our Top 3 Military First Aid Kit Recommendations

    1. Blue Force Gear Helium Whisper Micro Trauma Kit Essentials
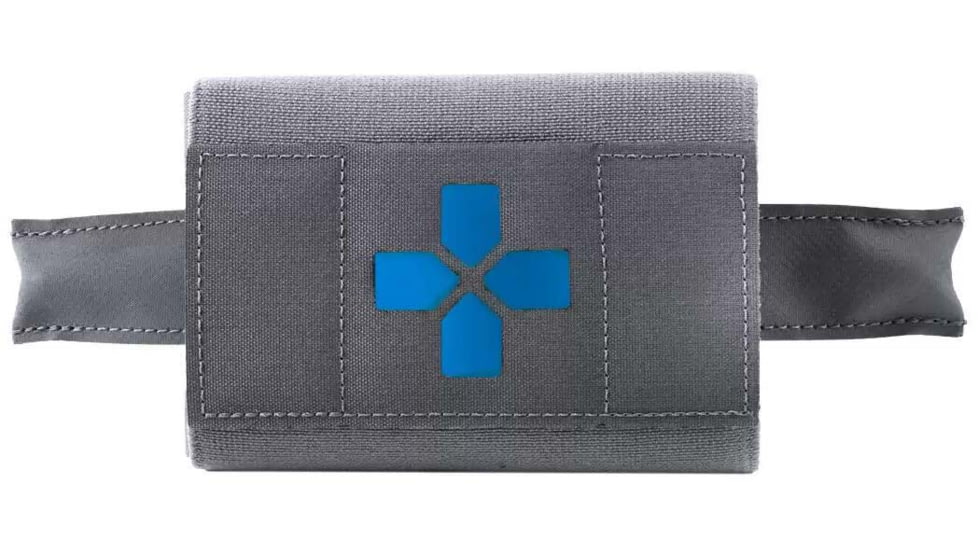
    Blue Force Gear Helium Whisper Micro Trauma Kit Essentials Supplies, Wolf Gray, HW-TKN-MTKN-ESS-WF
    Features
    • Versatile
    • Rugged bag with water and sand-resistant zipper
    • IR signature reduction hardware
    Price: From $44.99

    2. First MilitaryTrauma Kit (TMK-CL)
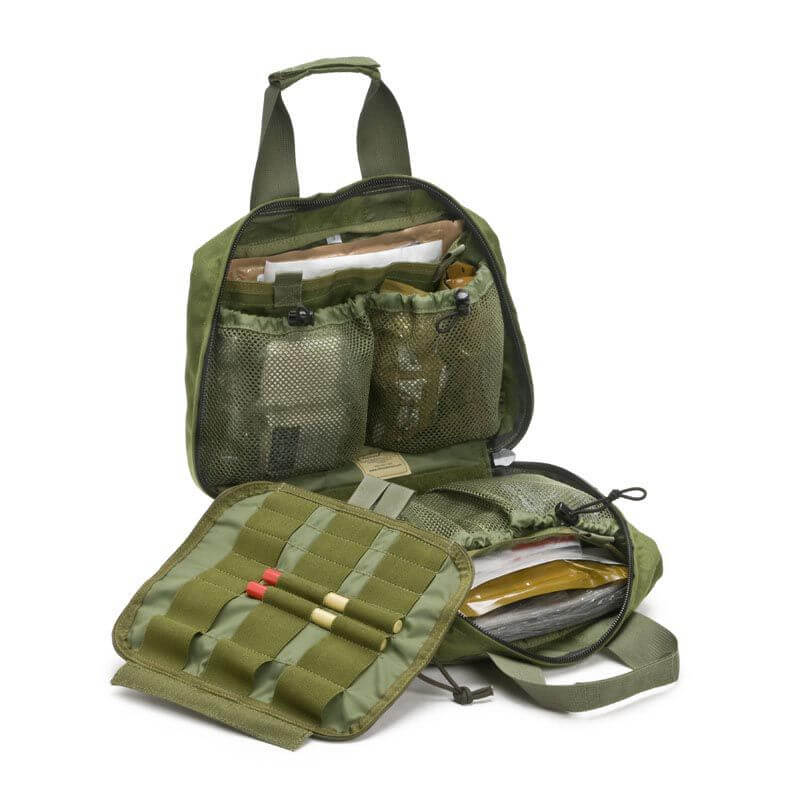
    Chinook Combat Lifesaver Kit (TMK-CL)
    Features
    • You can add your favorite hemostatic agent
    • Made in the US
    • Berry Amendment compliant
    Price: From $175.00

    3. First Military Medication Kit
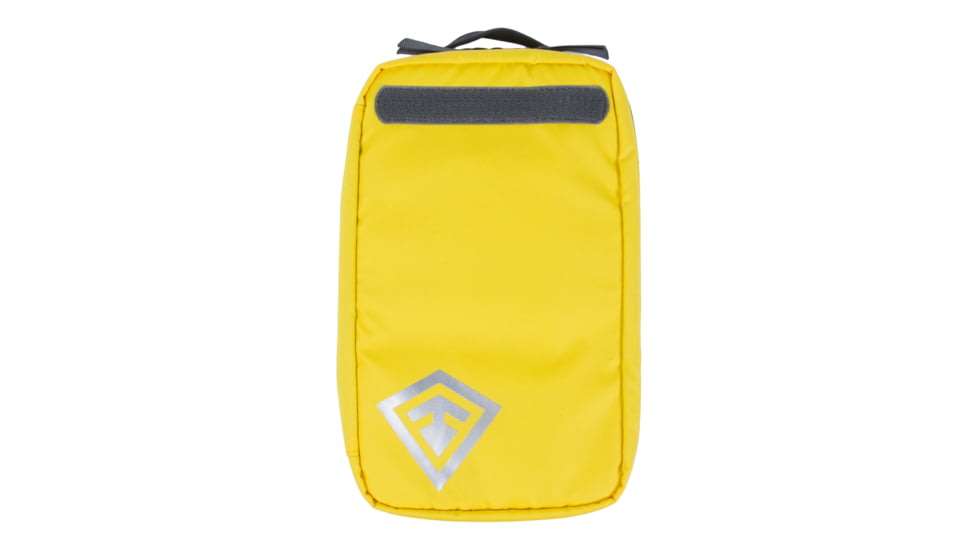
    First Tactical Medication Kit, Yellow, One Size, 180043-275-1SZ
    Features
    • High-quality vintage-looking bag
    • Convenient three-fold design
    • Over 300 items
    Price: From $16.95

    Best Military First Aid Kit Options for 2022

    Blue Force Gear Tactical Operator Response Kit
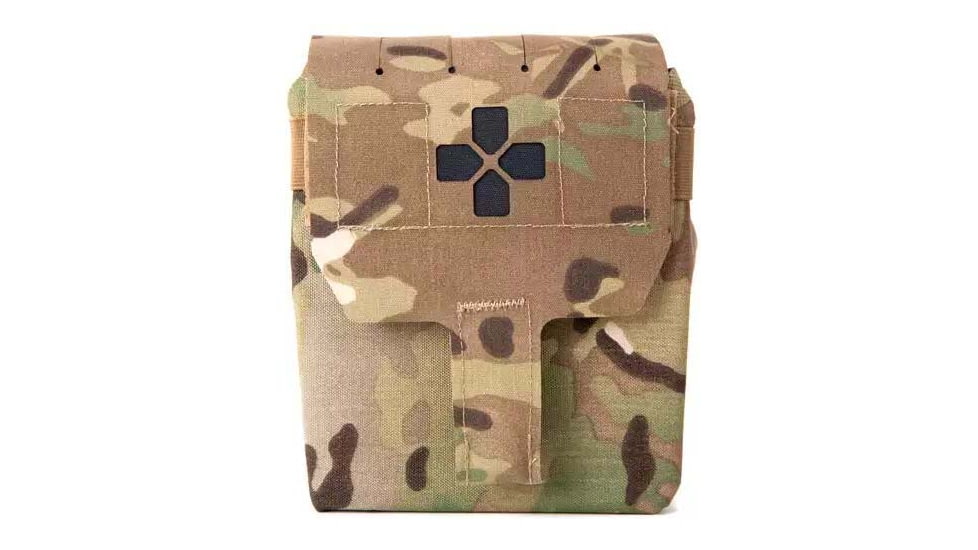
    Blue Force Gear Helium Whisper Trauma Kit Essentials Supplies, MultiCam, HW-TKN-MED-ESS-MC

    Price from $32.95

    Pros

    • Quick opening
    • Various content options
    • Best-quality items

    Cons

    • Requires Medical Device Authorization for purchase

    NAR developed their Tactical Operator Response IFAK for medics and military to prevent the leading causes of death in a tactical environment. 

    The nylon bag is compact, and MOLLE and PALS webbing allows it to be worn on body armor or a vest. Alternatively, you can separately buy the company’s Quick Detach Panel. NAR’s signature Red-Tip Technology one-pull tab makes opening the bag extremely rapid.

    T.O.R.K is the best IFAK for blast trauma and penetrating injuries. It consists of primary life-saving equipment, and you can choose between different options: 

    • The Basic kit holds a premium-quality CAT tourniquet, HyFin Chest Seal (twin pack), Nitrile gloves, trauma shears, emergency trauma dressing, S-Rolled gauze, and Polycarbonate eye shield.
    • The Basic with combat gauze kit focuses on stopping bleeding. It contains all of the items from the Basic kit, plus a Z-fold combat gauze (hemostatic dressing). 
    • The Advanced military med kit with combat gauze includes the items to handle airways obstruction — nasopharyngeal airway (28F) with lubricant, and ARS needle decompression kit (14 G needle, 3.25 inches long) are added to the contents of the previous kit.
    • The Advanced with ChitoGauze kit replaces combat gauze with ChitoGauze (PRO hemostatic gauze). The other contents are the same.

    Blue Force Gear makes among the best first aid kit models for military purposes. The price ranges from $80 to $150, but you know you’re getting products of outstanding quality. However, you need a Medical Device Authorization to purchase it.

    Blue Force Gear Helium Whisper Micro Trauma Kit Essentials

    Blue Force Gear Helium Whisper Micro Trauma Kit Essentials Supplies, Wolf Gray, HW-TKN-MTKN-ESS-WF

    Price from $44.99

    Pros

    • Versatile
    • Rugged bag with water and sand-resistant zipper
    • IR signature reduction hardware

    Cons

    • Only purchasable with Medical Device Authorization

    NAR’s Combat Casualty Response Kit is probably the best first aid kit for the money. It efficiently deals with the three leading causes of death caused by penetrating trauma — bleeding, tension pneumothorax, and airway obstruction. 

    The bag is made from durable 500 Denier CORDURA solution-dyed nylon with a zipper resistant to water and sand. It’s also self-repairing and features silent 550 cord pulls. The bag is equipped with Ghillie-Tex Near Infrared Signature Reduction hardware, meaning that an IR radar is less likely to detect you. 

    You can carry the kit in several ways — over-the-shoulder, fanny pack, MOLLE webbing, and with attachments for three-day assault packs. The enhanced hip stabilization makes it additionally secure. You can also get this military first aid bag separately.

    Some of the contents of the kit are: 

    • HyFin chest seal and petrolatum gauze 
    • Abdominal emergency trauma dressing 
    • Five pairs of Nitrile gloves 
    • Two ARS needle decompression kits 
    • Two CAT tourniquets and two SAM splints
    • Two 28F nasopharyngeal airways with lubricant 
    • Trauma shears 

    Shears are stored on the front part so that you can access them quickly. Keep in mind you can obtain Squad CCRT tactical first aid kit only if you have Medical Device Authorization.

    Rothco Surgical Kit
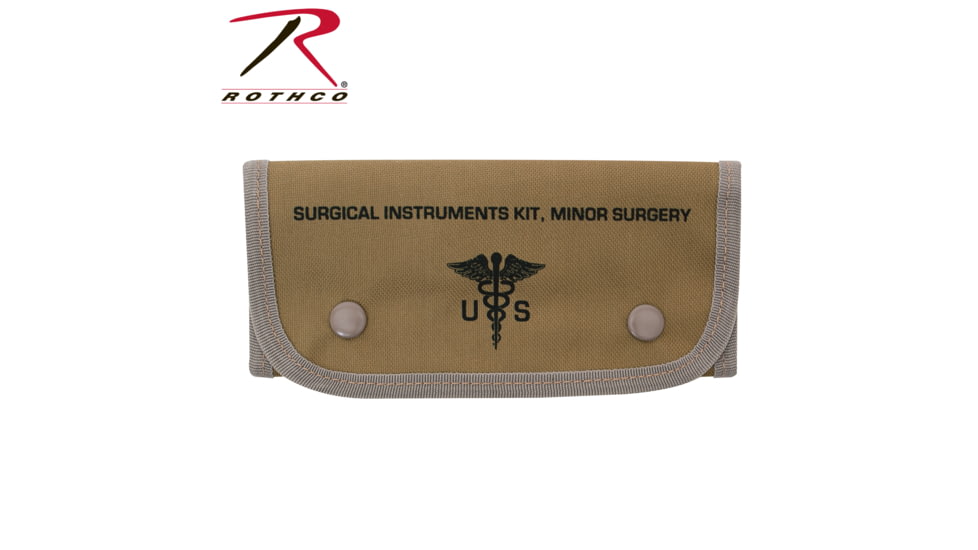
    Rothco Surgical Kit, Tan, 8306-Tan

    Price from $19.99

    Pros

    • Ideal for treating multiple patients
    • You can purchase module contents separately
    • M4L ballistic armored protection

    Cons

    • Very high price

    Savior 7 kit is a perfect match for tactical medics and active shooters. It’s great for treating multiple patients at once or when you can’t restock for a while. It follows the MARCH algorithm — Massive bleeding control, Airway management, Respiratory management, Circulation, Hypothermia. 

    It holds five identical modules with combat medical supplies, and each one is detachable. The MOLLE-compatible MERET Savior 7 PRO Combat Trauma System backpack is made from a 1200 Denier coated thermoplastic elastomer (TPE) that’s resistant to water and stains. 

    It is sleek enough not to slow you down or obstruct your movements, even in narrow or confined spaces. It features a four-point strap system attaching to a vest and disengaging rapidly using quick-release buckles.

    M4L Ballistic Armored Protection makes it one of the finest military medical bags on the market. In addition, it provides excellent armor protection to your vital chest region. 

    The shoulder straps, adjustable waist, and sternum belts are fully concealable. The handles on the top and the sides allow you to carry the bag that way. 

    The bag has zippered pockets to put QuikLitter (sold separately) or IV solutions. It opens by pulling on EZ-Pull to access the medical supplies immediately.

    Some of the RE Savior 7 military first aid kit contents include:

    • Two NAR CAT Gen7 tourniquets 
    • HyFin chest seal (twin pack) 
    • Trauma shears 
    • Two H&H flat fold Thin H bandages 
    • Two NAR S-rolled gauzes 
    • Two thermal blankets 
    • Two 28F nasal airways with lubricant

    Each module features a loop where you can put a label. Bleeding Control labels are available for purchase. Even though we heartily recommend the bag, we have to say it’s costly — short of 1000 bucks.

    If you don’t want to spend that much, you can get five army first aid kit modules separately in a sealed poly-bag for about $559.99. Rothco Surgical Kit offers payments in four interest-free installments with Klarna.

    First Military Trauma Kit

    Chinook Combat Lifesaver Kit (TMK-CL)

    Price from $175.00

    Pros

    • You can add your favorite hemostatic agent
    • Made in the US
    • Berry Amendment compliant

    Cons

    • Requires Medical Device Authorization

    TMK-CL comes in a MOLLE-compatible bag in multiple colors and is an excellent combat first aid kit. The bag has a removable central panel with loops for attaching smaller pieces of equipment. 

    It also features a bunch of mesh, canvas, and clear pockets and pouches, with zipper closure and elastic straps, and can be purchased separately. 

    500 Denier CORDURA nylon bags are made in the US and are Berry Amendment compliant. The waist strap can also be worn on the shoulder. Also, side straps prevent the combat medical kit contents from falling out even if the bag is open. 

    Some of the contents of the kit are:

    • Two CAT tourniquets and four compressed gauzes
    • Two Israeli bandages and an Israeli abdominal bandage
    • Two decompression needles
    • Two nasopharyngeal airways (28 F) with lubricant
    • Bolin chest seal and HALO chest seal (twin pack)
    • Splint and two Cravat triangular bandages
    • CoFlex UMAFD

    You can add the hemostatic agent of your choice to this field medical kit. You can pick among QuikClot, QuikClot XL, HemCon ChitoGauze, and CELOX. Bear in mind that you’ll need a Medical Device Authorization to purchase this kit.

    It may substitute some items to ship your kit on time. Unfortunately, they do not deliver outside the US.

    First Military I.V. First Aid Kit
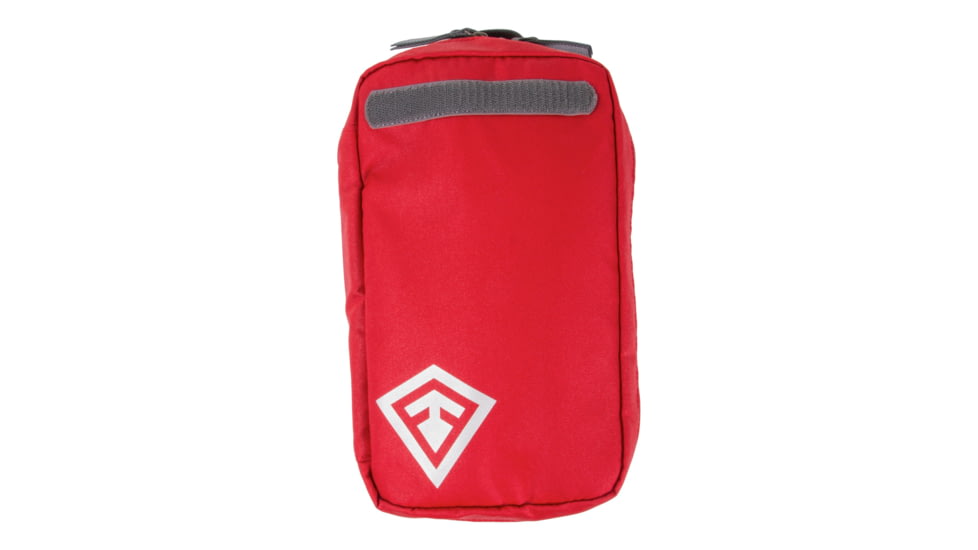
    First Tactical I.V. First Aid Kit, Red, One Size, 180042-400-1SZ

    Price from $44.74

    Pros

    • Padded back and adjustable shoulder straps
    • Easy access
    • Multiple compartments for convenient storage
    • Over 300 life-saving supplies and equipment
    • Features a hydration bladder port

    Cons

    • Heavy when fully loaded
    • No CAT tourniquet

    STOMP military medical kit comes either in a MOLLE backpack with multiple color options or as contents only. You can also get the empty backpack separately. It is made from durable nylon materials that withstand harsh conditions and regular use. 

    It has two interior sections with multiple compartments, including mesh pockets, velcro, and zippered pockets. The bag has MOLLE webbing so that you can attach additional military first aid pouches. 

    The front velcro is excellent if you want to attach patches or ID. This fantastic backpack even has a hydration bladder opening on the inside.

    It’s comfortable to carry, featuring a padded back, comfortable adjustable shoulder straps, and a waist belt. The top and sides also feature grab handles, and all zippers are waterproof. 

    The bag is designed to enable quick access to life-saving items. Each section can be opened flat, so the inside pouches and pockets are easy to see and reach.

    More than 300 professional items have you covered for any emergency. The military first aid items include:

    • Multiple pairs of Nitrile gloves 
    • Various bandages and wipes
    • Different hemostats and splints (universal and SAM)
    • Dressings (trauma, multi-trauma) and various gauzes
    • Two pairs of EMT shears
    • Eye-skin wash and pads
    • Butterfly closure strips, scalpel handle with multiple blades, and stethoscope 

    The kit doesn’t come with a CAT tourniquet, however. For the full list and more details about this military trauma kit content, visit it’s official website.

    The biggest downside of this kit is that the backpack gets really heavy when it’s fully loaded, especially if you add more of your own items to it. But, other than that, it’s a perfect medkit for trauma and basic needs.

    First Military Medication Kit

    First Tactical Medication Kit, Yellow, One Size, 180043-275-1SZ

    Price from $16.95

    Pros

    • High-quality vintage-looking bag
    • Convenient three-fold design
    • Over 300 items

    Cons

    • No CAT tourniquet

    The M-17 vintage military first aid kit bag remains true to its original Vietnam design, including olive drab color and classic metal parts, with slight updates concerning ergonomics. You can buy the bag, made from tough nylon fabric, separately. 

    It has a carrying handle and adjustable shoulder straps so that it can be worn both ways. Moreover, it features a web belt, sternum strap, and four adjustable side straps for additional contents’ safety.

    The three-fold pack features six individual interior pockets that allow easy access to over 300 items. M-17 army medical kit includes a wide assortment, and some of the products are:

    • Bandages, pads, and dressings
    • Wipes, bandage strips, and pads
    • Scalpel handle with blades, suture sets, and stethoscope 
    • Tongue depressors and airway
    • Tweezers, hemostats, and ammonia inhalants
    • Burn spray and burn aid packages
    • Trauma shears, butterfly strips 

    For a complete list and more details about the items, you should visit it’s official website. Unfortunately, this military medic kit also comes without a CAT tourniquet, but we recommend purchasing one separately.

    Rothco MOLLE Military Trauma & First Aid Kit Pouch
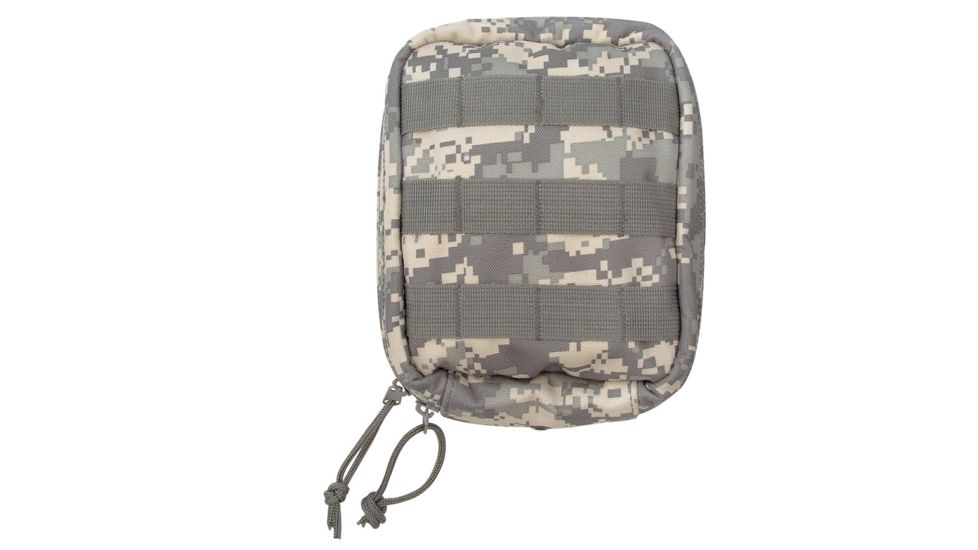
    Rothco MOLLE Tactical Trauma & First Aid Kit Pouch, ACU Digital Camo, 9766-ACUDigitalCamo

    Price from $31.99

    Pros

    • Excellent-quality CORDURA nylon bag
    • Berry Amendment compliant
    • Eligible for FSA, HSA, and HRA reimbursement
    • Easy-to-open vacuum-sealed trauma kit

    Cons

    • Medical Device Authorization needed

    Rothco MOLLE compliant and US-made. It offers some of the best trauma kit options you can buy. Its trauma kit pouches come with a Fatboy or a Tallboy design in multiple colors. Both open rapidly, with a pull of the handle, and are MOLLE and PALS-compatible. 

    The bags are 500 Denier CORDURA nylon with cloth interior, binding tape on all seams, and dirt-resistant zippers. They have a central compartment, two interior pockets, an inside flap with webbing, and shock cord closure. 

    With the bag, you’ll get an ITS Med PVC patch that you can attach to velcro on the outside and a replaceable shock cord and cord lock. You can purchase ITS military first aid kit bags empty, or you can select some or all of the following: 

    • ETA trauma kit
    • SOFT-T tourniquet
    • CAT tourniquet
    • A pair of long or short MALICE clips
    • Clauss titanium bonded shears 

    The ETA trauma kit treats the leading preventable causes of death. It features vented chest seals, QuikClot gauze, 28 ft nasopharyngeal airway, decompression needle, compressed gauze, pressure dressing, and a pair of Nitrile gloves. 

    It’s vacuum-sealed in ITS puncture-resistant TruFlex material, which is more durable than others on the market. It also opens more quickly than other comparable products. 

    ETA military emergency medical kit is exceptionally compact, too. It fits in your pocket, any bag, glove box, and, of course, in a Fatboy or Tallboy pouch.

    This kit is eligible for FSA, HSA, and HRA reimbursement. In addition, it offers free shipping on all US orders that exceed $75 and for all US members.

    However, if you don’t have the Medical Device Authorization needed for purchasing this kit, you should consider another military first aid kit for sale.

    What is Medical Device Authorization?

    Reading this article, you’ve noticed particular kits require a Medical Device Authorization to purchase. So, what is it, and why is it so important?

    Although many medical devices are widely available without any authorization or prescription, some are FDA-restricted. For example, a prescription medical device labeled “Caution” or “Rx Only.” is the QuikClot combat gauze found in many military medical kits. 

    FDA guidelines’ definition for a prescription device is as follows:

    A device which, because of any potentiality for harmful effect, or the supervision of the method of its use, or the collateral measures necessary to its use is not safe unless under a practitioner licensed by law to direct use of this device, and hence for which adequate directions for use cannot be prepared.”

    A lot of military first aid kit options on the market include items with the characteristics mentioned above. That means that an “Rx Only” device can be purchased exclusively by a licensed medical practitioner.

    Consequently, Federal law demands that you present a valid license if you’re a healthcare provider or if you’re working under an individual who’s licensed to purchase them. In any other scenario, you won’t be able to buy such kits. 

    People Also Ask

    What goes in a military first aid kit?

    These kits must contain items that address the three leading causes of preventable death on a battlefield — blood loss, obstructed airways, and collapsed lungs. The contents should be packed into a waterproof or water-repellent bag or utility pouch.
    Some of the recommended items include:
    – Tourniquets 
    – An assortment of bandages (elastic and triangular)
    – Israeli dressings
    – Pressure dressings
    – Combat gauze (hemostatic)
    – Nasopharyngeal airways
    – Chest seals
    – Abdominal pads
    – Surgical adhesive tape

    What is in a Level 3 first aid kit?

    Level 3 first aid kit is designed for high-risk or large worksites that are more than 20 minutes surface travel from medical aid or hospital. Some of the items in these kits include but are not limited to:
    – Emergency blanket
    – Adhesive dressings
    – Adhesive tape rolls
    – Tourniquet (windlass style)
    – Triangular bandages
    – Sterile pressure dressings
    – Sterile abdominal dressings
    – Conforming gauze bandages
    – Sterile gauze dressings
    – Face shields

    What is the best IFAK?

    NAR’s Tactical Operator Response Kit (TORK) is among the best options. Not only does it come in a compact MOLLE bag with a one-pull tab for rapid access, but it can also be customized to your needs. 
    NAR offers several options for kit contents: 
    – Basic — CAT tourniquet, HyFin Chest Seal (twin pack), Nitrile gloves, trauma shears, emergency trauma dressing, S-Rolled gauze, and Polycarbonate eye shield;
    – Basic with combat gauze — everything listed above plus Z-fold combat gauze; 
    – Advanced with combat gauze — added combat gauze, nasopharyngeal airway with lube, and needle decompression kit;
    – Advanced with ChitoGauze — the same as the previous model with ChitoGauze instead of combat gauze.

    What is the best first aid kit?

    Our recommendation for an excellent model is the Combat Casualty Response Kit (Squad CCRT) from NAR. It addresses the leading causes of death — hemorrhaging, airway obstruction, collapsed lungs. 
    Furthermore, the bag is tough, with water and sand-resistant zippers. And finally, it features Ghillie-Tex Near Infrared Signature Reduction hardware, so you’re less likely to be detected by an IR radar.
    This NAR’s military first aid kit comes with a wide variety of items, some of which are:
    – HyFin chest seal
    – Petrolatum gauze
    – Abdominal emergency trauma dressing 
    – Nitrile gloves
    – Needle decompression kits
    – CAT tourniquets

  • 20 Employee Theft Statistics You Need to Know in 2024

    20 Employee Theft Statistics You Need to Know in 2024

    Corporations and businesses lose millions every year due to employee theft. While it might not seem like a prime financial concern, it can cripple a company if it gets out of hand.

    To understand this problem better, take a look at this list of employee theft statistics. We’ve collected the data that best highlights how harmful employment theft is for individual businesses and on a larger scale.

    Here, you’ll learn about the costs of employee theft, embezzlement, insider data breaches, and much more. This article will illustrate how dangerous it can be to lose control over employees’ wrongdoings.

    Staggering Workplace Theft Statistics (Editor’s Choice)

    • Over 90% of all businesses have dealt with employee theft
    • Employee dishonesty costs US businesses $50 billion annually
    • On average, embezzlers steal over $350,000
    • Businesses generally recover almost 40% of embezzled funds
    • Six out of ten dentists are victims of embezzlement.
    • Time theft leads to companies losing around $400 billion a year
    • On average, dishonest restaurant employees steal $1,900

    Stats on Employee Theft Cases

    1. Over 26,000 employees were apprehended for stealing in 2020.

    (Jack L. Hayes International)

    Employee theft statistics 2020 reveal a significant decrease in such incidents — 20.3% less than in 2019. In these cases, $32 million were recovered. 

    “Essential” retailers, however, report 2.7% more dishonest employees than the previous year.

    2. 95% of all businesses suffer employee theft.

    (CompareCamp)

    Almost every business in the US has reported employee theft cases. In over 50% of the instances, the loss was in office supplies or the use of company equipment for personal benefit.

    3. Every year, US businesses lose $50 billion to employee dishonesty.

    (Embroker, ISN)

    On a national level, the US suffers staggering losses because of employee dishonesty (stealing, being unproductive, etc.). Employee theft statistics show these losses aren’t distributed evenly. Research suggests that one in three business failures happens due to internal theft.

    4. In the US and Canada, noncash assets made up 18% of all asset misappropriation cases in 2020.

    (ACFE)

    The term “asset misappropriation” describes a wide range of activities — cash larceny, unauthorized expense reimbursements, skimming, and more.

    Some of the most frequent schemes with the highest embezzlement incident rate in Canada and the US are corruption (33%), billing (26%), and expense reimbursements (19%).

    Embezzlement Statistics

    5. Embezzlement costs a company $357,650 on average.

    (Embroker)

    Embezzlement schemes can go undetected for a very long period while draining the organization’s funds. Employee theft statistics show that the average embezzler works for eight years for the company before getting caught.

    6. 33% of embezzlement perpetrators work in accounting or finance.

    (The Balance SMB)

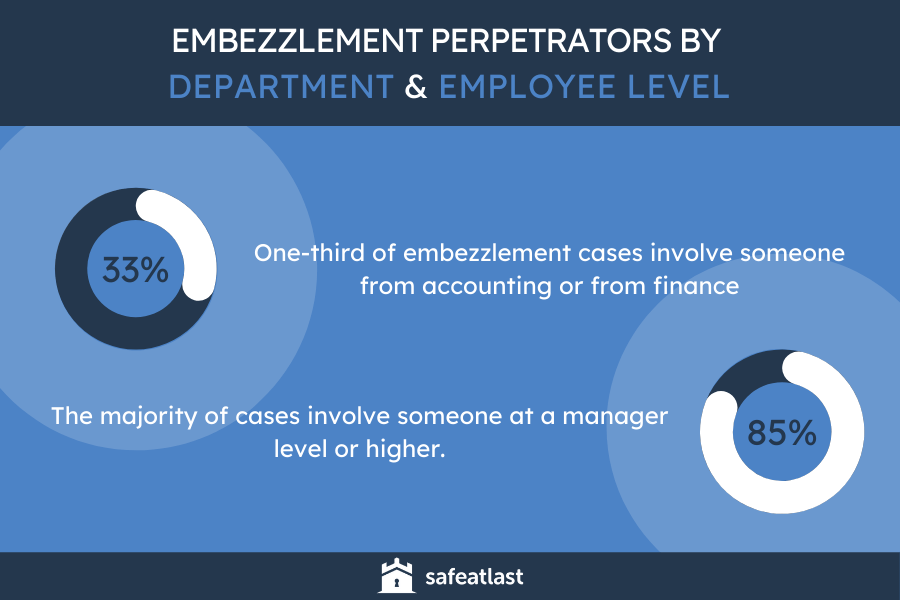
    Accounting fraud statistics show that one-third of embezzlement cases involve someone from this department or from finance as the perpetrator. Meanwhile, 85% of the cases involve someone at a manager level or higher.

    Employee Theft Statistics

    7. 70% of embezzlement cases last longer than a year.

    (The Balance SMB)

    At the same time, employee embezzlement statistics show that around 30% of embezzlement cases last three years or longer.

    8. On average, businesses recover 39% of embezzled funds.

    (The Balance SMB)

    According to the employee theft stats, businesses typically get back less than half of their stolen money by restitution, settlements, or insurance.

    9. Church crime would account for over $80 billion by 2025.

    (Brotherhood Mutual)

    Fraud occurs in all kinds of religious institutions, and almost anyone with influence can divert a part of the church’s funds to themselves.

    Church embezzlement statistics show an increase in wrongdoings by 6% every year, and 80% of such cases go unreported to law authorities.

    10. Three out of five dentists are victims of embezzlement.

    (Dental Town)

    According to the most recent dental embezzlement statistics, most practicing dentists will become victims of embezzlement at least once in their careers.

    The average scheme lasts between two and five years and results in over $100,000 loss for the practice. 

    11. 79% of embezzlement incidents involve more than one person.

    (The Balance SMB)

    Embezzlement schemes are usually complex. The perpetrator often convinces others to cooperate to stay undetected, as shown by employee data on theft statistics.

    12. Cash makes up 34.5% of all asset misappropriation in nonprofit organizations.

    (MIP)

    The top three kinds of fraud are asset misappropriation, financial statement fraud, and corruption. Of these, misappropriation with cash, such as skimming, larceny, and register disturbances, are by far the most common, nonprofit embezzlement statistics reveal.

    Annually, nonprofit organizations lose a median of $168,000 to employee theft. Embezzlement and check fraud account for $158,000.

    Costs of Internal Theft Statistics 

    13. As per The 2020 National Retail Security Survey, shrink represented 1.62% of a retailer’s bottom line.

    (NRF)

    In retail, shrink refers to inventory loss due to employee theft, shoplifting, damage, or inventory mismanagement. 

    The shrink mentioned in the statistic above resulted in $61.7 billion worth of costs for the industry. Furthermore, 70% reported a shrink rate of over 1%. 

    Retail employee theft statistics confirm that almost 50% of the increase was noticed in in-store-only sales. Comparatively, 26.1% was detected in online-only sales. 

    14. Time theft costs companies around $400 billion every year.

    (Connecteam)

    Time theft is a big issue well worth addressing. A business that doesn’t keep track of employee productivity can lose tremendous amounts of money.

    According to employee time theft statistics, it affects 75% of the companies in the US and accounts for $400 billion in losses every year.

    15. Walmart loses $1.5 billion to shoplifting and employee theft.

    (Forbes)

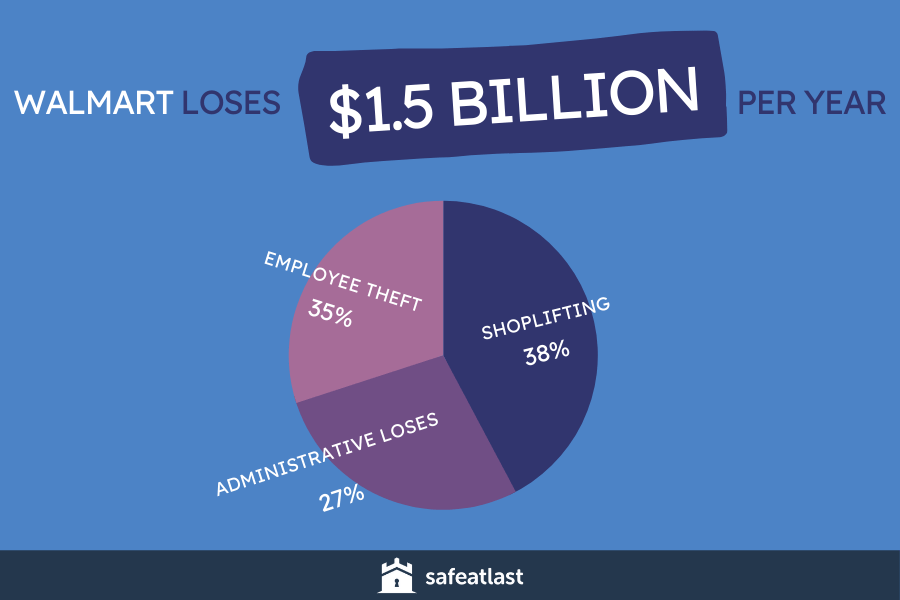
    Walmart is the biggest retail chain in the US. The retailer loses around 1.4% of sales revenue to shrinkage, accounting for $1.5 billion per year. 

    Diving further into the Walmart employee theft statistics, 38% of the losses are due to shoplifting, 35% — employee theft, and administrative make up 27%.

    Employee Theft Statistics 2

    16. The median loss caused by employee fraud in the banking industry is $110,000.

    (ACFE)

    Statistics on bank employee theft point to a high median cost. For comparison, the median cost in retail is $50,000 and in education — $68,000. There are 366 fraud cases in the banking industry every year. 

    The communications and publishing sector has only 24 cases yearly but the highest median cost of $525,000.

    Data on Employee Theft by Industry

    17. 60% of data breaches happen because of insider threats.

    (Security Intelligence)

    Over half of cyber breaches originate from the inside. That means an employee either intentionally helps cybercriminals or makes a mistake they can exploit.

    According to workplace theft statistics, the costs of insider threats add up to $8.76 million annually.

    18. Occupational fraud accounts for $7 billion in losses worldwide annually.

    (ACFE)

    According to the most recent employee theft research, there are approximately 2,690 cases of fraud around the world, with a median cost of $130,000.

    19. The average dishonest restaurant employee steals $1,900.

    (DIGIOP)

    Restaurant employee theft facts show that the most used fraud is refund for cash or POS fraud. It involves reporting a refund for a meal even though no customer asked for it and taking the money.

    Dishonest restaurant employees can get away with stealing nearly $2000 before anyone notices. 

    20. There were 453 arrests for internal mail theft in the US postal service October 2020–September 2021.

    (USPS OIG)

    The US Postal Office theft statistics show they conducted 1,472 investigations. Consequently, there were about 1,042 administrative actions against dishonest employees. On top of that, over $162,000 was returned to the Postal Service. 

    Conclusion

    Worker theft is a silent yet deadly issue that can end many businesses. Sadly, it doesn’t get nearly enough time under the spotlight, allowing most perpetrators to get away with it.

    The reasons people steal from their employer are numerous — insufficient salary and unpleasant work environment are among the prime ones. All the same, realizing how common the problem is in the first place is pivotal to addressing it. 

    While some industries are more affected, employee dishonesty is widespread, resulting in over $50 billion in losses yearly.

    Therefore, businesses should heavily consider installing a security camera system in place to deter or identify the perpetrators.

    People Also Ask

    How common is employee theft?

    Employee theft is prevalent — 95% of all businesses have had workers stealing from them. These incidents result in $50 billion in losses every year.
    Cash asset misappropriation is a widespread kind of employee theft. It comprises around 34.5% of all instances, while noncash makes up 21%.

    What percentage of shrink is employee theft?

    Employee theft and shoplifting cause the vast majority of shrinkage overall.
    The available data reveals that around two-thirds of inventory shrinkage happens because of employee theft. On the other hand, between 30% and 40% of shrink is due to shoplifting.

    How does employee theft affect other employees?

    Employee theft usually causes the management and other employees to feel tense and don’t trust each other. It can slow down productivity and make it difficult for the staff to concentrate on their given tasks.
    The psychology of employee theft tends to be contagious. Such instances can inspire more workers to join in or steal on their own. This trend tends to die off suddenly whenever management notices the theft or finds the culprit(s).

    Do employees steal more than customers?

    The difference between how much customers and employees steal varies from one industry to the next. In many instances, however, employees are the ones stealing more.
    That applies to industries with common occurrences of shoplifting. For instance, employee theft statistics in retail highlight that workers are responsible for more inventory shrink than customers. More precisely, around 60% is attributable to employee theft, while 30-40% is due to shoplifting.

  • 20 Social Media Statistics You Need to Know After the Pandemic

    20 Social Media Statistics You Need to Know After the Pandemic

    In the new world after a global pandemic, much has changed, including social media statistics. Lockdown orders and social distancing measures completely changed the way that we relate to each other, going from meeting up at a local bar or restaurant, to interacting with friends and family through social media and zoom calls. 

    This increase in using phones and computers to salvage some sort of social life has shown some interesting effects in a post-pandemic world. For better or for worse, if social media wasn’t a big part of our lives before COVID-19, it is now.

    The Top 8 Social Media Statistics (Editor’s Choice)

    • During the pandemic, ad engagement increased by 15%
    • More than 4.14 billion people are actively using social networks
    • Over seven in ten marketers say social media marketing was effective for their business
    • During the pandemic, almost nine in ten users reported using social media more 
    • 72% of respondents regularly use Facebook
    • In 90% of the countries globally, Facebook is the leading social network 
    • In only a year, the use of memes has increased by 26% 
    • More than 210 million people worldwide suffer from social media addiction

    In 2020, new consumer needs appeared with the increase in social network usage. People are now, more than ever, using and engaging in social media platforms for communicating, watching, creating, and sharing with the networks of people they know, and don’t know. As a result, new trends are emerging about the modern, post-covid consumer. 

    1. The number of views of Instagram videos increased by 70% in just one month.

    (Oberlo)

    According to social media use statistics, from February to March 2020, Instagram video views increased by 70% in just that one month. Notably, videos are becoming a prevalent part of social media for viewers, content creators, and advertisers alike. The latest trends show that it pays to make videos on Instagram, with 55% of ad revenue on Instagram videos going to the creator. 

    2. 67% of respondents use email to communicate with brands.

    (Drift, Heinz)

    Social media data analyses point that more and more consumers are using social platforms to communicate directly with brands, and 45% of examinees prefer to use live chat. Users appreciate high responsiveness and helpful tone when communicating with businesses, making social media engagement important to many companies. 

    3. Ad engagement increased by 15% during COVID-19.

    (Marketing Dive)

    As a way to cope with boredom and staying at home many people have turned to their mobile screens since the worldwide lockdown happened. Increased usage has directly correlated to increased ad engagement, with women being the most likely to engage. 

    How Many People Use Social Media

    The number of social media users is steadily rising, and it looks like it’s going to stay that way. Additionally, the average person has a lot more social media accounts than ever before. Cross-platform use and sharing are becoming a normal part of internet life, with Instagram, Facebook, and YouTube ranking in the top three. 

    4. Over 4.14 billion people are actively using social networks.

    (DataReportal) 

    Recent stats on social media show that up to 53% of the global population is currently using social networks, and it continues to increase. 

    Over 450 million people joined social platforms from October 2019 to October 2020, which is a 12.3% growth in the number of new users compared to the previous year. Notably, 2 million people join social media every single day. 

    5. According to social network stats, an average user has 8.6 social media accounts.

    (Backlinko)

    There are various social platforms that range in popularity. From dating apps to Facebook to playing Second Life, people join social media for many different reasons. Over the last seven years, the average number of social media accounts has doubled. Today, India is the world leader, with 10.3 social media accounts per individual. 

    Social Media Marketing Statistics

    With the rise in social media usage, so does the drive to take advantage of this sophisticated marketing tool. With people spending almost 15% of their day on platforms, marketers and businesses are keen to take advantage of the attentive audience. 

    6. 73% of marketers say social media marketing was effective for their business. 

    (Buffer)

    Almost half of the surveyed marketers classified this type of marketing as ‘Somewhat effective’ for their business in recent statistics about social media. That being said, 29.6% of respondents labeled social media for advertising as ‘very effective.’ That means that up to 73% of marketers have found social media marketing benefits for their business, one way or another. 

    Still, it isn’t just about activating your business on social networks. It’s about finding your target group and creating engaging content. One of the growing social media trends is influencer marketing. The study indicates that 49% of consumers rely on influencer recommendations on social media platforms for what to buy.

    7. One in three users is frustrated by unresponsive brands.

    (Smart Insights)

    User engagement is primary for any advertising campaign, and social media is no different. Due to evolving consumer expectations, brand marketers need to be responsive to their followers. 

    Facts about social media indicate that one in three users gets frustrated by websites that are hard to handle or brands that aren’t cooperative and responsive. Other things that users find repulsive are monotonous online forms and lack of service outside of working hours.

    8. Nine out of ten users will support a brand with unique social media content.

    (Stackla)

    Creating compelling and engaging social media content is an ever adaptive skill. Social media stats show that nine out of ten users assert that authenticity is a significant factor when choosing which brand to support. 

    There is a discord between what businesses think is unique and what users engage with, however. More than 90% of brands believe they create truly original content, while 51% of consumers claim that most brands on social media don’t have authentic material. 

    9. 47% of consumers expect brands to take a public stand on social media.

    (Sprout Social)

    One of the biggest social media trends for 2020 is that consumers expect brands to take a public stance on social media regarding important topics. Notably, 55% of them claim they would disregard a brand whose point of view they disagree with, while 53% of them believe that companies take public stands simply to sell more products. Regardless, the modern consumer is becoming increasingly conscientious and expects businesses to be the same. 

    Social Media Usage Statistics

    The pandemic has changed the way we use technology, and smartphones and social media are a major component in that change. The prevalence of social media usage has drastically increased since COVID-19, and as a result, is a much bigger part of people’s lives.

    10. 88.1% of users reported using social media more during the pandemic.

    (Oberlo)

    Only 12% of people reported that they didn’t turn to social media as a way to kill time and stay more connected with family and friends during the coronavirus lockdown measures. Social media addiction statistics indicate, however, that as social distancing and quarantine measures continue to phase in and out, the increase of social media usage may very well become a new normal.

    11. An average user spends 2.5 hours on social media daily.

    (DataReportal)

    Out of 6 hours and 55 minutes spent online every day, an average user spends nearly a third of that time on social media: 2 hours and 29 minutes, to be exact. Social media facts show this now compares with television. People watch TV for 3 hours and 29 minutes each day on average and listen to streaming platforms for 1 hour and 39 minutes, making social media the world’s second favorite activity. 

    12. 72% of USA respondents regularly use Facebook as their primary social media platform.

    (MessengerPeople)

    Even though Facebook might seem outdated to Gen Z, social media statistics worldwide show that most still like this platform. 65% of US citizens use media sharing platforms, such as Instagram, Snapchat, or YouTube. On the other hand, for global messaging applications, WhatsApp comes first, followed by Facebook Messenger. Still, in the USA, Facebook Messenger takes the lead, Snapchat takes second place, and WhatsApp ranks third. 

    13. The use of memes has increased by 26% in just a year.

    (Talkwalker)

    With the increased time spent on social media during lockdown, a popular internet trend also increased. Meme usage increased by 26% from August 2019 to July 2020, peaking during lockdown in April 2020. An interesting fact about social media users and memes is that 55% of social media users aged 13 to 35 use and exchange memes weekly. The ‘meme industry’ is a massive trend that seems to be ever-expansive. 

    14. Nine out of ten respondents use social media to connect with their colleagues.

    (DataReportal)

    Even though millennials are very active on social media, they don’t practice using it for communicating with colleagues. On the other hand, social networking statistics found that people who belong to the so-called Gen Z (born after 1995) are more likely to use social platforms for business purposes. 

    Statistics reveal that nine out of ten respondents younger than 25 use these platforms every week for business communication. Comparatively, 68.7% to 79.2% of people from 25-34 years old (millennials) use social platforms exclusively for socialization and entertainment.

    Social Media Usage Statistics by Country

    Social media is a global phenomenon, and these days, it’s hard to find someone who isn’t on a social platform. The way individuals use social, however, varies depending on the country. From the amount of time spent daily to how many citizens have an account, social media is influenced by where you live. 

    15. China is the biggest social media market in the world.

    (Statista)

    China accounted for almost a billion of the world’s social media users in 2020, and India is a far-off second with 350 million users. The United States is the country with the third most social media users, stats indicate, with 223 million reported in 2020. 

    16. 99% of people in the UAE use social media.

    (Statista)

    Even though China counts as the biggest social media market, the UAE leads for the number of citizens who have an account. Only 1% of the UAE population isn’t using social media. On the contrary, countries with the lowest number of users are Nigeria and Kenya, and the correlation between a country’s economic status and the percentage of social media users has been established. 

    17. Facebook is the leading social network in 90% of the world’s countries.

    (Vincos) 

    Facebook was a major innovator in developing the way we think of and use social media, and as such, it still dominates the globe for the number of active users. Apart from Russia, which uses a platform called VKontakte, and China that uses a platform called QZone, Facebook is number one in the world, with 60.6% of all internet users using the platform and more than 2.7 billion active users. 

    Negative Social Media Statistics

    Especially during unprecedented times, there have been many benefits to social media. As one of the only ways to stay connected to friends and family during quarantine, many report the benefits of these platforms have had on their lives. There is a dark side to social media, however, as many people also report feeling addicted to using it. 

    18. Over 210 million people across the globe suffer from social media addiction. 

    (Mediakix)

    Social media use stats reveal that young and single females are the most likely to be addicted to social media. The link between depression and mobile use is accentuated by this, with females reporting depressive symptoms 58% more than males. 

    Anxiety and sleep deprivation are additional indicators of social media addiction. Notably, sleeping disorders are more common in teens, with 10% reporting that they check their phone more than ten times a night. 

    Recent social media user stats show that 71% of people sleep with their phone or have it close to them, and with 45% of users checking their social media during the night instead of sleeping, sleep disturbance due to social media use is becoming an increasingly serious issue.

    19. One-third of divorces are caused by social media use. 

    (McKinleyIrvin)

    There are several reasons why social media has appeared as a major reason some people choose to get divorced. Besides the negative impacts of any addiction, such as anti-social behavior, neglecting loved ones, and general life dissatisfaction, social media addiction facts show additional adverse effects.

    Notably, someone’s social media has become quite a private affair, with one-third of married people keeping their password from their partner. 30% of Tinder users are currently married, and 25% of married couples say they fight about something they saw their partner do on social media at least twice a week. 

    20. Addicted teens can spend up to nine hours on social platforms daily.

    (MentalUP)

    Social media usage statistics by age show that many teens spend more than a regular daily working shift on social networks. This concern can be concerning considering reports that state spending five or more hours on social media a day can lead to depression. Teens using social media are also more likely to experience cyberbullying and harassment, and 67% of teens claim they know how to hide specific content from their parents. 

    Conclusion

    With the rise of a new decade and a new normal, social media is becoming one of the most used social technologies in the world. Social media statistics show that from sharing pictures of food to creating influencer videos and promoting brand awareness, people are spending more time than ever on this internet activity. 

    With all the benefits of social media, so too are there pitfalls. Many people report feeling addicted to it, and others experience mental health issues such as anxiety, depression, and body image issues as a consequence of it. Either way, new platforms arrive every day, creating new social media trends that change the way we think, talk, and interact with one another. 

    People Also Ask

    What is the percentage of social media users in the world?

    As of last year, 49% of the global population uses social media, and there are over 4.14 billion users worldwide. Not only that, but 88.1% of users have reported using these platforms even more during the COVID-19 pandemic.

    What is the most popular social media platform in 2020?

    Facebook is the most popular social media in 2020 worldwide, excluding such as Russia and China. An incredible 2.45 million users are currently on the network, making up 60.6% of all internet users. The second most favored social network in the world is YouTube, while WhatsApp comes as the third.

    How many social media accounts does the average person have?

    The average person has 8.6 social media accounts. Still, research results can slightly differ from one country to another. For example, an average social platform user from India has 10.3 accounts, and in the last seven years, the number of accounts per person has doubled and continues to rise.

    Does social media cause more harm than good?

    There is no straight answer. Like any other activity, too much of anything can be a bad thing. Social media has proved to be a very useful tool for maintaining social ties, especially in modern circumstances where social distancing is enforced.
    Studies show, however, that it can have a negative mental health impact, especially on youth, and that these negative outcomes are correlated with how much someone uses the platform. Like many other things, social media can be addictive, and it’s important to remain aware of how and why something gets used.

    Is social media good or bad for students?

    Social networks can become of great use for students if used properly. In particular, Generation Z is the most likely generation to use social media for not only socializing but business activities as well.
    Negatively, there are many youth studies that report negative impacts on young people using this technology. From cyberbullying and harassment to poor social skills to depression and anxiety, social media statistics show that students should use social media in moderation to avoid the likelihood of experiencing negative side effects.

  • 14 Alarming Mail Theft Statistics to Increase Awareness

    14 Alarming Mail Theft Statistics to Increase Awareness

    Ordering a package from Amazon or any other online store has become a daily occurrence. These mail theft statistics give insight into where lost mail really goes and how you can prevent it from happening to you.

    People shop for everything and anything online these days. From gifts to appliances and even the weekly grocery list, many people are ordering and can’t wait for their packages to arrive. 

    Once the mailbox remains empty and the awaited package never arrives, two things could have happened: it was lost, or it was stolen. The chances are that the package will never be found.

    The Most Crucial Mail Theft Statistics (Editor’s Choice)

    • Between 2017 and 2020, mail theft increased by 600%
    • Upon delivery, around 23 million people have had their package stolen
    • In the United States, about 1.7 million packages are stolen every day
    • Almost 50% of people reported a stolen parcel to the police 
    • The number of Americans who had their package stolen rose to 43% in 2020
    • In 2020, over 60% of people stayed at home to wait for a parcel
    • Approximately 70% of people won’t use Amazon Key
    • Since mail theft is a felony, the punishment is a fine or prison time of up to five years

    USPS Lost Mail Statistics: Some Packages Get Lost, Others Get Stolen

    Among the billions of packages shipped by Americans every year, it is hard to determine which ones are lost, which are stolen by the United States Postal Service (USPS) employees, and which ones are taken from the porches upon delivery. 

    1. It’s estimated that 3% of all mail is lost by the US postal service. 

    (Natpay)

    There is no definitive answer to the question of how much mail is lost each year. While some estimates report 3%, it’s difficult to know for sure as the post office doesn’t measure its delivery performance and never has. 

    One way of measuring lost mail is by tallying reports of missing packages. While this identifies how many have been lost, it doesn’t indicate whether the package was lost or stolen. 

    2. About 23 million people have their package stolen upon delivery.

    (Parcelpending)

    According to package theft statistics, almost 23 million Americans who ordered stuff online were victims of porch pirates in 2019. Notably, 74% of those packages were stolen while the homeowners were at work. 

    3. Mail theft reports increased by 600% 2017–2020.

    (NBCnews)

     The Postal Inspection Service shared the data that shows an enormous increase in mail theft reports. By August 2020, there were roughly 177,000 reports, indicating a 600% increase in stolen mail over the last three years. 

    4. There were 1,472 internal investigations related to mail theft by postal employees October 2020–September 2021.

    (USPSOIG)

    While many cases of theft occur from an outsider grabbing a package off a doorset, of the 1,472 internal investigations with the USPS, 453 resulted in arrests, and 1,042 administrative actions were taken

    The USPS is responsible for any internal complaints about postal workers or mail sorters, while the police are responsible for porch pirates and thieves outside of the postal jurisdiction.

    5. Mail theft statistics from 2019 show the number of Americans who had their package stolen rose from 36% to 43% in 2020. 

    (Crresearch)

    With the arrival of the pandemic, staying at home and ordering online became a norm, resulting in an increase of parcels and also mail theft. The latest data shows that the number of victims rose from 36% in 2019 to 43% in 2020.

    6. Approximately 1.7 million packages are stolen daily in the US.

    (Sourcetoday)

    With the increase in online shopping, package theft numbers are rising. Even though USPS lost mail statistics show that lost mail can’t be counted, it’s estimated that 1.7 million packages are stolen per day in the US. That’s around $20 to $30 billion lost every year. 

    7. 47% of people filed a police report about a stolen parcel. 

    (Crresearch)

    Nearly half of people will file a police report if they notice or think their package has been stolen, and with good cause. The average value of an ordered package is $136, and luckily many companies provide refunds for stolen goods.

    How To Report Mail Theft

    Mail is defined as any letter, postcard, package, box, or bag. Mail theft can happen in private or collection mailboxes, mail trucks, or postal workers. With billions of packages moving around each year, chances are some packages will be stolen. There are some things that you can do to possibly locate your mail, however, starting with a mail theft report.

    8. Mail theft is a felony, and the punishment is a fine or prison time of up to five years. 

    (Criminal.findlaw)

    Even though it seems like a minor thing, mail theft is a federal crime. It is defined as taking any package, card, or other posted item that doesn’t belong to you. This felony is punishable by a fine or prison time of up to five years. The mail theft punishment for postal employees who steal is also up to five years in prison, based on the 18 US Code, Section 1709.

    9. A total of 32% of consumers feel like companies could do more.

    (Crresearch)

    Both consumers and companies are working on preventing mail theft. For example, FedEx, Amazon, and UPS require signatures or lock boxes to try and ensure the proper recipient is reached. It may not be enough, however, as 32% of customers still think companies can do more to prevent theft from happening. 

    Mailbox Theft Prevention

    While there’s no chance of knowing and preventing mail theft in the primary steps of shipping, there are ways to keep it in place once it reaches the doorstep. Staying at home, limiting what you purchase online, and installing video surveillance systems are all prevention techniques used by regular internet shoppers.

    10. Around 42% of people avoid ordering expensive items online to prevent mail identity theft.

    (Crresearch)

    Mail theft became an even bigger issue during the peak of the holiday season in the last couple of years. So much so that 47% of people who order online claimed they worry about theft, and 42% said they stopped ordering expensive items online to prevent losing money.

    11. A total of 64% of people stayed at home to wait for a parcel in 2020.

    (Crresearch)

    A major theft prevention technique, especially for mailbox theft, is to be at home and wait for the package to arrive. Notably, 64% of people say that they do this when they are expecting a package, while 24% report that they do in-store pickup. 11% of people sent their packages to friends or relatives to ensure safe arrival. 

    12. About 50% of people also have some sort of doorbell camera to prevent mail theft.

    (Crresearch)

    Package theft statistics show that there are several techniques that have shown to reduce theft, not just on your doorstep, and video surveillance is one of them. Porch pirates are aware of the different ways that people try to protect their mail, but still, 50% of homeowners have a doorbell camera, as well as motion lights and alarm systems. 

    13. The number of individual mailboxes, P.O. boxes, and alternative delivery points grow by one million every year.

    (Pewresearch)

    One way to not become a USPS lost mail statistic is to rent a private mailbox. One million people choose this option every year in order to limit the potential for doorstep piracy and keeps potential thieves away from your home.

    14. About 70% of people still won’t use the Amazon Key.

    (Retaildive)

    The Amazon Key system is a way to avoid mail theft by allowing Amazon delivery workers access to your home in order to drop off a package. Despite many security systems in place like mobile alerts and video surveillance, nearly three-quarters of people say they don’t feel good about using it.

    Conclusion

    These mail theft statistics show that it’s not just about losing the cool thing you ordered online. The consequences of mail theft can be severe, even resulting in identity theft and other related scams

    Find out how to deter identity theft.

    There are precautions to take against porch pirates, however, but not from USPS employees. Postal Service Inspectors are doing all they can to prevent and punish those who steal from valued customers. Together with the proper prevention and police tools, the rising number of mail theft might drop in the future.

    People Also Ask

    What percent of US mail is lost?

    It’s difficult to accurately report the amount of US mail that gets lost because USPS doesn’t monitor delivery rates and never has. According to mail theft reports, however, it’s estimated that 3% of parcels are lost in the mail.

    What happens if someone steals your mail?

    Mail theft is defined as a federal crime in 18 US Code, Section 1708 for individuals, and Section 1709, for Post Office employees. In both cases, the punishment is a fine and up to five years in prison. If you notice that someone stole your mail, notify the Postal Inspector, the nearest police station, and talk with your neighbors to get information on the possible culprit.

    How many packages are stolen each year?

    11 million US residents were victims of mail theft in 2019, but not all of them filed an official report. Despite that, the Postal Inspection Service has recently published information that shows an increase of 600% in mail theft reports. By August 2020, there were roughly 177,000 reports of lost or stolen mail.

    Why do people steal mail?

    There are many reasons people steal mail, and mail can be stolen at each delivery step. For example, some organized crime groups steal mail trucks, while the employees find it hard not to take a look at what’s in the box. Porch pirates might steal it because they believe it’s valuable or if they know it contains sensitive information that they can use for other crimes.

    Who investigates mail theft?

    When someone steals the mail, it’s of utmost importance to file a report to the United States Postal Inspection Service. This is the first step to take, as it’s the body that investigates mail theft.
    Since mail theft is a felony, the local police station should also get involved, especially if the video doorbell recorded any video or image of the perpetrator.
    Unfortunately, even though delivery companies also have high numbers in mail theft statistics, they don’t claim any responsibility in helping the customers find the packages.

  • 20+ Essential Housing Statistics

    20+ Essential Housing Statistics

    If you are considering renting a new place or investing in a property — we can help. The housing statistics we compiled have all the information on the market you need before making up your mind.

    Besides all the uncertainty the pandemic brought into our lives, it also gave us some new perspectives on life. As people began spending more time in their houses, working, or simply socially distancing, many of them found the motivation to start looking for their dream home.

    So, if you are one of them, this article will provide you with valuable insight into the housing market.

    Advantageous Housing Trends (Editor’s Picks)

    • The homeownership rate in 2020 was over 65%
    • There is a 9% increase in new listings compared to the previous year
    • In 2021, houses sell 32 days faster than before
    • The average search for a new home takes around eight weeks
    • Real estate agents are responsible for 88% of the house sales
    • Current housing market trends show that the average monthly rent is $1124
    • Millennials/ Gen Y make up 38% of all homebuyers in the US
    • Only 6% of graduate students live on-campus

    Basic Housing Market Data & Trends

    This section will provide you with info that you’re probably curious about — what percentage of people own a home, if house prices are rising or declining, and how many new listings there are, compared to previous years. 

    You’ll also find much-needed housing data about the process of selling or buying — such as the average time a house spends on the market or how long a house search lasts.

    1. The homeownership rate in 2020 was 65.8%.

    (Statista)

    Data for 2020 shows an increase in the homeownership rate by 0.7%. The highest rate ever recorded was in 2004 — right before the recession —over 69%.

    2. Home prices rose higher than rents in 83% of the US counties by the end of 2020.

    (Kiplinger)

    In most states, the rate of home prices increased more than the wages. Nonetheless, housing market stats reveal that in 63% of the counties, people still believe it’s a better investment to buy a house than to rent.

    3. New listings in 2021 are up by 9%.

    (Norada)

    Besides more buyers, the increased number of sellers is another housing trend of 2021. With spring being among the most popular times to put a house on the market, the number might get even higher.

    4. Houses are spending 32 days less on the market in 2021.

    (Norada)

    According to experts, people want to make the most out of the low mortgage rates before the market bounces back, so the sales happen faster and more often.

    5. The typical house search takes around eight weeks.

    (NAR)

    According to the NAR national housing statistics, buyers consider approximately nine places before they find the one that’s perfect for them. Generally, five out of those nine houses are looked at only online. 

    6. 15% of home sellers in the US relocate to be closer to their families.

    (NAR)

    The most common reason for selling a house is to be closer to family and friends. Real estate trends show that 12% of the sales are due to a change in the family situation. In addition, 14% of the people want a new house because of the small size of their current one. The safety of the neighborhood is also a common concern. 

    7. 1.3 million housing units currently belong to public housing.

    (Office for Policy Development and Research)

    Around 48% of the public housing are either small studios or one-bedroom apartments, and nearly 25% — two-bedroom homes, while 28% — have three or more bedrooms.

    Home Sales Data by Zip Code

    Have you ever wondered how different the housing prices are in various parts of the country? We have gathered some interesting stats on the most expensive and cheapest states to buy a house in. 

    Let’s take a look at the most surprising affordability indexes in the country.

    8. West Virginia is the cheapest place to buy a house, with a median price of $113,000.

    (Roofstock)

    Besides West Virginia, the cheapest houses in the US are in Mississippi, Oklahoma, and Arkansas — with a median value of around $140,000 and less.

    9. New York City has the worst affordability index in the US.

    (Kiplinger)

    The affordability index is calculated by comparing the average annual income in a city with the median home prices. Real estate statistics by city reveal that the most affordable place is Augusta, Georgia.

    10. One of the most expensive houses in the US costs $135,000,000.

    (Christie’s)

    The house is located in Woodside, CA, and is part of a 74-acre property, perfectly preserved since it was built in 1911. The property has 32 bedrooms, a tennis court, pools, and hiking trails, among the long list of amenities.

    Housing Trends About Real Estate Agents

    Undoubtedly, real estate agents are a vital part of any housing transaction. So, this section will reveal the popularity of real estate agents and websites, and the unexpected means of communication the agents use to reach clients. 

    11. 88% of the people buy a house through a real estate agent.

    (NAR)

    Housing market statistics 2021 show that the majority of home buyers use the help of a real estate agent. Surprisingly, around 73% of the buyers hired the first agent they contacted, and 91% say they would work with the same agent again. 

    12. 90% of real estate agents communicate with their clients via texts.

    (NAR)

    Real estate statistics reveal that many agents have adapted to the new communication ways. Emails are even more popular than texts — 94% of agents use this way of reaching out to the clients — and 34% use instant messaging. 

    13. The real estate website Zillow has 36 million visitors every month.

    (Statista)

    According to real estate stats, websites are the most accessible information source for house buyers. Besides Zillow, another popular site is Trulia, with around 23 million unique monthly visitors. The third most popular option is Yahoo! Homes, with an average of 20 million people browsing through the offers.

    Housing Statistics on Rents

    Renting is also an enormous part of the housing market. These stats will show you more about the average monthly prices and the demographics of renters in the US.

    14. The average monthly rent in the US is $1124.

    (Statista)

    Housing price trends exhibit a constant increase in rent costs since the beginning of 2021. The price varies depending on the state, and research shows that the rent prices are much higher than the minimum wage.

    15. The average rent for a studio is around $900.

    (Statista)

    Housing market trends by zip code show that rents vary depending on the state and the city. Approximately renters spend around $960 for a one-bedroom apartment, $1200 for a three-bedroom, and $1500 for a four-bedroom apartment.

    16. 49% of renters in the US are under 30 years old.

    (Statista)

    It is not surprising that the majority of renters are under 30 years old. According to the latest housing market statistics on rents, only 9% of people over 65 years old are currently renting a place.

    Millennial Housing Trends

    Millennials make up a significant part of the homeowners. Let’s take a look into their housing choices and preferences.

    17. Millennials make up around 60% of all first-time buyers.

    (Dotloop)

    The latest research shows that millennials take on an active role when searching for a house — choosing properties to visit and tracking real estate price trends. They also prove to be pickier with their choice of real estate agents and do thorough online research before committing.

    18. Millennial/Gen Y buyers make up 38% of all homebuyers in the US.

    (Investopedia)

    NAR reports that technology plays a significant role in their home buying process — almost every millennial goes online to find information about the housing market before they begin looking for a house.

    19. 47% of Millennials prefer to live in the suburbs.

    (Investopedia)

    Housing market trends of millenials’ purchases show that nearly half the people in their 20s and 30s choose to live out of town. Research has also indicated that most of the buyers that age prefer to have a bigger house. In fact, around 45% of homeowners in their 30s pay over $300,000 for their new property.

    Student Housing Trends

    This February, 10% fewer students enrolled in college and were looking for university housing. Nonetheless, it seems the student housing problem is not nearly resolved.

    20. Around eight million students need near-campus housing every year.

    (Guide2Research)

    Housing statistics confirm that student housing is constantly in demand, and that presents a great investment opportunity. Currently, the data shows that student housing in the West and South regions of the country will be in high demand this year.

    According to the latest California real estate numbers, this comes as no surprise.

    21. 90% of students place Wi-Fi first among practical amenities.

    (Guide2Research)

    As most of them don’t have a significant income, students generally look for the cheapest houses in the US. However, the must-have functional amenities are the laundry machine for 78% of the students and a designated study area — for 45%.

    22. Only 6% of graduate students live on-campus, show housing statistics.

    (Guide2Research)

    It is safe to say that graduates are the target group for any investor looking to build near campus due to students’ transportation and access to campus resources issues. However, there is much for entrepreneurs to consider like safety regulations and affordable prices.

    Housing Trends – The Bottom Line

    Our statistics presented you with insight into today’s housing market in terms of buyer demographics, rent prices, and student housing and, hopefully, helped you get a better overview of the favorable house-buying situation.

    Are you ready to make such a change in your lives? If you do, 2021 will be a perfect time for that. Don’t forget to take a look at the housing statistics by zip code to make sure buying a house is a good investment for your area. 

    People Also Ask

    How many houses were sold in 2020?

    Approximately 5.6 million homes were sold in 2020 in the US. Experts predict a significant rise in 2021, with almost 6.5 million existing houses already being sold. In recent years, 2010 was the year with the lowest number of houses sold — 4.2 million, while in 2005, US buyers purchased over 7 million homes.

    Are housing prices declining?

    On the contrary, in March of 2021, the median house prices hit an all-time high — $370.000 — over 15% more than last year. However, experts expect that the prices will soon stop rising.

    Is 2022 a good year to buy a house?

    The COVID-19 pandemic caused high levels of unemployment, and the economy is too unpredictable for risky investments. However, mortgage rates are close to the record lows, which is something buyers should utilize, as well as the new working flexibility from home gives many people more location options.

    Is the housing market going to crash in 2022?

    Google reports an increase of 2450% in searches on whether the housing market will crash in 2022. Home sales data shows that the situation is very different from the 2008 crisis and is more likely to stabilize instead of crash.

    What percentage of homes are over $1 million?

    Around 3.6% of the total number of homes in the US is worth more than $1 million — adding up to over 3 million houses. It comes as no surprise that a large number of these homes are in cities in California, as it is the biggest state.

    Will apartment rent go down in 2022?

    Housing statistics indicate that rent prices are more likely to remain stagnant than to decrease. Experts expect that renters in the key markets, such as Atlanta, Phoenix, and Denver, might even have to spend a little extra on their rents.

  • Safest Cities in Tennessee

    Safest Cities in Tennessee

    The State of Tennessee lies in the Southeastern region of the United States. It’s a peaceful country that’s perfect for all those that like music and mountain activities. If you want to be one of the 6.9 million residents there, check out our rankings of the safest cities in Tennessee to get informed about where and where not to go. 

    About Tennessee

    With a total population of 6.9 million, Tennessee is the 15th most populated state in the United States. It got its name from the Native American word “Tana-see,” which means “the meeting place,” and is full of rich history and cultural charm. Tennessee borders eight states: Kentucky, Virginia, North Carolina, Georgia, Alabama, Mississippi, Arkansas, and Missouri.

    What is Tennessee Known For?

    The state’s nickname is “The Volunteer State,” due to a large number of volunteer soldiers during the War of 1812. At that time the state sent out more people to the Confederate Army than any other state.

    Tennessee is home to Nashville, the most famous country music location in the world. People from all over travel to witness stars in action or try their hand at becoming the next Dolly Parton, Garth Brooks, or Taylor Swift. 

    Tennesseans use around 80% of the state land for agricultural purposes. This state has more tree species than any other state in America.

    Is Tennessee Safe?

    Tennessee has one of the highest crime rates. Its crime rate is 3,248 per 100,000 residents, and the occurrence of violent crime ranks third in the entire country.

    Notably, Tennesseans report that they feel safe in Tennessee. This is likely due to the concentration of crime in certain big city areas that drive the rate up. 

    Earnings in Tennessee

    The median household income in Tennessee is $53,320, and the per capita earnings amount to $29,859. Nearly 14% of Tennesseans live in poverty.

    Safest Cities in Tennessee for 2021

    Waterfall in Tennessee

    1. Church Hill

    Church Hill belongs to Hawkins County of Tennessee. It’s part of the Kingsport-Bristol Metro Area and the “Tri-Cities” region, and it currently has 6,664 residents.

    Church Hill was first established as a trading post. It encompassed two stagecoach stops called Patterson Mill and Spencer Mil, and after a Methodist church opened in the area, the town received the name Church Hill. It was officially incorporated as a city in 1958.

    As one of the most attractive small towns in Tennessee, it has other popular sites, such as the Carter’s Store and Smith Place.

    Church Hill is also one of the safest towns in the state. Its crime rate is 150 per 100,000 residents, and in 2019, the police reported ten property and zero violent crimes.

    Residents of Church Hill earn below the state average, with a median household income of $46,024 and per capita earnings of $25,398. Over 15% of people live in poverty, properties are relatively cheap, with the median gross rent at only $593, and the median house price sits at $160,400.

    2. Mount Carmel

    In the top 10 best places to live in Tennessee by crime rate is Mount Camel. Mount Carmel is part of the “Tri-Cities region” that includes Bristol, Kingsport, and Johnson City. Its population consists of 5,294 people.

    Even though it’s famous for its level of safety, Mount Carmel has been facing economic hardship since the 1980s. The poor leadership and the outsourcing of municipal and retail services to Kingsport and Church Hill, neighboring communities, made it hard for Mount Carmel to surpass its problems. 

    Despite these issues, the residents of Mount Carmel have earnings that are pretty similar to the ones in other Tennessee cities, with a per capita income of $29,769 and a median household income of $53,253. Almost 13% of people live in poverty, and rent is cheaper than in most other towns in Tennessee, with the median gross rent of $682 and the median home price is $163,800.

    Mount Camel has an extremely low crime rate of 586 per 100,000 residents, and in 2019, law enforcement reported 29 property and only two violent crimes.

    3. Brentwood

    Brentwood is part of Williamson County in Tennessee. It’s among the best suburbs of Nashville for families and currently has 42,783 residents.

    When settlers first came to the state, they were drawn to Brentwood for its rich land. In 1810, John Frost came to the area and purchased the Mayfield Station. His home became the center for all business activities in that part of the state. Not long after, residents built a post office, general store, and grist mill. More and more residents came to Brentwood, establishing small farms and bigger plantations.

    Today, Brentwood is one of the best places to live in Tennessee. It is a city with a low crime rate and high salaries. The median household income in Brentwood sits at $168,688, which is way above the state average, and the per capita earnings amount to $72,854. Only 2.5% of residents live in poverty.

    In case you’re interested in living in this city, you should be prepared to pay more than what you would in other similar towns. The median gross rent in Brentwood is $2,085, while the median house cost sits at $894,600.

    Brentwood is among the safest places in Tennessee, with a crime rate of 953 offenses per 100,000 people, and in 2019, residents reported 374 property and 38 violent crimes.

    4. Loudon

    Loudon is the county seat of Loudoun County, and it’s part of the Knoxville Metro Area, which lies on the Tennessee River. According to the latest official data, Loudon has 5,890 residents.

    The residents of Loudon have moderate salaries that are close to the state average, and the per capita earnings amount to $24,125, with a median household income of $41,860. Around 13% of people from the area live in poverty.

    Loudon is one of the safest cities in Tennessee, with a crime rate of only 971 per 100,000 residents. In 2019, the police filed reports for a total of five violent crimes and 52 property offenses.

    Those interested in renting in Loudon will pay below the state average, as the median gross rent sits at $743, and the median house price in the city is $323,500.

    Even though it’s among the smaller towns in Tennessee, Loudon is a pretty exciting place to visit. Downtown Loudon, for instance, is a great place to start your tour. It’s full of interesting shops and great restaurants you can explore. Those who want to learn more about the town’s history should go to the Sequoyah Birthplace Museum. There, you will learn more about the life of Sequoyah, who was a statesman, silversmith, and the creator of the Cherokee writing system.

    5. Spring Hill

    Spring Hill belongs to Williamson and Maury Counties. It’s around 30 miles away from Nashville, making it part of the Nashville Metro Area. Those wondering where is the best place to live in Tennessee should look into Spring Hill as it’s one of the fastest-growing cities in the state. Its population is constantly changing, but, according to the latest estimates, the town has 43,769 residents.

    Spring Hill was established as a city in 1809. History fans will recognize the name of this town as one of the battles during the Civil War. The Battle of Spring Hill happened in November of 1864. After the war, Branham and Hughes Military Academy was built in the area, which attracted more residents. 

    Spring Hill is among the most popular cities in Tennessee, so much so that its Board of Mayor and Aldermen came up with the “Spring Hill Rising: 2040” plan. This plan’s purpose is to reorganize the city to accommodate its growing population.

    The median household income in Spring Hill is $90,778, which is way above the state average, and per capita earnings sit at $32,770. Only 2.8% of residents live in poverty. Spring Hill may be one of the best places to visit and live in Tennessee. Higher wages come with pricier properties, though, and the median house price is $383,100, and the median gross rent sits at $1,401.

    Another reason why this town is so appealing is its low crime rate of 1,002 per 100,000 people. In 2019, residents reported 381 property and 53 violent offenses.

    6. Nolensville

    Nolensville belongs to Williamson County, and it’s located in Middle Tennessee. If you’re researching what is the best small town to live in, Tennessee, you should look into Nolensville. It’s a beautiful, small community with only 10,062 residents.

    Nolensville became a popular place of relocation after the American Revolutionary War. William Nolen, its first known resident, accidentally reached the town when his wagon wheel broke. After noticing the rich soil and lots of natural resources, he decided to build a home there. 

    One of the main reasons to move to Nolensville is the median household income, which sits at $134,740. The per capita earnings are above the state average, at $43,070, and only 1.4% of people live in poverty.

    Nolensville is among the safest places in Tennessee. Its crime rate is 1,159 per 100,000 residents, and in 2019, the police filed reports for 94 property crimes and 16 violent offenses.

    If you liked what you read and you want to move to Nolensville, you should know that the median house price there is $562,300, and the median gross rent sits at $2,263.

    7. Franklin

    Franklin is the county seat of Williamson County. It’s among the principal cities of the Nashville Metro Area. According to the latest data available, the city has 83,097 residents.

    If you’ve been typing “Where is the best place to retire in Tennessee?” trying to find a lovely, safe town to grow old in, you might have found it. Franklin is full of beautiful parks that will be great for walking, biking, and playing. Furthermore, it offers lots of fun activities, and it has a historic feel. The city’s government is working hard to protect the town’s older buildings, and there are five historic districts to enjoy.

    Franklin harbours a low crime rate of 1,274 per 100,000 people, making it one of the safest cities near Nashville, TN. In 2019, residents reported 926 property and 138 violent offenses.

    Franklin is also a city with high earnings. The median household income amounts to $98,231, while per capita earnings sit at $48,318. Approximately 6.6% of residents live in poverty, which is way below the state average, but this security comes at a cost as the median house cost is $625,400, and the median gross rent amounts to $1,481.

    8. Hendersonville

    With a population of 58,113, Hendersonville is the most populous city in Sumner County, and it’s also the fourth-largest city in the Nashville Metro Area. Those interested in living in Tennessee should not forget to do some research on Hendersonville, as it offers high salaries, safe living, and exciting activities.

    The city is named after one of the first known settlers of Hendersonville, William Henderson. His house was later used as a field hospital during the Civil War and can be visited to this day, as it’s listed on the National Register of Historic Places. After the Old Hickory Dam was completed in 1954, more and more residents came to the area, making it the fastest-growing city in Tennessee.

    The crime rate in Hendersonville is 1,288 per 100,000 residents, making it one of the safest cities in Tennessee. Data from 2019 shows that there were 652 property and 100 violent crimes in the city.

    Residents of Hendersonville earn above the state average, with a per capita income of $38,779, and a median household income in the city is $72,539. Only 6% of residents live in poverty, and the median house price is $367,200, with a median gross rent of $1,173.

    9. Germantown

    Germantown belongs to Shelby County, and it borders Memphis. The city’s beautiful greenery granted it the “Tree City USA” title for 23 years in a row, and currently, the Germantown, Tennessee population sits at 39,225.

    The first settlers arrived in this area in 1825, and a few years later, the land was named Pea Ridge. After surveyor N.T. German took the initiative to lay out the lots and organize the town, the name was switched to Germantown in 1836. Coincidentally, many German families chose this area as their next place of residence, and the community built churches, founded garden clubs and civic organizations. 

    This city is one of the best places to live in Tennessee when it comes to earnings. The median household income is over two times higher than the state average at $118,163, and per capita, earnings sit at $60,956. Only 2.5% of residents live in poverty, and the median house price is $418,200, while the median gross rent amounts to $1,387.

    Germantown’s crime rate is 1,350 per 100,000 people, and in 2019, the police reported 36 violent and 492 property crimes.

    10. Kingston

    Kingston is a city in Tennessee that’s also the county seat of Roane County. It’s part of the Harriman Micro Area and is one of the best small towns in Tennessee for crime rates, and it only has 5,994 residents.

    Kingston is the second oldest city in Tennessee, and in 1807, it was actually the state capital for one day. Those interested in getting to know the history of this town and Tennessee, in general, can visit the Roane County Museum of History and Art. 

    The crime rate in Kingston is only 1,360 per 100,000 residents, which means this city is among the safer places in Tennessee. In 2019, law enforcement reported a total of 72 property offenses and seven violent crimes.

    Earnings of Kingston residents are pretty close to the state average. The per capita income in the city is $28,856, and median household earnings sit at $57,390. Nearly 9% of residents live in poverty, which is below the Tennessee average. If you’re a fan of smaller towns with a rich history, you should definitely consider moving to Kingston. A house there will cost you around $217,400, while the median gross rent is $728.

    The Best Cities to Live in Tennessee: Most Popular Cities Ranked by Crime Rate

    Safest Cities in Tennessee - Nashvile

    11. Collierville

    Collierville belongs to Shelby County and is part of the Memphis Metro Area. It’s among the larger towns in the state, with a population of 51,040. The town got its name in honor of Jesse R. Collier, an entrepreneur who first purchased the land. The town was burned to the ground in the Civil War, and was restored in 1870.

    Collierville’s historic town was named “The Best Main Street” in the United States in 2014, and the town was put on several publication lists of the best places to retire in Tennessee. 

    The quality of life in Collierville is high. The median household income is $113,996, and the per capita earnings amount to $49,951. Nearly 4% of residents live in poverty, which is over three times lower than the state average. Living in this town is expensive, however, as the median house cost in Collierville is $423,500, and the median gross rent sits at $1,331.

    Collierville has a crime rate of 1,574 per 100,000 residents, and in 2019, the police reported 688 property and 119 violent offenses.

    12. Bartlett

    Bartlett is part of Shelby County and is one of the biggest cities in Tennessee, with a population of 59,440 people.

    Bartlett used to be known under the name of Union Depot because it was the last major depot in the state. Later, when the Memphis and Ohio Railroad came to the area, the depot served as a railway station. At its foundation, Bartlett had about a hundred residents, but the community steadily grew after the Civil War, which led to the birth of various economic activities.

    This city is pretty safe and its crime rate is only 2,070 per 100,000 residents. That means you won’t be needing expensive Tennessee home security systems in order to keep your belongings safe. In 2019, residents reported 1,046 property and 188 violent crimes.

    Residents of Bartlett enjoy a moderate quality of life. The median household income sits at $84,688, and the per capita earnings are $35,631, which is below the state average. The percentage of residents that live in poverty is low at 6%, and the property values are high. The median house price is $276,600, and the median gross rent is $1,383.

    13. Murfreesboro

    Murfreesboro is the county seat of Rutherford County. It’s located in Middle Tennessee and is part of the Nashville Metro Area. Currently, Murfreesboro, TN population is 146,900, and students make up a large proportion of the population as it’s the home of Middle Tennessee State University.

    Murfreesboro received its name to honor the Revolutionary War hero Hardy Murfree. The original name was “Murfreesborough.” This city served as the capital of Tennessee from 1818 to 1826, but after eight years, the government decided to make Nashville the capital of the state.

    The median household income is $62,003, and the per capita earnings sit at $30,629. Almost 15% of residents live in poverty, which is higher than the number of people in poverty in the whole state. The population of Murfreesboro, TN, pays higher rent than most other Tennesseans, with a median gross rent of $1,052 and a median house price of $311,400.

    The crime rate in Murfreesboro is slightly above the Tennessee average, at 3,316 offenses per 100,000 residents. In 2019, law enforcement reported a total of 611 violent offenses and 4,228 property crimes.

    14. Clarksville

    Clarksville is the fifth-largest city in Tennessee, and it’s the county seat of Montgomery County. It’s the principal municipality of the Clarksville Metro Area and is also the home of Austin Peay State University. According to the latest estimates, the Clarksville, TN population consists of 158,146 people.

    Clarksville was founded in 1785. It gained its name after General George Rogers Clark, who was a Revolutionary War Hero. The city’s official incorporation came in 1807, and in the 1980s, Clarksville experienced a significant increase in population. 

    The crime rate in Clarksville is pretty close to the state average, sitting at 3,371 per 100,000 residents, and in 2019, the police reported 926 violent and 4,467 property offenses.

    Clarksville is among the cheapest places to retire in Tennessee. The median gross rent is $961, and the median home price in the town is $231,200. The earnings of Clarksville residents are pretty close to the state average, with a median household income of $53,604 and a per capita earnings of $25,239. Around 14% of residents live in poverty.

    15. Johnson City

    Johnson City is spread over three counties: Washington County, Carter County, and Sullivan County. The majority of the city belongs to Washington County and constitutes the Johnson City Metropolitan Area. The Johnson City, TN population, is currently 66,906 residents.

    The historical data tells us that Henry Johnson founded the city in 1856, at first naming it “Johnson’s Depot.” Because of its location, the town quickly became a vital railway hub for the Southeast, as three railway lines passed through the downtown area. 

    In the 1920s, Johnson City received the nickname “Little Chicago” due to its ties to Capone’s alcohol smuggling. Another interesting fact about the city was that it honored the “privilege tax” for many years. This tax limited the presence of traveling circuses and similar entertainment businesses.

    Those that have been wondering, “what city in Tennessee has the lowest cost of living?” might have come across Johnson City. The town is famous for its low cost of living, and notably, the median house cost in Johnson City sits at $193,400, and the median gross rent is below the state average, at $755. 

    Despite being on the cheaper side, Johnson City has a high percentage of people living in poverty at 21%. The median household income amounts to $41,682, and the per capita earnings of residents are $30,939.

    The crime rate in Johnson City is 3,982 per 100,000 people, and in 2019, residents reported 2,390 property and 286 violent crimes.

    16. Jackson

    The population of Jackson, TN is 67,191 people, and it is the county seat of Madison County. The city is the primary municipality of the Jackson Metro Area and a major trade center for West Tennessee. 

    Throughout history, Jackson was a crucial market city for cotton cultivators. In the 1850s, it became a hub for railroad systems. During the 20th century, many major manufacturing businesses opened in the area, some of which are Stanley/Black and Decker and Procter & Gamble. Japanese manufacturers such as ARJ, Pacific Industries, and TBDN also opened their offices in Jackson.

    The Jackson, TN population earns below the state average, with a median household income in the city of $43,621 and a per capita earnings of $25,595. More than 22% of residents live in poverty, despite properties being inexpensive. The median gross rent is $877, and the median house price sits at $153,500.

    When it comes to crime rates, Jackson is on the more dangerous side. Its official crime rate is 4,667 per 100,000 people, and in 2019, there were a total of 650 violent offenses and 2,473 property crimes in the city.

    17. Knoxville

    The Knoxville, TN population is currently reported at 187,603 people, and it’s a major city in Tennessee and the county seat of Knox County. It’s the home of the University of Tennessee and the principal city of the Knoxville Metro Area. 

    This city was the first capital of Tennessee, and it was quite isolated until the construction of the railroad line in 1855. After this year, Knoxville experienced a rapid rise in population. Following the Civil War, the Knoxville population was on the rise again as it became a major wholesaling and manufacturing center, but after the manufacturing sector collapsed, Knoxville faced stagnation up until the 1982 World’s Fair, which was held in this town.

    Residents of Knoxville earn below the Tennessee average, with per capita earnings of $26,340 and a median household income of $40,341. Around 24% of people live in poverty. Knoxville’s population is growing despite low salaries, along with its reputation for crime, leaving many to ask, “is Knoxville a safe city?” 

    The crime rate is 5,017 offenses per 100,000 people, which is above the state average, and in 2019, law enforcement reported 1,259 violent and 8,207 property offenses. The average rent is $845, and the median house price is $257,300.

    18. Nashville

    Nashville, commonly known as Nashville-Davidson, is the capital of Tennessee and the county seat of Davidson County. It lies on the Cumberland River, which was a major port throughout history. Nashville was founded in 1779, and the city received its name to honor Francis Nash, who was a general during the American Revolutionary War. The Nashville, TN population consists of 670,820 people, making it the most populated city in the state.

    People refer to Nashville as the “Music City” as it’s very well the heart of the country music scene in America. Additionally, many colleges and universities are located in this city, such as Tennessee State University, Belmont University, Fisk University, and Lipscomb University. 

    Nashville is also important for other industries such as healthcare, automotive, transportation, and banking. Large companies with headquarters in Nashville include Dollar General, Amazon, Captain D’s, and Bridgestone Americas.

    The Nashville crime rate is 5,114 per 100,000 people, and there were 7,449 violent and 28,496 property crimes committed in the city in 2019.

    The median household income in Nashville is slightly above the state average at $59,828, and the per capita earnings are $35,243. Approximately 15% of residents live in poverty, and despite the moderate earnings, properties in Nashville are on the pricier side. The median house cost is $341,700, and the median gross rent sits at $1,100.

    19. Chattanooga

    Chattanooga is the county seat of Hamilton Countyand extends into Marion County. The Chattanooga, TN population consists of 182,799 people, and the town is the center of the Chattanooga Metro Area and acts as a central transit hub in Tennessee, with multiple railroads and interstate highways passing through the city. 

    The Chattanooga Airport presents another significant connection to the rest of the country. This city is also the home of the Chattanooga State Community College and the University of Tennessee at Chattanooga (UTC).

    The city’s strategic location for transit made it essential during the Civil War. After the war, railroads and regular roads brought many people to the area, which allowed the Chattanooga population to grow. Today, the economy of Chattanooga is diversified, with dominant industries being manufacturing, food production, automotive industry, insurance, and tourism. Chattanooga is known for its scenic views and beautiful landscapes.

    The per capita earnings in Chattanooga are close to the state average and sit at $30,592. The median household income is $45,527, and about 17% of residents live in poverty. The Chattanooga crime rate is 6,628 per 100,000 people, making it one of the most dangerous cities in the state. In 2019, law enforcement reported a total of 1,946 violent crimes and 10,106 property offenses.

    If you’re not worried about the high crime rates and want to move to Chattanooga, the median home value in the city is $218,700, and the median gross rent is $859.

    20. Memphis

    Memphis is a city in the southwestern part of Tennessee. It’s the county seat of Shelby County and the main city in the Greater Memphis Metro Area. The Memphis, TN population is 651,073 people, making it the second-most populated city in the state. 

    For years, Memphis has been a leading commercial center for logistics and transportation. The city is also a center for education, entertainment, art, and commerce, and it has a vibrant music scene with a mixture of blues, country, rock, soul, and hip-hop. 

    The earnings of Memphis residents fall below the state average, with per capita earnings of $25,605 and a median household income of $41,228. Over 25% of residents are living in poverty, almost twice the state average. 

    Memphis is a dangerous city, with one of the highest crime cities in Tennessee. Its crime rate is 8,030 per 100,000 people, and in 2019, the police reported 39,860 property and 12,367 violent crimes.

    Even though it’s a bigger city that offers plenty of opportunities, properties in Memphis are affordable, with the median house price of only $123,800and the median gross rent of $901.

    Conclusion

    Those that want to move to Tennessee to experience the scenic charm, southern comfort, or musical culture have many options to choose from. The safest cities in Tennessee may not be the biggest. But still offer a mix of opportunity, heritage, and population to give you everything you’re looking for in a home. 

    Whether you’re looking for somewhere to develop your career, retire affordably, or be in the bustle of a big city, Tennessee has options for everyone. Like many southern states, crime rates vary and are important to consider when you’re looking to relocate.