Author: Damjan Milenkovic

  • 20+ Impressive Smart Speaker Statistics for All Voice Assistant Enthusiasts

    20+ Impressive Smart Speaker Statistics for All Voice Assistant Enthusiasts

    Smart speaker statistics show just how popular smart speakers are becoming today. These devices are not only the new way to listen to music, but now that they have voice commands, they can be so much more.

    All kinds of companies are trying to get their piece of this popular and lucrative market as more people catch onto this new technological trend.

    Find out who’s selling them, who’s buying them, and how the pandemic changed the way we think about them.

    Smart Speaker Statistics (Editor’s Choice):

    • The global smart speaker market is worth almost $12 billion
    • A quarter of people in the US have a smart speaker
    • Amazon’s share of the global smart speaker market is 28%
    • Nearly 70% of voice assistant users do their smart tasks via their speakers
    • Over 30% of people in the US aged 18 to 29 have a smart speaker at home
    • As per a report, over 150 million smart speakers were shipped globally in 2020
    • 70% of smart speaker owners have privacy concerns regarding their speakers
    • In the Q2 of 2021, Amazon shipped 10.6 million smart speaker units

    Basic Smart Speaker Statistics for 2020

    The smart speaker sphere is a booming (no pun intended) industry that continues to expand as new technology and design are implemented at affordable prices. The latest trends and stats show how smart speakers are becoming a staple in the average American home.

    1. The global market for smart speakers is valued at $11.9 billion.

    (Statista)

    According to recent smart speaker statistics, the product market is worth billions of dollars, and its popularity will continue to grow in the upcoming years. Experts predict that the market will be worth $35.5 billion by 2025, more than double that in 2020. 

    2. 25% of Americans own a smart speaker.

    (Mindstream, MarTech)

    One-quarter of U.S citizens over 18 years old have a smart speaker in their home, and current smart speaker trends show that approximately 40% of smart speaker users have more than one device. This amounts to over 157 million devices in use, with 54% using voice command options. 

    Smart Speaker Statistics

    3. With over 28%, Amazon has the biggest share of the global smart speaker market.

    (Statista)

    Amazon is currently dominating the smart speaker industry with their product Alexa, but Google comes in second with a smart speaker market share of 22.6%. Apple currently holds 7.8%. 

    4. A report showed that 154 million smart speakers were shipped globally in 2020.

    (Omdia)

    Moreover, the global smart speaker market increased by almost 60% in 2020, with the total revenue reaching $3.2 billion globally. In particular, there was a 71% increase in North America’s shipments and a 48% increase in shipments in the Asian market.

    5. Amazon shipped 10.6 million units of smart speakers in the Q2 of 2021.

    (Statista)

    On the other hand, Google and Baidu only shipped 6–7 million smart speakers each. 

    There’s an increase in these shipments compared to the same period the year before. Then, Amazon shipped 6.5 million smart speaker units, Google — 5.1 million, and Baidu — 5 million units. 

    At the end of 2019, Amazon had 15.8 million shipments of this smart listening device.

    6. Google had 13.2 million shipments of smart speakers in the last quarter of 2020.

    (Voicebot)

    Smart speaker statistics for 2019 show that Apple only shipped around 4.6 million speakers, while Amazon and Google lead the sales market. Other popular speaker manufacturers, such as Alibaba and Baidu, also increased their sales, with almost 6 million combined shipments in the same period.

    7. 69% of voice assistant users do their smart tasks via their speakers.

    (Techradar, Mindstream)

    Smart speakers are not just for easy listening and on-command song changes. Notably, smart speaker technology trends show that nearly three-quarters of owners use their smart speakers to access and control their voice assistants. 

    Research shows that people still prefer doing more complex voice assistant tasks via their phones, but 65% of people report checking the weather with their speaker, and 5% reported online shopping. Other common tasks that users report are making grocery lists, turning lights on and off, and hearing the latest headlines.

    Smart Speaker User Demographics

    The use of smart speakers varies across age, economic class, and education level. While this is an expanding industry, not everyone uses these devices the same. There is one further category that changes whether people are using smart speakers or not: beliefs about privacy and security. 

    8. 32% of Americans aged 18 to 29 have a smart speaker at home.

    (Statista)

    Recent trends in smart speaker technology show that one-third of younger generations own at least one smart speaker. Further, 28% of people aged 30 to 49 have this device at home, showing a correlation between age and likelihood of owning one, with just 20% of participants aged 50 and up reporting owning a smart speaker.

    9. 30% of U.S. college graduates have a smart speaker in their house.

    (Statista)

    Stats on the smart speaker market for 2020 show that about 27% of college-educated Americans possess this device. Notably, less than 19% of Americans with a high school education or lower admit to owning a smart speaker.

    10. 34% of Americans with an annual income of $75,000 or more own a smart speaker.

    (Statista)

    When it comes to smart speakers, economic status is a major indicator of use. Notably, 24% of those with an income of $30,000 to $75,000 have a smart speaker, compared to just 15% of U.S. adults with annual earnings of less than $30,000. 

    Smart Speaker Usage Statistics

    Even those that are only familiar with the basics of smart speakers are aware of their many uses. These smart devices can perform anything from regular everyday tasks to more complicated commands, making them a multi-functional tool for the average smart user. 

    11. Over 73% of Americans use their smart speakers to listen to a music streaming platform monthly.

    (Statista)

    Using these devices to listen to music is among the most popular smart speaker trends. Nearly 48% of adults in the United States visit a streaming platform every day, and 88% of Americans have used their smart speakers to listen to music at least once.

    12. 66.2% of U.S. adults use smart speakers to ask a question at least once a month.

    (Statista)

    Around 83% of Americans have tried to use their speakers for the purpose of asking a question at least once. In addition, voice assistant statistics show that 29% of U.S. adults ask a question via their smart speaker every day.

    13. Almost 60% of Americans have used their smart speakers to set their alarm.

    (Statista)

    According to research, 64.5% of U.S. adults have tried to set a timer with the help of their smart speaker, and almost 60% of Americans have tried to listen to the radio on their smart device at least once.

    Security: Smart Speakers Statistics

    Ever since smart speakers were created, customer concern about the amount of information stored and shared on them has been growing and not without merit. Various brands have been outed with scandals about data collection, sharing, and use without permission resulting in increasing concern over privacy policies and security measures.

    14. 7 in 10 smart speaker owners have privacy concerns about their speakers.

    (MobileMarketing)

    Hub Entertainment Research conducted a study on the smart speaker market and user privacy concerns. The study showed that, while the number of customers continues to rise, the concerns about privacy and security remain a pertinent issue.

    15. 91% of users are worried that their speakers are listening to them without their knowledge.

    (MobileMarketing)

    The same study showed that the main concern of smart speaker customers is that their speaker is eavesdropping on them. According to smart speaker technology trends,

    90% of consumers reported being afraid that their data is being collected without their permission, and their conversations in their home are being recorded. 

    This concern isn’t without cause, either. As several cases with this new technology have indicated that the devices stay recording, even when a trigger word hasn’t been said. 

    16. 55% of smart speaker owners claim they feel anxious about their speakers listening in on their conversations.

    (SurveyMonkey)

    Survey Monkey conducted an opinion study on Apple, Google, Amazon Echo, and Alexa user statistics. Almost 60% of participants reported that privacy concerns are the main reasons why they opted not to have one, while 30% reported expense as the main reason they don’t own one.

    17. 63% of smart speaker non-users in America are afraid of hacking.

    (Intrado)

    Two years prior to this survey, just 41% of non-users had the same fear indicating an increasing level of unease regarding privacy and security with smart devices. Moreover, 40% of people that don’t have a smart speaker are afraid that the government is using these devices to monitor them.

    The Effects of the Pandemic on Smart Speaker Statistics

    The pandemic brought many uncertainties, but one thing we know for sure: technology became our greatest crutch and ally through this period. The pandemic influenced the way people use, buy, and think about technology in a major way. 

    18. 36% of people in the U.S. listened to music and entertainment on their smart speakers more often during the pandemic.

    (Statista)

    The pandemic resulted in people being at home far more than at any point in history. Notably, 55% of those in the smart speaker market share said their user behavior didn’t change in 2020, while 9% reported listening to music on their smart speakers less often than before the pandemic.

    Still, 52% of people in the US aged 18 to 34 listened to music on their smart speakers more often, while 39% of Gen Z and Millennials reported that the pandemic didn’t affect their usage at all. 

    Smart Speaker Statistics #2 (1)

    19. 35% of people living in the U.S. used their smart speakers for news and information more frequently.

    (Statista)

    A survey on smart speaker stats also showed that a certain number of people used their devices for getting information more frequently, while 9% of survey participants reported they used their speakers less. Ultimately, the majority of people used their smart speakers for news just as frequently as before.

    20. 50% of people that are 18 to 34 years old listened to news via their smart speakers more during the pandemic.

    (Statista)

    According to stats on smart speaker demographics, both Gen Z, Millennials, and Gen Xers said they used their smart speakers for news more often during the pandemic. Just 16% of those aged 55 or older reported using smart speakers for this purpose.

    21. 34% of people that didn’t own a smart speaker during the pandemic claimed they were likely to buy the device in the next six months.

    (InsideRadio)

    Smart speaker ownership stats showed that the pandemic signaled a call for all those that didn’t already have a smart speaker in their home to try it out. The numbers grew even more for those that use voice commands on their other devices like smartphones, and 52% of consumers said they plan to buy a smart speaker in the next six months, even if they already have one. 

    Smart Home Speaker Statistics: Final Thoughts

    The adoption of smart devices in the global population is dramatically growing every year. Smart speakers have the ability to aid in everyday tasks as well as perform more complicated assignments in a matter of seconds.

    The market is currently dominated by three major companies: Amazon, Google, and Apple, but there are a few smaller brands that also are taking their share of the profits. The use of smart speakers varies based on several demographics such as age, educational, level, and economic status.

    Still, smart speaker statistics show that the pandemic encouraged many to adopt this technology and employ its many different uses.

    People Also Ask

    How many smart speakers are there?

    According to available statistics, the number of smart speakers that are currently in use is 320 million as of 2020. Experts predict that there will be twice as many speakers of this kind by the end of 2024. Furthermore, almost 90 million adults in the United States use this new technology, over 30% more than in the year before.

    What is the point of smart speakers?

    Smart speakers have multiple functions, with the primary purpose of controlling these processes using voice control. The most popular use of this device is to access music streaming platforms and select songs and music genres without being near the device.
    Voice assistants can be used to check email, report daily news, check outside temperatures, and also control other devices within a smart house network such as locking doors, turning lights on and off, and alarming or disarming security systems.

    Are smart speakers useful?

    If you want a smart home or simply want to simplify your daily activities, smart speakers can be helpful. For example, you can use your voice to command your speaker to wake you up with your favorite song. You also have the ability to have all of your questions answered in a matter of seconds, or shop online effortlessly.

    How much data does a smart speaker use?

    The answer depends on which type of speaker you have as well as what kind of command you’re giving. For instance, Alexa uses around 36 MB of bandwidth daily. In case you want Alexa to turn your light on or off, it will only need about 5 kB of data. Assigning Alexa to play radio will take you around 28 MB of bandwidth.

    Which is the best smart home speaker?

    Smart speakers come in different sizes, with various features, and at different price points. As such, knowing what you want out of your speaker is the best way to determine the most suited one for your needs.
    Besides the basic properties such as the size, price, and features, checking the audio quality is a major factor to consider. Ensuring the speaker will pair with your other devices is especially important if you want to integrate it into your existing smart home.

    Are smart speakers safe?

    According to experts, smart speakers from the most popular manufacturers such as Google, Apple, and Amazon, passed the basic security measures and are safe to use. Still, many are concerned about privacy and safety considerations.
    For instance, in 2020, a significant error allowed Google Home devices to record customers at all times without their permission. The bug was fixed, but it showed us how dangerous our smart devices could be to threatening our most intimate privacy. Current smart speaker statistics show that many are skeptical about the possibility of privacy invasion by this useful, yet powerful technology.


  • 30 Interesting Rental Statistics to Know in 2024

    30 Interesting Rental Statistics to Know in 2024

    According to rental statistics, 43 million rental homes were occupied in the US in 2020. Owning a home with plenty of room and a spacious yard is the ultimate dream for many families. Although there are more homeowners than tenants, the rising prices of residential properties have pushed people to rent instead. 

    Of course, there’s nothing wrong with living in rented homes, but it might be prudent to test out if renting is really the more economical choice for you and your family. 

    To help you determine which option is better, we have gathered some interesting statistics for you to take a look at. Read on to find out.

    Top Rental Stats (​Editor’s Choice)

    • The US national average rent as of February 2021 was $1,124
    • In the first 10 months of 2021, the national median rent has increased by 16.4%
    • 15% of all renters in the US were behind on their rent payments in August 2021
    • The District of Columbia has the highest rent out of 56 states and territories
    • 45% of renters regret renting
    • Rental households owe more than $20 billion to their landlords
    • More than 15 million people are at risk of eviction
    • 11% of all rent-based households use government programs to find and pay for housing

    Worrying ​Rental Statistics in America

    1. 62% of renters are anxious they won’t be able to make regular rent payments.

    (Market Place)

    The COVID-19 pandemic has dampened the nation’s general outlook. As a result, many people are wondering how they will cover even their basic living expenses, such as food and shelter, amidst rising unemployment rates. That said, 62% of renters are worried about the immediate future and the possible inability to pay rent regularly.

    2. The average monthly rent in February 2021 was $1,124.

    (Statista)

    In the US, the average rent paid in February 2021 was $1,124. From 2017 to 2021, the average rent for all types of apartments has increased, but there is a subtle decrease compared to the figures before the pandemic. In other words, the average rent was $1,105 in January 2019. 

    3. In the first 10 months of 2021, the national median rent has increased by an astonishing rate of 16.4%.

    (Apartment List)

    This increase is at least five times higher than the average rent increase percentage during pre-pandemic years (2017–2019). To compare, the rent increase during these pre-pandemic years only averaged 3.2%. That said, some cities are witnessing an incredible rent prices increase—rents in Tampa, Florida are up 36% compared to March 2020.

    4. 66% of renter households earning less than $25,000 have used their Economic Impact Payments on rent payment.

    (Forbes)

    Rental payments are usually a top priority for any American household. However, rental market statistics show that rental households won’t be able to make regular rental payments given the current global health crisis that has affected the average American’s income. In addition, statistics show that a huge number of households won’t be able to make their monthly rental payments without any government aid. 

    5. ​By the end of 2021, the average American household will likely spend more than 30% of its income on rent.

    (Zillow)

    Rental statistics show that the average household spent 25.8% of its income on rent between 1985 and 2000. Two decades later, the percentage is up by 4.4 points (30.2%). This is above the 30% threshold at which a person is classified as “housing cost-burdened.” 

    The higher the percentage, the more people will struggle to make payments. However, this percentage is not the same across the nation. For instance, rental analysis shows that this percentage goes up to 39.3% for Miami renters and is expected to rise to 40.3% by the end of the year.

    6. Americans paid $512 billion in rent in 2019.

    (The Real Deal)

    According to 2019 data, the total rental payments in the US reached $512 billion. This figure is 10% more than the average rental bill of the decade. Reports attribute the 2019 total rental bill increase to the rising number of renters and the soaring rental rates.

    7. Rental market analysis shows that 15% of American renters were behind on their rent in August 2021.

    (National Equity Atlas)

    Recent research showed that 15% of all renters have unpaid rents. What’s worrying is the fact that 48% are families with children. An estimated 6.7 million children in these households are in danger of being evicted. This number is closely approaching the 2008 foreclosure crisis that caused 8 million households to lose their homes. 

    8. Recent rental property analysis shows that ​single-family homes account for 39% of rental units in the US.

    (ManageCasa)

    This type of rental unit just recently became popular. Real estate investors used to view single-family detached home rentals as less profitable because of increased maintenance and management costs. 

    However, the market is slowly shifting due to increased demand from older Millennials looking to relocate to safer suburban and rural areas but couldn’t afford to purchase a home. Nowadays, single-family detached homes account for a little over a third of all residential rental units in the US. Of course, the increased demand also caused a subsequent increase in the average monthly rent for a house. 

    9. The District of Columbia has the highest rent in the US. 

    (RentData)

    According to the HUD, the Fair Market Rent for a two-bedroom home in DC is $1,765 per month. Fair Market Rent is essentially the 40th-percentile of typical prices for new renters in a given region. For perspective, the median value is the 50th-percentile. 

    When it comes to Fair Market Rent, DC is followed by Hawaii, where a two-bedroom home costs $1,798 to rent. California previously had the highest FMR, but it’s now fourth on the list. The average rent in California for a two-bedroom home is $1,526.

    10. San Francisco saw the sharpest rent decline in Q1 of 2021. 

    (JCHS)

    As the COVID-19 pandemic hit, areas with high rents recorded the sharpest drop in rent prices. Due to job insecurity, many people moved out of the expensive apartments, and those who were considering renting a posh place decided to wait. 

    This resulted in rent reductions in typically expensive cities. For example, San Francisco saw a 20% drop in rent prices in the first quarter of 2021. San Jose recorded a 16.5% drop, followed by New York (15%) and Boston (8%). On the other hand, rents have increased in lower-cost markets like Boise (11%) and Fayetteville (10%).

    Homeowners vs. Renters Statistics

    There are advantages to each. Firstly, you don’t need large amounts of money to start renting, and the market is well-regulated, protects both parties in the contract, and minimizes the chance of misunderstandings. Secondly, homeownership means you’re investing your money instead of just spending it on rent. 

    11. 65.4% of households own the home they live in.

    (Census Bureau, Pew Research Center)

    According to homeownership vs. renting statistics released by the Census Bureau for the third quarter of 2021, there were 142.1 million households in the US. Moreover, 65.4% of these households own the home they live in, while the rest of these households rent their homes. 

    However, the percentages are not evenly distributed among races and ethnicities, as 58% of African-American or Black and 52% of Latino or Hispanic households rent their homes. On the other hand, rent statistics show that only 27.9% of white households live in rental homes.

    12. ​45% of renters regret renting rather than purchasing their homes. 

    (The Mercury News)

    In a survey conducted among 10,000 homeowners and renters from 20 of the largest metros in the US, 45% of those living in rental housing said they regret not purchasing their own homes. There are three identified reasons for this.

    The first reason is the lost opportunity in building equity on a home. The second is their inability to customize a rented home according to their personality and preferences. Lastly, they couldn’t control the steep rental rates for homes that are increasing year on year.

    13. 38% of renters in the US state list not having enough money for a down-payment as the main reason for not buying a home.

    (Statista)

    In a recent survey, people who were asked about the reasons for not buying a home listed not having enough money for the down payment as the top reason. Other factors included a bad credit score (32%) and the COVID-19 pandemic (31%). In this case, a government assistance program that would help people allocate the money for a downpayment could change renting trends.

    14. Homeowners in Rockingham County, NH save an average of $2,000 a month compared to renters. 

    (Rent.com)

    In this second-most populous county in New Hampshire, the average mortgage rates per month are almost $2,000 less than the average rent. In general, the Northeast is best for people looking to buy a home instead of renting. Even though houses and apartments are not cheap there, it’s much more affordable to pay for a monthly mortgage than rent. 

    This applies to nearly every major Northeastern metro area. Rental statistics by zip code show that Rockingham County, NH, New Brunswick, NJ, and Newark, NJ top the list of metro areas where home buying is cheaper than renting. In New Brunswick, homebuyers save up to an average of $1,825 per month compared to renters, while in Newark, they save up to $1,681. 

    15. Renters in San Francisco, CA save nearly an average of $2,000 a month compared to homeowners. 

    (Rent.com)

    The Bay area is generally expensive, whether you are buying or renting a home. However, with house prices regularly going over $1 million, it’s statistically cheaper to rent there. The average rent in the Bay Area is the fourth-highest in the US. In San Francisco, the average rent is $3,218 a month, whereas the average monthly mortgage is $5,201. In San Jose, the average monthly mortgage is $4,614, while rent is an average of $3,104.

    16. US renters paid $4.5 trillion in rent between 2010 and 2020.

    (Zillow)

    The rental market is one of the biggest sources of money for the economy. Zillow estimates that renters in the US paid a total of $4.5 trillion in the 2010s. This is a lot of money, considering that this amount is higher than Germany’s GDP in 2018. Moreover, in 2019 alone, Americans spent $512 billion on rent. 

    Rental Vacancy Rate

    The vacancy rate of rental properties is a helpful indicator of the rental market’s health. When the vacancy rate falls below 7%, the demand for rental properties is said to be high. Conversely, if the vacancy rate increases to 12%, the demand is said to be low.

    17. In 10 years, rental vacancy rates in the US decreased by 15%. 

    (Statista)

    The US rental market has seen a decreasing trend in vacancy rates in the last 10 years. In 2009, vacancy was at an astonishing rate of 40%. However, in 2019, the rate decreased to 25%. This rental market trend reflects a growing demand for rental properties.

    18. In the past five years, the apartment rental industry’s market size in the US has grown by an average of 2.7% annually. 

    (IBISWorld)

    In the past five years, the market size of the apartment rental industry in the US has seen a steady increase. The shortage of affordable rental units and a surplus of luxury units contributed to the average annual rental increase. Moreover, declining vacancy rates gave landlords more opportunities to charge higher rents. However, these trends were diminished in 2020 due to COVID-19 and the rise in unemployment that inevitably ensued. 

    19. Renters occupied about 43 million housing units in 2020. 

    (Statista)

    The demand for rental units is on the rise. In 1975, there were only 25.66 million rented housing units. Experts believe that one of the reasons for the rental growth rate is that buying a home has become increasingly difficult in recent years. Subsequently, the increasing demand for rental properties has increased rent prices.

    20. More than 15 million people are at risk of eviction.

    (Aspen Institute)

    To fight the effects of a pandemic-induced financial crisis, the United States federal government gave financial aid to a significant number of renters who lost their jobs. It also proclaimed a moratorium on evictions in cases of renters failing to pay rent. 

    However, with the moratorium’s expiration and steady rise of average rent in the US, many renters are in danger of being evicted. Some estimates say it’s more than 15 million people.

    21. US rental households collectively owe more than $20 billion in rent. 

    (Aspen Institute)

    The pandemic-induced economic crisis took its toll on the rental market. The average debt owed to rental property owners surpasses $3,000. Factors that contributed to this high average rental debt include the rising unemployment numbers and prioritizing other basic needs in the home. Nowadays, 15 million Americans, consisting of 6.5 million households and 7.4 million adults, are in danger of being evicted.

    22. National eviction statistics show that West Virginia has the highest percentage of renters facing eviction. 

    (Forbes)

    There are significant differences in percentages of renters facing eviction between states during this pandemic crisis. For example, with 60% of renters facing eviction, West Virginia is now the hardest-hit state, whereas only 22% of Vermont renters could lose their homes. 

    23. A prolonged eviction costs up to $10,000. 

    (RentRedi)

    There are many expenses involved in evicting a tenant. Property management statistics show that these expenses include lost rents, legal fees, cleaning costs, repair costs, etc. The worst-scenario evictions, where the landlords have to go to court and make substantial repairs, can result in losses of up to $10,000. Situations like these have made tenant screening services very popular. By doing proper background checks and choosing good tenants, the landlords can reduce risks and costs to a minimum.

    24. 10.3 million Americans filed income tax returns with rental properties.

    (IRS)

    Based on the latest data on individual income tax returns it received, the IRS calculated that approximately 10.3 million people earn from 17.7 million rental properties. These renting statistics don’t include rental properties owned by companies. That said, we can say that the average landlord in the US has 1.7 rental properties.

    25. Total revenue from vacation rentals in the US is projected to exceed $16.6 billion in 2021.

    (Statista)

    Vacations are considered essential for our mental well-being. This is why it’s considered a stable industry and why we continue to see year-on-year growth in vacation rental industry statistics. In fact, the US vacation rental market is expected to reach $16.63 billion in 2021. 

    In comparison, the global revenue in vacation rentals is projected to be $59 billion. This growth is credited to the shift in the accommodation preference of vacationers from hotels to rental properties because of privacy and cheaper rates. These advantages are especially significant to travelers during the COVID-19 pandemic.

    26. The apartment turnover rate fell by 5.4% from 2019 to 2020.

    (CBRE)

    The turnover fell from 47.5% in 2019 to 42.1% in 2020, and that’s the lowest turnover rate in over two decades. There has been a continuing long-term decline in apartment turnover rates in the past years, but it was accelerated further by the COVID-19 pandemic. This can be explained by people’s reluctance to move amid a pandemic and the economic downturn and financial insecurity it has caused.

    ​Renter Demographics

    27. ​Almost half of the renters in 2019 were under 30 years old.

    (Statista)

    Statistics show that young people are the most common renters, and it’s hardly surprising. They just left their parents’ house or graduated college, and they are taking their first independent steps in life. Unfortunately, one of the first challenges they will have to face is the rising average renting price. As a result, 36% of them are late with their payments, especially in the midst of the pandemic. 

    28. 11% of US rent-based households use government programs to find and pay for housing.

    (USA Facts)

    The US Department of Housing and Urban Development (HUD) has several subsidized assistance programs for people struggling to pay rent or find a home to rent. These programs include public housing, housing choice vouchers, and Section 8 programs. 

    In 2019, around 5 million households used these benefits, constituting 11% of all rent-based households in the US. Furthermore, 32% of these households are headed by single mothers.

    ​Conclusion

    With the average annual rent increase in the US of 3% to 5% in the past 10 years and the staggering 16.4% increase in median rent in 2021, renting has become a burden for many people. 

    The question of whether renting is a better option than buying a home depends on a household’s stability. Buying a home doesn’t seem wise for households that expect to move a lot, especially for career advancement. With recent rental stats in mind, households can see renting as part of a season of transitions. 

    Location is another thing to keep in mind. If you’re located in the Bay Area, you can save more by renting rather than paying a monthly mortgage. However, if you live in the Northeast, buying a home might make more sense.

    People Also Ask

    How many people rent in the US in 2021?

    According to the US Census Bureau, almost 44 million American households lived in rented homes in the third quarter of 2021. Renter-occupied units make up an estimated 30.9% of the US housing inventory. Therefore, it can be said that approximately one-third of Americans live in rented homes.

    What percent of people are behind on rent?

    Recent research shows that 15% of all renters have unpaid rents, and 48% are families with children. An estimated 6.7 million children live in households that are in danger of being evicted. The total rent owed to landlords has reached $20 billion, and the average sum owed per household is more than $3,000.
    This collective debt in rental payments puts a lot of strain on landlords and renters, and with the eviction moratorium ending in most states, there is no doubt that the coming months will be more challenging for them.

    What is the average rent in the US in 2021?

    According to the latest available data, the average rent paid in February 2021 was $1,124. The rate remained roughly the same throughout the COVID-19 pandemic. In January 2019, the average rent paid was $1,105.
    Rent varies depending on the location and the size of the rental property. In February 2021, the average rent was $1,704 for a five-bedroom home and $929 for a studio apartment. By state, Hawaii has the highest average rent per month at $1,907, while West Virginia has the lowest average at $788.

    How big is the rental market in the US?

    Measured by revenue, the market size of the apartment rental industry in 2021 has reached $174.2 billion. In the last five years, it has grown 0.5% per year on average. The growth would be substantially higher if it weren’t for the 3.9% drop in 2021. The market is expected to recuperate in 2022 and continue to grow steadily.

    What time of year is rent the cheapest?

    In general, rents tend to be lower during the winter months — that is, between December and March. On the contrary, the “worst” months to start an apartment hunt are between May and October.
    A recent study showed an average 3.4% difference between “cheap” and “expensive” periods. However, rents in some cities are more susceptible to seasonal changes. For example, New York sees a 4.7% price difference between seasons.

    Why is California rent so high?

    California, in general, is one of the most expensive states. The cost of land, labor, and raw materials is higher in California than in the rest of the country. In addition, it has limited land for building, high demand, and a large influx of people with high-paying jobs—all these factors contribute to high rents. That said, it’s even more expensive to buy a home in California. For example, rental statistics show that renters in the Bay Area can save up to $24,000 a year compared to homebuyers.

  • Worrying Cyber Warfare Statistics – Is This World War C?

    Worrying Cyber Warfare Statistics – Is This World War C?

    The cyber warfare statistics are hard to get by due to the secrecy that this type of conflict implies. With no tanks and airplanes or visible death tolls and destruction to catch the public’s eye, the cyberwar manages to slip underneath our radar. However, it is global and influences our lives considerably.

    What makes cyberwar interesting is that there are no clear favorites and underdogs here. Instead, countries that wouldn’t dream of openly confronting their much stronger opponents are equal on this battlefield. And that is what makes cyberwar so unpredictable.

    To help you better understand the current situation on the cyber battlefield, we have collected some interesting statistics.

    Important Cyber Warfare Stats – Editor’s Choice

    • Ray Tomlinson, the inventor of email, created the first computer worm in 1972
    • 40% of global cyber espionage happens in the finance, information, and healthcare sectors
    • 3% of all data breaches in 2020 can be attributed to cyber espionage
    • Colonial Pipeline had to pay a $4.4 million ransom to get control of its pipeline network back from the hackers
    • Colonial Pipeline paid a $4.4 million ransom to get control of its pipeline network back from the hackers
    • NotPetya ransomware caused more than $10 billion in damages
    • Yahoo breaches left more than 3 billion records exposed
    • Iran claims it has more than 120,000 cyberwar volunteers at its disposal

    Cyber Warfare: Attacks That Shaped the World We Live In

    Every journey begins with a small step, and cyber warfare’s story isn’t very different. Although these first attacks look naive compared to today’s massive nationwide attacks, they paint a picture of how cyberattacks and cyberwar evolved over the years. As the digital devices became more advanced and innumerable, so did the attacks.

    1. Ray Tomlinson, the inventor of email, created the first computer worm in 1972.

    (Avast)

    It was not a malicious worm, as it was designed to catch Creeper, a program running around the ARPANET network (the internet’s predecessor) and leaving breadcrumbs. We have to mention that computer worms and viruses are entirely different types of cyberattacks. 

    While the virus needs your computer’s resources, programs, and sometimes even your actions to become active, the worm is entirely independent. It has everything it needs to hit the ground running and start replicating as soon as it reaches the host device.

    2. The first DDoS attack affected about 10% of all computers on the internet, and it was completely unintentional.

    (WeLiveSecurity)

    In 1988, Robbert Morris wanted to know how big the internet was, so he created a worm that would go from one device to another, replicate, and then send a pingback. Since there were no antivirus programs at the time, the software (later named Morris Worm) could run free and cause havoc. 

    The cyberattack statistics show that it had infected tens of thousands of computers, which was about 10% of the internet back then. When Morris saw that the pings clogged the network, he sent out warnings across the internet, and it took experts from Berkeley and Purdue three days to stop the worm.

    3. One of the first hacking attacks happened in 1976 when a 16-year-old boy hacked into Ark, one of the most advanced computers at the time.

    (Avast), (The Register)

    This attack has a prominent place in hacking statistics because of the perpetrator’s age and the method used. Namely, Kevin Mitnick used social engineering to gain developer access to the Ark, the central computer at Digital Equipment Corporation. 

    By listening to the company’s calls, he managed to get enough information to convince the people in the company that he works as a developer there, and they’ve given him the passwords he needed.

    4. 1989 witnessed one of the first ransomware cyberattacks, and stats show that it had affected medical research facilities across 90 countries.

    (Digital Guardian)

    Joseph Popp, Ph.D., an AIDS researcher, created and distributed malware that later became known as AIDS Trojan or PC Cyborg Virus. He sent out 20,000 floppy disks to AIDS research facilities across the globe, claiming that they contained important research material. 

    The malware was set up to activate after the computer was turned on 90 times. After activation, it would encrypt all the data and show a message demanding that $189 be sent to a Panama P.O. box.

    5. One of the first examples of cyber warfare happened in 1986 when a hacker broke into the Pentagon’s computers.

    (IFSEC Global)

    German computer hacker Marcus Hess hacked his way into the US Army mainframe and was able to access 400 military computers, some of them belonging to the Pentagon. Fortunately, he was stopped before he could steal confidential data and sell it to the Russians. 

    Even though it was prevented, the attack was a sign that security had to be improved. It is no surprise that the following year both eastern and western blocks had their first commercial antivirus software, NOD32 and McAfee.

    Contemporary Cyber Security Statistics

    6. The US budget for cybersecurity is planned at $18.78 billion, which is a decrease from 2020.

    (Statista)

    Despite the increasing threats, the national cybersecurity budget has decreased in 2021, from $18.79 to $18.78 billion. This is also surprising because the budget was constantly rising from 2017 when it was just $13.15 billion. Understandably, the government wants to save money due to the high cost of Covid-19 relief programs. However, this decision could also reduce the US cyber warfare capabilities.

    Still, increasing cybersecurity and awareness about the importance of cybersecurity could save billions of US taxpayers’ money. Namely, a considerable percentage of ID frauds in the past two years were related to the government’s Covid-19 relief program. The cybercriminals would set up false identities and get the government’s payments.

    7. The Federal Agencies registered 30,819 cybersecurity incidents in 2020, which is an 8% increase from 2019.

    (FISMA), (Statista)

    Even though the numbers are high, they are still far below the record-breaking 2015, when 77,183 cyber incidents were reported. Unfortunately, cyber warfare statistics for 2022 will likely show much higher numbers because they will include cyber incidents related to the massive breach at SolarWinds that was first registered in December.

    8. SolarWinds’ breach in December 2020 left more than 18,000 companies and government organizations exposed.

    (Business Insider)

    The latest (known) significant data breach happened in December 2020. Among the 18,000 affected organizations were the Pentagon, the Department of Homeland Security, the State Department, Microsoft, Cisco, Intel, and Deloitte.

    The attack began in early 2020 when hackers found their way to SolarWinds’s mainframe. The company provides IT services to more than 30,000 clients, and cybersecurity statistics show that the attackers gained access to many Fortune 500 companies and government institutions. After an investigation, the US accused a Russian hacker group backed up by the Russian government of being responsible for the incident.

    9. The biggest data breach so far is the Yahoo cyberattack, with more than 3 billion records exposed.

    (Statista)

    What enabled the hackers to access so many records was the fact that the breach was discovered in 2017, four years after the company’s security was compromised. This was not, however, the only significant attack on the company. 

    For example, in the 2014 breach (which was discovered in 2016), more than 500 million records were exposed. This cyber warfare attack is believed to be state-sponsored.

    10. 40% of global cyber espionage happens in the finance, information, and healthcare sectors.

    (Statista)

    According to the 2020 data, there were 147 cyber espionage attacks in the finance sector. It is followed by information and healthcare sectors, with 145 and 119 attacks, respectively. The safest industries were accommodation and administrative, with 11 and 10 events. 

    Results like these are to be expected. The statistics on cyber warfare show that cyber espionage follows the money, and the highest-grossing sectors are the most tempting targets.

    11. The top two methods of identifying cyber espionage are suspicious traffic detection and antivirus programs, with 48% and 23%, respectively.

    (Verizon)

    Emergency response teams and law enforcement agencies are far behind on the list, with 7% and 4%, respectively. The numbers differ very much when it comes to detecting all data breaches. Here, law enforcement and fraud detection services discover almost half (47%) of this kind of cybercrime.

    Global Cyber Warfare Statistics

    It is challenging to determine if cyberattacks are state-sponsored or done independently by some interest groups who are after financial gains. But it’s not hard to imagine that plenty of independent groups out there are allowed to work by their governments in return for occasional services and a promise of not attacking the national interests. Something like privateers during the colonial era.

    12. With more than 65,000 startups in 2019 and $135 billion investments in the high-tech sector, the USA is unmatched when it comes to cyber power.

    (IISS)

    According to the International Institute for Strategic Studies, the United States is unmatched in cyber power and its ability to conduct cyber warfare operations. It’s the only country in the Tier 1 group.

    Countries like China, Russia, Australia, Canada, France, and Israel are placed in the Tier 2 group. The Tier 3 group is populated by North Korea, Iran, India, Indonesia, and Japan.

    The research also suggests that even though countries like Russia, China, Iran, and North Korea have pretty limited cyber defenses, their ability to conduct attacks is very high. This is because their budgets are directed at developing different types of cyber warfare attacks rather than defensive capabilities.

    13. Iran claims it has more than 120,000 cyberwar volunteers at its disposal.

    (CSIS), (The Record)

    Furthermore, Teheran constantly increases its cyber budget and has allocated an extra $71.4 million to cyberspace programs in 2021. According to experts, Iran is a classic example of how a medium-sized actor can become a considerable opponent when he invests enough determination and money. 

    The Iranian government claims it has more than 120,000 cyber warfare volunteers. With that kind of manpower, it could conduct thousands of cyberattacks per day.

    Although experts believe the numbers are exaggerated, they still confirm that the Iranian government has an enormous recruitment pool in universities and religious schools.

    14. 64% of experts agree that there was a worrying escalation of tension in 2020.

    (HP)

    Around 75% of them agree that Covid-19 presented a great opportunity for some nation-states to exploit. Experts also note that countries and organizations must concentrate on cyber warfare preparation. Statistics back their recommendation, as the latest data show a cyberweapon stockpiling. Namely, 10-15% of purchases on the Dark Web are done by agents acting on behalf of other clients, presumably nation-states.

    15. 35% of all cyberattacks in India in 2019 came from China.

    (Subex Secure), (Indian Defense Review), (Business Standard)

    In total, there were 50,000 cyberattacks against India in 2019 originating from China. Cyberattacks follow important geopolitical and local events. To illustrate the point, India was the most attacked country in the world during the spring of 2019. 

    During that period, it had limited armed conflict with Pakistan, local elections, and state-changing laws approved in the Parliament. Cyber warfare stats show that for the rest of the year, the US held the title of the most attractive target.

    16. The US, UK, and EU accused China of sponsoring the Microsoft Exchange attack in 2021, which affected at least 30,000 organizations worldwide.

    (BBC)

    The episode started in January, when Hafnium, a Chinese-linked hacker group, started exploiting a weakness in Microsoft Exchange. The attack was targeted against the group’s usual marks, such as defense contractors, universities, and think tanks. 

    The breach was discovered and contained relatively quickly (in March), but not before more than 250,000 companies and organizations were exposed, and at least 30,000 were compromised. The Chinese government denies any involvement..

    17. Chinese cyberattack statistics show that the country has been a target of more than 2,700 sophisticated cyberattacks in the past few years.

    (Global Times)

    The representative of 360, a Chinese cybersecurity company, stated that it identified more than 40 high-level hacker organizations and over 2,700 sophisticated cyberattacks against China and its interests. 

    Unfortunately, the reports don’t show how many attacks were there in total. Still, considering that the majority of attacks (in general) are low-level, we can assume that the total number is much higher.

    18. World cyber warfare statistics show that 42% of all cyber espionage data breaches in the last six years happened in the Asia-Pacific region.

    (Verizon)

    It is followed by Europe, Middle East, and Africa region with 34%. Surprisingly, North America is in third place with just 23%. The perspective changes when we look at the total data breaches numbers. Here, the North American region takes first place with 65% of all data breaches globally. 

    This clearly shows that most financially motivated data breaches happen in wealthy regions. In contrast, classic cyber espionage mostly happens in “unstable” and “underdeveloped” parts of the world.

    It is tough to distinguish if high-level cybercrimes are done for financial gain or to weaken a country’s economy. That’s because the financial loss that the company suffers is never the only consequence — it always causes market tremors on a national level, thus weakening a country’s economy. No one can say where financially motivated cybercrime ends and cyber warfare begins.

    19. The average cost of a data breach is around $3.86 million.

    (Insurance Information Institute)

    A recent study showed that the average cost of one global cyberattack data breach is $3.86 million. But the study included only the direct costs like regulatory, legal, and technical expenses. 

    The cost and damages of the clients whose data was stolen were not calculated. That said, we can say that the total numbers are probably much higher than what the study suggests.

    20. China has the highest rate of DDoS attacks, more than 800 million per day.

    (Carnegie)

    However, most of these attacks (about 97%) came from domestic hackers. The cybercrime statistics show that the percentage of overseas attacks is small, but the experts state that it is rising. They mostly came from the US, South Korea, and Japan. As expected, the attacks that came from abroad primarily targeted government and financial organizations.

    21. 3% of all data breaches in 2020 can be attributed to cyber espionage.

    (Verizon)

    Overall, cyber espionage ranks as the 7th most common data breach reason, and the number is declining. For instance, in the period 2014-2020, the percentage was much higher, standing at 11%. 

    However, the latest numbers in cyber espionage statistics may not tell the whole story. Namely, this type of attack is challenging to detect because it goes after a limited amount of important data and leaves a much smaller trail.

    22. 39% of cyber espionage breaches are discovered after one or more years.

    (Verizon)

    Since most attacks of this type are conducted by highly skilled professionals, they are well planned and executed. That makes them very difficult to detect. What’s worrying is the fact that 56% of the attacks discovered required several weeks to several years to be contained.

    23. Cyberattack statistics by year show that the ransomware victims paid $350 million in 2020.

    (Institute for Security and Technology)

    This is a 311% increase from 2019. The average ransom payment also went up and reached $313,493 in 2020, which is a 171% increase from the previous year. As the ransomware’s quality increases, so does the ransom amount. 

    Unfortunately, that is not the only expense victims have to pay. They often have legal and reimbursement expenses and long-term damage such as loss of reputation. On average, it takes 287 days for a company to recover from a ransomware attack.

    24. Cybercrime will cost the global economy $6 trillion annually, and it will be more profitable than the illegal narcotics trade.

    (CyberCrime Magazine)

    Whatever the immediate causes of cyber warfare may be, it all comes down to money. By definition, cyber warfare involves attempts to weaken or destroy a rival country through computer technology. However, the attackers, in this case, aren’t destroying data — they’re stealing it. 

    They’re accumulating so many assets that experts predict cybercrime will soon become more lucrative than the drug trade. What’s more, if cybercriminals had a country of their own, it would be the world’s third-largest economy, just behind the US and China.

    25. When it comes to nation-state cyber warfare, the statistics show a 100% increase in state-sponsored major attacks between 2017 and 2020.

    (HP)

    Interestingly, only about 20% of the attacks involved sophisticated and custom-made malware. Instead, more than half of the attacks were conducted using simple and low-budget tools sold on the dark web. 

    There are different explanations for these numbers. But since the statistics record just episodes that are discovered, the most plausible is that hackers who use sophisticated tools don’t get caught that often.

    Important Cyber Warfare Attacks

    Even though millions of cyberattacks are happening in the world every day, a tiny percentage is actually successful. But, unfortunately, when they occur, they affect countless people, companies, and organizations. They cause substantial damage, influence public opinion, and instill a sense of insecurity in the country’s population.

    26. In June 2021, Chinese hackers targeted MWD of Southern California, which operates several water plants and provides water to 19 million people.

    (LA Times)

    June witnessed one of the most dangerous cyber warfare attacks on the US. Statistics show that attacks often follow important local events, and this incident just goes to prove that claim. For example, during one of the worst drought seasons in California, the attackers gained access to Pulse Connect’s mainframe and, through it, targeted MWD.

    Luckily, they were stopped on time due to the early warning of possible cyberattacks sent out by Homeland Security. So far, US cyber warfare statistics show that there is no immediate damage from the attacks.

    27. The most devastating cyberattack to date is NotPetya, a ransomware that caused more than $10 billion in damages.

    (Business Insider)

    The experts assume that the malware started off as a tool in Russia’s attempt to damage Ukraine’s economy during their unofficial conflict. But, in time, it became a global threat. It crippled companies across the world and caused $10 billion in damages. Data breach statistics show that, ironically, it even affected Rosneft, the Russian national oil and gas company.

    28. In early 2021, the Colonial Pipeline had to pay a $4.4 million ransom to get control of its pipeline network back from the hackers.

    (Bloomberg)

    The attacks on the infrastructure are one of the many types of cyber warfare. This ransomware attack was conducted by a Russian hacker group called DarkSide, and it lasted six days – until the ransom was paid. It led to fuel shortages across the East Coast and sent shockwaves across the industry, primarily because of the way it was done. 

    It wasn’t a sophisticated attack that you would expect when a company of this caliber is involved. Namely, the hackers used login credentials they found on the Dark Web. Even though the person using them was no longer a company employee, his account wasn’t shut down. This attack can easily be filed under the category of cyberterrorism, as statistics show that millions of people and thousands of companies were left for days without fuel.

    Conclusion

    The reality of the world we live in is that it’s all connected. We enjoy the benefits of being connected all the time, but there are also dangers we aren’t actually prepared for. Many of the attacks could have been prevented if simple cyber hygiene rules had been followed. 

    Unfortunately, as we saw in the article, some vital organizations fail to follow them. It’s incredible how a simple oversight can have such dramatic consequences.

    The latest cyber warfare data shows that you no longer need ICBMs to reach and hurt countries across the globe. And if you want to steal your competitor’s secrets and research, there is no need to send a person to their HQ and make them go through laser beams and retina scans. All you need to do is to hack their account.

    A simple code can achieve more in a split of a second than thousands of pieces of hardware could in years. So in a sense, it’s proven once more that the pen is mightier than the sword.

    People Also Ask

    How common is cyber warfare?

    Cyber warfare is a cheap, easy, and effective way for a country to reach its goals. That’s why more and more countries are turning to this way of waging war. Although it’s not in plain sight and we can’t see airplanes and tanks, the battlefield is global and constantly active.
    For instance, the US Federal Agencies registered 30,819 cybersecurity incidents in 2020. China, which has the highest rate of DDoS attacks globally, reports more than 800 million DDoS attacks per day, and 24 million of them originate from foreign countries.

    How many cyber attacks were there in 2020?

    Many cyberattacks go unnoticed, and successful data breaches are sometimes discovered after months and even years. That’s why keeping track of cyberattacks is challenging. But according to the latest data, US agencies had registered 30,819 cybersecurity incidents in 2020, which is approximately 84 per day or one every 17 minutes. Chinese agencies report even higher numbers – 800 million DDoS attacks per day.

    What are the five major impacts of cyber warfare?

    Cyberattacks have a much more significant effect on our lives than we think. The most significant impacts are:
    – Financial – Cyberattacks cause massive financial damages, both short-term and long-term.
    – Consumer mistrust – Businesses and organizations lose credibility and reputation.
    – Psychological effects – Because we are all connected, and the attack can happen without any warning, it instills a sense of insecurity.
    – Widespread disruption – Attacks on organizations that provide utility or other essential services can completely disrupt a country’s economy and the everyday life of its residents.

    How often do cyberattacks occur in 2021?

    In the first half of 2021, McAfee counted 668 threats per minute on average. The company also discovered more than 2.3 million new malware threats during the first quarter of 2021 alone. The other data that illustrates the situation in cyberspace comes from Microsoft Azure. The company stated that the average number of DDoS attacks in 2021 is 1,392 per day. This is a 25% increase from last year.

    Is cyber warfare a serious problem?

    Yes, cyber warfare is a serious problem, and it is very likely to become one of the most significant global problems in the future. There are no boundaries, no frontline, and anyone can be attacked anywhere. It is a cheap and effective way to hurt your opponent and steal money along the way.
    The latest data show that the countries are stockpiling cyber warfare tools and information, with 10% to 15% of the information on the dark web being purchased by agents presumed to work for different countries.

    What is the future of cyber warfare?

    The line between financially motivated cyberattacks and cyber warfare is blurry. There was a 100% increase in state-sponsored major cyberattacks between 2017 and 2020. In addition, attacks on infrastructure are no longer taboo—the attack on the Ukrainian power grid in 2015, the Colonial Pipeline ransomware attack, and the prevented attack on California’s leading water supplier in 2021 are the best proof.
    However, experts believe that the latest cyber warfare statistics imply that the line has to be drawn somewhere. They believe we may soon witness a cyber peace conference, where some basic rules of engagement will be established.

  • 16 Devastating Medicare Fraud Statistics: How Bad Is It?

    16 Devastating Medicare Fraud Statistics: How Bad Is It?

    Medicare fraud statistics show that billions of dollars are wasted every year due to scams and corruption. The damage to the entire healthcare system is irreparable, as that money could have been invested in a range of legal medical services.

    Enormous expenses of fraudulent practices result in Medicare costs escalation. These scams also increase the risks of harming patients who undergo a range of unnecessary procedures. 

    Medicare fraud includes intentionally covering up the truth with the aim of obtaining illegitimate benefits. Paired with abuse, which involves practices that don’t adhere to authorized fiscal and medical practices to increase expenses, healthcare scams severely harm both the state and the federal medical system.

    Latest Medicare Stats and Facts (Editor’s Picks)

    • 18.1% of people in the US have Medicare
    • In 2020, the Medicare improper payment rate was 6.27%
    • Medicare spends almost $700 billion on its services
    • Due to a single fraud, Medicare lost $2 billion 
    • In 2028, the US healthcare expenditures are projected to reach 6.2 trillion
    • By investigating inaccurate payments, Medicare could have saved $367 million 
    • In 2028, Medicare expenditures are forecast to reach $1.5 trillion

    Medicare Fraud Stats

    According to federal law, frauds are recognized as criminal acts. They don’t harm only the organization they are targeted at. They may have a much wider impact and harm the entire industry or system, and therefore its direct and indirect beneficiaries. In terms of healthcare fraud, users and taxpayers bear the highest costs, according to healthcare fraud statistics.

    1. The Medicare program spends nearly $700 billion on its services. 

    (Politifact)

    The primary beneficiaries of Medicare services are people 65 years of age and older. The program also serves millions of disabled US citizens. Namely, almost $700 billion is spent every year on Medicare services, while the Medicare fraud estimates put the cost off fraudulent activities at around 7% of that sum. The program itself makes payments to 1 million entities.

    Medicare Fraud - 1

    2. 18.4% of Americans had some form of Medicare in 2020.

    (Statista)

    In 2019, over 18% of US residents were covered by its programs, accounting for almost 60 million people.

    Medicare includes four major parts, with the first offering hospital coverage and the second medical coverage. The third provides an optional way to obtain Medicare benefits, whereas the fourth offers medicine prescription coverage. Medicare fraud stats suggest that all parts of the insurance scheme are vulnerable to scams and abuse, with roughly 3–4% of insurance claims being fraudulent.

    3. Medicaid has an improper payment rate of 14.90%.

    (CMS)

    Inconsistencies in payments may not necessarily mean fraud or abuse, but do indicate a human error. The Medicare fraud rate shows that the program has the highest improper payment rate among its peers, at nearly 15%. In cash, this amounts to $57.36 billion. 

    Medicare FFS has an improper payment rate of 7.25% ($28.91 billion), Medicare Part B of 7.87% ($16.73 billion), and CHIP of 15.83% ($2.74 billion). Medicare Part D has the lowest rate of only 0.75% which amounts to $0.61 billion.

    4. The rate of Medicare FFS improper payments was 6.27% in 2020. 

    (CMS)

    That translated to almost $26 billion in improper payments. In 2019, the improper payment rate was 7.25%, leading to $28.91 billion in improper payments. In such cases, a health insurance fraud investigation process is required.

    5. US doctors believe overtreatment is common, with 20.6% of procedures being obsolete.

    (Pacific Prime)

    Healthcare fraud and abuse statistics indicate that doctors deem more than a fifth of all prescribed procedures, tests, and medications unnecessary. Nearly 85% of doctors believe the main reason for overtreatment is a fear of being sued for malpractice. However, around 70% of physicians believe their colleagues are more likely to do unnecessary procedures when they can gain profit from it. 

    Medicare Fraud - 2

    6. Healthcare fraud may result in 10-year imprisonment. 

    (Oberheiden P.C.)

    According to the federal law on medical frauds, a common offense carries a prison sentence of up to 10 years. In the case that there was a bodily injury involved, the sentence increases to up to 20 years. Should the fraud result in death, life imprisonment is an option. 

    False claims typically result in criminal or civil penalties. The former requires hundreds of thousands of dollars to be paid, whereas the latter involves paying a fee of $21,000 per false claim.  

    How does fraud and abuse impact the costs of healthcare?

    7. Medicare fraud costs insurers $50 billion annually.  

    (Politifact)

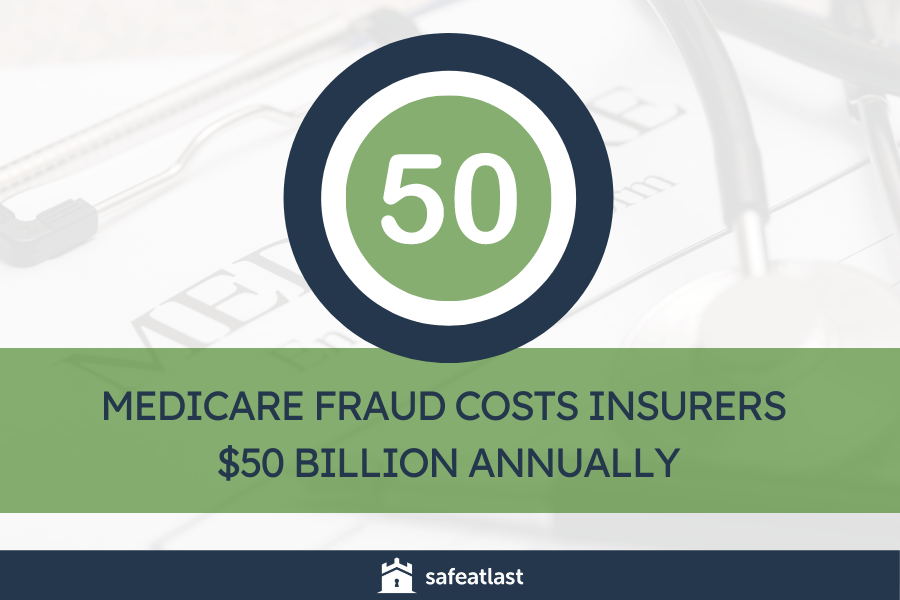
    Scams are extremely expensive. An inconceivable amount of cash is wasted, without any alternative to rebound it. Medicare fraud costs are estimated at a whopping $50 billion a year. In other words, this is $1 billion per week spent.

    Medicare Fraud - 3

    8. The US lost $487 billion due to scams and human error.

    (Gray Matter Analytics) 

    The Coalition Against Insurance Fraud estimates that medical frauds, as well as human error, cost America $487 billion annually. This figure makes up about 10% of the overall healthcare expenditure. In addition, the Medicaid error rate was about 9.8% with total spending of $300 billion in 2015. That’s a pretty huge amount of money lost to scams and human error.

    9. Medicare programs lost $2 billion to just 1 fraud.

    (Gray Matter Analytics)

    Two years ago, 600 fraudsters (the majority of whom were healthcare workers) across 58 federal districts participated in a historical multi-agency scam. The scheme was focused on the distribution of opioids and other hazardous drugs. This Medicare fraud cost its crucial programs a colossal $2 billion. 

    10. Medicare could spare $367 million by checking improper payments. 

    (Health Payer Intelligence)

    Medicare fraud waste and abuse statistics allege that 61% of Medicare payments for outpatient treatment claims were inadequately filed. Research showed that out of 300 sample claims, only 116 were filed correctly. Such an error cost the insurer almost $367 million. 

    11. Medicare spent $160.8 million on medications covered by hospices. 

    (Health Payer Intelligence)

    The authorities discovered yet another instance of healthcare fraud and abuse with Medicare. Namely, Centers for Medicare and Medicaid Services paid over $160 million on medications for Medicare Advantage. The issue here is that hospices already cover those drugs. 

    12. In 2020, America spent $4.1 trillion on medical care.   

    (CMS)

    That equated to $12,350 worth of costs per person. A great deal of the sum the US invests in health care is often used to compensate for health insurance claims. But, medicare fraud and abuse statistics suggest that there is a high number of fraudulent claims. 

    As false claims, frauds, and abuse may cost up to $300 million, one can’t help but conclude that such false claims are highly expensive, regardless of the fact they might make up only a small portion. 

    13. The US government spendings on healthcare will be $6.2 trillion in 2028.

    (CMS, Tax Policy Center)

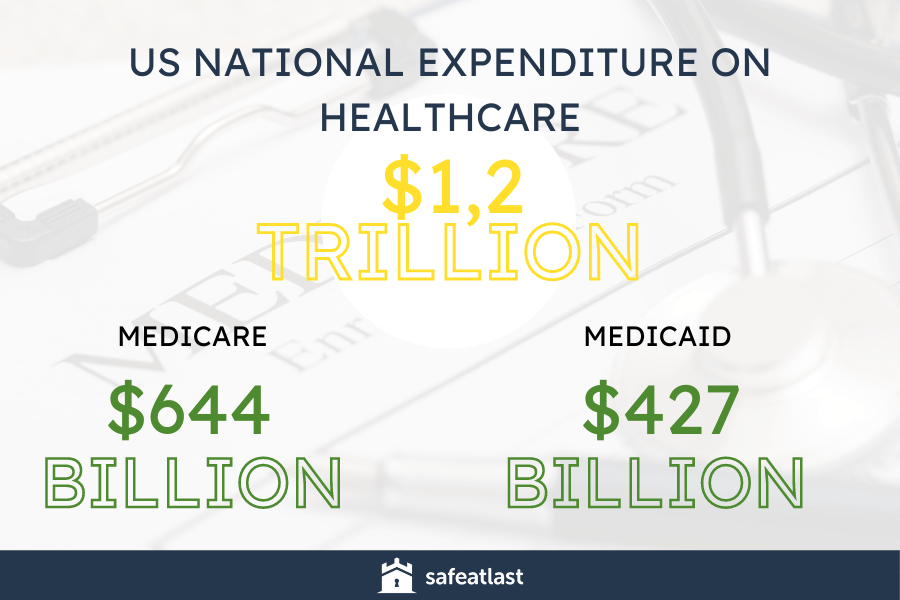
    National expenditure on healthcare amounted to $1.2 trillion in 2019. Out of that amount, $644 billion and $427 billion were assigned to Medicare and Medicaid & the Children’s Health Insurance Program, respectively. 

    In 2028, the national spendings are expected to reach a whopping $6.2 trillion, so the cost of Medicare fraud shouldn’t be discounted.   

    Medicare Fraud - 4

    14. Fraud and abuse comprise between 3% and 10% of total healthcare spendings. 

    (NHCAA)

    The National Healthcare Anti-Fraud Association estimates that health care scams incur billions of dollars of losses every year, as much as 10% of annual healthcare spendings. In figures, this can equal to over $300 billion every year. This can lead to higher premiums, reduced benefits, and out-of-pocket costs for clients.

    15. Around $1.4 billion was given back to Medicare Trust Funds.

    (GAO)

    Medical fraud statistics reveal that the Office of Inspector General at HHS and the US Department of Justice managed to return nearly $1.4 billion to Medicare Trust funds via fines, forfeits, and recoveries. These departments actively fight healthcare and insurance frauds and prosecute perpetrators.

    16. Medicare costs are expected to rise to $1.5 trillion in 2028.

    (GAO, CMS)

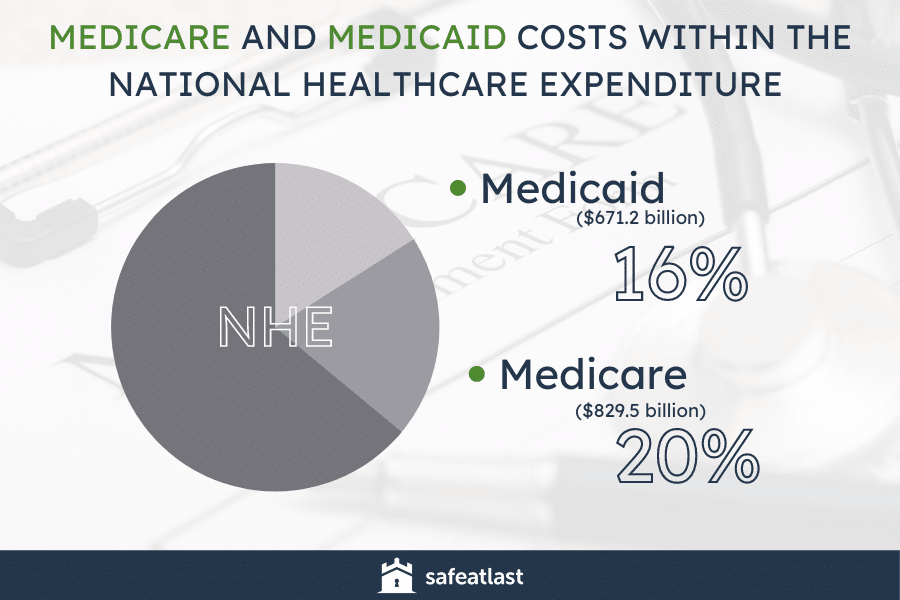
    In 2020, Medicare expenditure amounted to $829.5 billion, which stands for 20% of the national healthcare expenditure (NHE). Medicaid accounted for 16% of the overall NHE, or $671.2 billion. 

    As for Medicare fraud trends, these expenditures are bound to reach $1.5 trillion by 2028, i.e., 5.1% of GDP and 21.9% of federal spendings.

    Medicare Fraud - 5

    The Bottom Line: How Much Fraud Is There in Medicare

    Medicare covers around 60 million people in the US, which accounts for over 18% of the population. The program is funded by users’ premiums, payroll tax, and general revenues, so the Medicare fraud numbers are nothing to be scoffed at. Considering the fact that the US investments in healthcare increase annually — from $3.6 trillion in 2018 to an estimated $6.2 trillion in 2028 — it’s not surprising that the medical system is an easy target for fraud, waste, and abuse.

    On a yearly basis, Medicare spends nearly $700 on its services. Taking that colossal amount into consideration, it doesn’t come as a surprise that it’s a favorite target for frauds and abuse. As Medicare fraud statistics unveil, it loses $50-$60 billion dollars every year to scams and false claims. What’s more, in only one multi-agency fraud, it lost $2 billion. 

    However, such frauds aren’t treated lightly. An array of law enforcement agencies collaborate with the FBI on investigating medical frauds. The punishments vary from a fee to a prison sentence, depending on the level of involvement in the final outcome.

    People Also Ask

    What are the common types of Medicare fraud?

    There are numerous scams and frauds concerning Medicare that are wasting client and taxpayer money. Major categories of healthcare fraud and abuse include deeds such as:
    – Submitting claims for services that patients never underwent or received
    – Falsifying diagnoses and claims
    – Offering free services, goods, or any other reimbursement to get others’ Medicare number
    – Billing Medicare for equipment or supplies that are never received
    – Using somebody else’s Medicare number or card
    – Offering a patient a Medicare medication plan that is not approved
    – Giving false information to a patient in order to sign them up for a Medicare plan
    – Taking part in unlawful kickback or referrals
    – Prescribing unneeded drugs
    – Upcoding for pricey and unwarranted services

    Who commits the most Medicare fraud?

    Perpetrators may vary, from large corporations and organizations created just to commit fraud to patients and individual providers. However, the most frequent participants and offenders include medical providers who tend to submit claims for unnecessary or unprovided services, Medicare fraud and abuse statistics show.
    Suppliers are also among frequent perpetrators, as they may choose to bill items or equipment they don’t provide. Companies, especially non-healthcare ones, may give unapproved plans or mislead prospective clients to join them. Lastly, beneficiaries can also commit fraud by allowing third-parties to use their Medicare card or giving their ID number for money or other incentives, Medical fraud stats indicate.

    What is considered Medicare fraud?

    A Medicare fraud happens when individuals intentionally deceive Medicare to get paid when they are not supposed to. Also, they may go in for a higher payment compared to the one they should receive. Anyone can participate in or commit a fraud — physicians or any other medical staff, suppliers, and Medicare clients. It’s essential to note that such fraud is illegal and will be prosecuted. Additionally, it’s important to note the high cost of Medicare fraud and abuse, which is a burden on taxpayers.

    Who investigates Medicare fraud?

    The FBI is the central law enforcement agency responsible for exposing any kind of healthcare fraud. It has jurisdiction over both federal and private insurance programs. Medical fraud and abuse are regarded as a top priority within the Complex Financial Crime Program. Therefore, every of the Bureau’s offices employs staff whose assignment is to investigate medical fraud and abuse cases, so as to lower Medicare fraud rates.
    The FBI collaborating with other agencies as well, such as the Office of Inspector General at Health and Human Services (HHS OIG), the FDA and the DEA, the Defense Criminal Investigative Service (DCIS), and the Internal Revenue Service-Criminal Investigation (IRS-CI). Medicaid Fraud Control Units from other states and state and local law enforcement agencies are also included.

    What are the penalties for Medicare fraud?

    Federal agencies may charge civil or criminal penalties. In general, civil cases include unintentional fraud allegations. On the other hand, criminal cases demand evidence that the perpetrator intentionally filed a fraudulent claim for Medicare compensation.
    Civil penalties involve paying a fine amounting to $21,000 per a fraudulent claim, reimbursement for overbilled amounts, and treble damages. Criminal cases require paying a fine amounting to hundreds of thousands of dollars, and carry a prison sentence of between 5 and 20 years, and can sometimes even include a lifetime prison sentence.

    How much Medicare fraud is present in the United States?

    Taking into account the money lost to fraud and abuse (over $50 million a year), as well as millions lost to improper payments, while the exact Medicare fraud amount is hard to determine, it could be concluded that Medicare fraud is relatively frequent. Not all scam instances are intentional, though — some are committed unknowingly.

    What is the difference between Medicare fraud and abuse?

    Medicare fraud involves intentional and calculated deception or misstating of services an individual is aware of are false. Such a case may result in additional and illegal remuneration or payments to a practice.
    Medicare abuse is regarded as a lesser offense that happens when medical offices do not adhere to correct coding and billing regulations and guidelines. Generally, abuse refers to matters or practices that don’t comply with established healthcare, business, or fiscal procedures.
    According to Medicare fraud statistics, fraud can also involve identity theft in some cases, whereas abuse generally does not.

  • Safest Cities in Missouri

    Safest Cities in Missouri

    With beautiful mountains and the perfect balance between urban and rural landscapes, Missouri offers something for everyone. If you’re considering moving to this state, knowing a list of the safest cities in Missouri will help you choose a perfect place that’s both safe and what you want out of life. Find our rankings of the most popular cities in the state and the places with the highest crime rates. 

    About Missouri

    Missouri lies in the Midwestern region of the United States and has 6,154,913 residents. It borders eight states: Nebraska, Kansas, Oklahoma, Arkansas, Tennessee, Kentucky, Illinois, and Iowa. Along with some of the best cities in Missouri, the south portion of the state is enriched with the Ozark Mountains, which bring minerals, timber, and many fun activities. 

    Missouri gained its name after the Missouri river. When French settlers came to the area, they decided to name the river by a group of indigenous people who populated that portion of the land. Economically, Missouri has a unique blend of urban and rural landscapes, creating a balance between high levels of industrial activity, and agricultural and farming. 

    Is Missouri a Dangerous Place to Live?

    The average crime rate in Missouri is 3,134 per 100,000 people, ranking above the national average. Notably, Missouri is more dangerous than most other states, ranking eighth for violent crime.

    The explanation for this crime rate isn’t all just interpretations about economic status, as the median household income in Missouri sits at $55,461, and the per capita earnings amount to $30,810. Almost 13% of residents live in poverty.

    Safest Cities in Missouri for 2022

    Francis Quadrangle - Missouri

    1. Cottleville

    Cottleville is a city in Missouri that is part of St. Charles County, and it has a population of 5,611 residents. 

    Cottleville was founded in 1798, but the actual site wasn’t laid out until 1839. It was named in honor of Captain Lorenzo Cottle, an early settler and a veteran of the Seminole Wars and the Black Hawk War. In 1843, residents built a post office, which attracted more people to the area.

    Even though it’s pretty small, Cottleville is among the best cities in Missouri for families. The town boasts excellent schools, such as the Francis Howell Central High School, Louis C. Saeger Middle School, and Warren Elementary School, and the children of Cottleville also attend St. Joseph Catholic School.

    Residents of Cottleville enjoy a high quality of living. The median household income in the city is above the Missouri average, sitting at $108,036, and the per capita earnings amount to $51,118. Only 4.2% of residents live in poverty.

    The official data shows that Cottleville is the safest city in Missouri. Its crime rate is only 701 per 100,000 residents, and law enforcement reported five violent and 36 property crimes in 2019.

    If you’re interested in moving to this city, you should know that the median gross rent is $1,241, and the median house price sits at $354,200.

    2. Savannah

    Savannah is the county seat of Andrew County and is among the smaller cities in Missouri, with a population of only 5,069 residents.

    Those wondering what city in Missouri has the lowest crime rate should look into Savannah as its crime rate is only 844 offenses per 100,000 residents. In 2019, law enforcement filed reports for 43 property crimes and one violent offense.

    Savannah was founded in 1841, and it gained its name in honor of the child of the first settler, Savannah Woods. The city came to life after the residents opened a post office in the area. About 50 years later, in 1898, Andrew County Courthouse was built in Savannah, and the courthouse became a part of the National Register of Historic Places in 1980.

    While it’s one of the safest towns, Savannah is not among the best cities to live in Missouri if you’re looking for a high salary. The median household income is $49,042, and the per capita earnings sit at $24,949. Still, the percentage of residents living in poverty is below the state average at 9.2%, indicating a balance in the potential earnings and cost of living. 

    The median house price in Savannah is $165,900, and the median gross rent is below the average for Missouri, at $753.

    3. Glendale

    Glendale belongs to St. Louis County of Missouri. The latest official data shows that the city has 6,176 residents, and it is a perfect place of residence for everyone Googling “what is the safest small town in Missouri” trying to find a secure and small community to relocate to.

    The city gained its name after a small station on the Missouri Pacific Railroad. First, residents came to the town during the Civil War, then after a few failed attempts, Glendale officially became a city of Missouri in 1916. Today, Glendale is a planned community mostly restricted to one-family units. That’s why various publications named the city the best place to live in Missouri.

    Another reason to move to Glendale is high income. The median household earnings in the city are $140,184, and the per capita income is above the state average, at $61,806. Less than 4% of residents live in poverty, but higher earnings seemingly come with more expensive properties. The median house cost in Glendale is $446,200, and the median rent is also high, at $1,407.

    It’s safe to say that properties are well worth the price as Glendale is one of the safest cities in Missouri. Its crime rate is 988 per 100,000 people, and in 2019, residents reported 57 property offenses and only one violent crime.

    4. Odessa

    Odessa belongs to the Lafayette County of Missouri. It’s a city near Kansas, which makes it part of the Kansas City Metro Area, and it currently has 5,593 residents.

    The city was founded in 1878, and the name was inspired by one of the most populated cities in Ukraine. After the post office opened, Odessa became home to many new residents. Still, the population increase wasn’t significant and it remains one of the smallest but safest places to live in Missouri.

    Among the prominent buildings in this city is the Odessa Ice Cream Company Building. It’s a commercial real estate and an ice cream factory built in 1929. It’s a historical clay block and brick building, and in 1996, it was listed on the National Register of Historic Places.

    The residents of Odessa earn below the Missouri average, with a median household income of $52,684 and a per capita income of $24,988. A large number of people live in poverty at 13.2%, but it is one of the best towns to live in Missouri for affordable housing. The median house price is $159,800, and the median gross rent is $721.

    Odessa is among the safest towns in the state, with a crime rate of 1,002 per 100,000 residents, and there were 43 property and nine violent crimes in the city in 2019.

    5. Nixa

    Nixa is the principal city of the Springfield, Missouri Metro Area. It’s the second-largest city in the area, with a population of 23,257, and is part of Christian County.

    The Nixa, Missouri, crime rate is 1,070 per 100,000 residents, and in 2019, the police reported a total of 209 property and 29 violent crimes.

    The original population of Nixa consisted of farmers who utilized the wooded streams in the area, and this space was a major crossroad between Springfield and Arkansas. After opening the first post office, the residents named the city Nixa. The first part of the name, “nix,” was chosen because the space was “nothing but a crossroads,” and the residents added the letter “a” after a prominent resident Nicholas A. Inman. 

    Besides being a city with a low crime rate in Missouri, Nixa is also a place with a moderate quality of life. The median household income is $58,402, and per capita earnings sit at $26,825. Approximately 9% of residents live in poverty, and the median home price is $234,700, while the median gross rent amounts to $834.

    6. Kearney

    Kearney belongs to Clay County of Missouri and is part of the Kansas City Metro Area. The latest official data shows that the city has 10,404 residents. The combination of a lower crime rate and higher income potential make Kearney possibly the best place to retire in Missouri.

    Kearney is famous as the birthplace of Jesse James, a famous American outlaw, and every year, the residents hold a festival on the third weekend of September in his name.

    David T. Duncan and W.R. Cave founded Kerney in 1856. Back then, it was a town called Centerville, which encompassed the southeastern part of today’s Kearney. About ten years later, John Lawrence laid out the plan for a new community near Centerville. The community received its name after the president of the Hannibal and Saint Joseph Railroad, Charles E. Kearney. The two towns came together, making the town Kearny which was incorporated in 1869.

    Missouri crime statistics tell us that the crime rate in Kearny sits at only 1,081 offenses per 100,000 people. In 2019, residents reported seven violent crimes and 109 property offenses.

    The median household income in Kearny amounts to $85,561, which is above the average for Missouri, and the per capita earnings are $31,391. Only 2.6% of people live in poverty, although properties are some of the most expensive in the state, with a median gross rent of $1,063, and a median house cost of $311,400.

    7. Battlefield

    If you’ve spent some time Googling “what’s the safest city in Missouri to live in,” then you’ve probably already heard of Battlefield. This city belongs to Greene County of Missouri and is part of the Springfield Metro Area. According to the 2020 census, Battlefield has 5,990 residents.

    Battlefield gained its name because of its proximity to the Battle of Wilson’s Creek. This battle happened in 1861, and it was one of the first larger battles in the American Civil War. When residents opened a post office called Battlefield, many people relocated to the area, and it was incorporated in 1971.

    This city may not be the safest place to live in Missouri, but it’s pretty high on the list. Its crime rate is 1,134 per 100,000 people, and in 2019, the police filed reports for 72 property crimes and zero violent crimes.

    The median household income in Battlefield is below the Missouri average, at $61,373, and the per capita earnings fall slightly below the state average at $27,718. Nearly 8% of residents live in poverty, and the median gross rent is lower than in most other cities in Missouri, at around $773, and the median house price is $212,400.

    8. Smithville

    Smithville is another smaller city and one of the safest places to live in Missouri. It’s part of Platte and Clay counties and belongs to the Kansas City Metro Area. Currently, the city’s population is 10,406 residents.

    Smithville was named after Humphrey “Yankee” Smith, one of the first settlers in the area. In the beginning, the city’s name was “Smith’s Mill,” but over time, the residents changed the name to “Smithville” so it was easier to pronounce. The city is famous for being the birthplace of famous actors Wallace and Noah Beery, Sr. Interesting places to see in Smithville are the Downtown Smithville Historic District and Aker Cemetery.

    According to the Missouri crime map, Smithville is among the safest towns in the state. Its crime rate is 1,181 per 100,000 residents, and in 2019, there were a total of 109 property offenses and 15 violent crimes.

    Residents of this city earn more than most other Missourians. The median household income is $82,398, and the per capita income totals $33,509. Around 6% of residents live in poverty, and rents are below average, with a median gross rent of $799 and a median house price of $297,700.

    9. Maryville

    Maryville is at the top of many lists of the 10 best places to live in Missouri. It is the county seat of Nodaway County and has 10,633 residents. This city is home to Northwest Technical School and Northwest Missouri State University. 

    Maryville was established in 1845 and was named in honor of Amos Graham’s wife. Graham was the town’s first postmaster, and throughout the years, the city was incorporated and annulled several times. The last incorporation came in 1869 after the arrival of the Kansas City, St. Joseph, and Council Bluffs Railroad to the area. Ten years later, Wabash Railroad came to the town, attracting many residents.

    Marville may be one of the safest cities in Missouri in 2020, but if you’re looking for a high-earning position, it may not be the best choice. Residents of this city earn way below the state average, with per capita earnings being $19,215, and the median household income is $34,258. Over 30% of residents live in poverty, which is more than double the state average.

    Still, Maryville is one of the safest places in Missouri. The crime rate in the city is 1,185 offenses per 100,000 residents, and in 2019, law enforcement reported 130 property crimes and eight violent crimes.

    Housing is relatively affordable in Maryville, with a median home price of $162,900 and a median gross rent of $665.

    10. Wentzville

    Wentzville belongs to St. Charles County and is officially a suburb of St. Louis. According to the latest official estimate, the city has 44,372 residents. It’s one of the safest places to live in St. Louis and the fastest growing city in the state. If you want to visit this city, you should do it during two major events: the St. Charles County Fair and the St. Louis Renaissance Festival.

    Wentzville was founded in 1855 and was named after Erasmus Livingston Wentz. He was the chief engineer of the Northern Missouri Railroad. Four years later, the first post office in Wentzville started working, which led to its first population increase. The Wentzville Tobacco Company Factory is a historic site in town and has been on the National Register of Historic Places since 1990. 

    As one of the safest cities in southern Missouri, Wentzville has a crime rate of 1,254 per 100,000 people, and in 2019, residents reported 88 violent and 450 property crimes.

    The residents of Wentzville earn above the state average. The median household income is $90,403, and per capita earnings amount to $34,133. Only 5.6% of people live in poverty, but the cost of living is more expensive than in most other cities, with a median gross rent of $1,009, and a median house price of $304,400.

    Kansas City - Missouri

    11. Clayton

    Clayton is the county seat of St. Louis County of Missouri. It borders St. Louis, contributing to a thriving commuter relationship between cities, and currently, the population of Clayton consists of 17,355 people. 

    The city received its name after Ralph Clayton, a farmer who settled in the area during the 1830s. He donated the land for the town’s courthouse at the center of town, and all of the economic activity was focused on that part of the area. A few years later, a trolley service, newspaper, and school were established.

    Clayton, MO population, enjoys a high quality of living. The median household income is exceptionally high at $107,596, the per capita income is $67,726. Around 8% of residents live in poverty, and the cost of living is equally high, with a median gross rent of $1,249 and a median home price of $766,900.

    Clayton is a pretty safe city. Its crime rate is 1,453 offenses per 100,000 residents and is one of the lowest in the state. In 2019, the police filed reports for 234 property crimes and 12 violent offenses.

    12. Florissant

    Named the best city to live in Missouri by many, Florissant is a smaller city with a lot to offer. It’s part of St. Louis County, and it belongs to the Greater St. Louis Area, and the city currently has 52,533 residents.

    Initially, the Florissant was a village called “Fleurissant,” which is a French word that means “blooming,” and was home to many French and Spanish settlers. The first significant population boom came after World War II, when many big developers such as Alfred H. Mayer Co. started investing in the city, and at one point, Florissant was the largest city in St. Louis County.

    The Florissant, MO crime rate is below the state average, and it sits at 2,326 per 100,000 people. The latest available data shows that there were 1,079 property and 115 violent crimes reported during a year.

    The median household income in Florissant is $54,978, which is close to the state average. The per capita earnings amount to $25,647, and over 11% of residents live in poverty. The median gross rent is above the average for Missouri at $1,034, and the median house cost is $144,700.

    13. Jefferson City

    Among the most populous cities in Missouri, Jefferson City is the capital of Missouri and also the principal municipality of the Jefferson City Metro Area. Its population is 43,228, and it is home to Lincoln University, which was founded in 1866.

    Jefferson City was a pretty insignificant village called “Lohman’s Landing” in Missouri until it became the state’s capital. Most experts believe that the city was chosen as the capital because it’s halfway between St. Louis and Kansas City. 

    Despite its size, Jefferson City doesn’t have a high crime rate. The city’s official crime rate is 2,851 offenses per 100,000 people, which is below the average for Missouri. Missouri crime stats from 2019 show that there were 1,101 property and 119 violent crimes committed in Jefferson City.

    The median household income in Jefferson City is $52,253, which is slightly above the state average, and the per capita earnings amount to $28,073. Nearly 13% of residents live in poverty, and the median house price there is $183,600, and the median gross rent is $634.

    14. Columbia

    Columbia is the county seat of Boone County and the principal municipality of the Columbia Metro Area. It’s among the largest cities in the state, with 126,254 residents, and is home of the University of Missouri.

    The Columbia, MO, crime rate is 2,915 per 100,000 residents which is below the state average, and in 2019, law enforcement reported a total of 401 violent and 3,243 property crimes.

    Earnings of Columbia residents are close to the state average. The per capita income is $30,244, and the median household earnings are $51,276. Almost 22% of people live in poverty, which is almost 10% above the average for Missouri. The median gross rent is similar to the state average at $887, and the median house cost is $229,500.

    Columbia is technically a Midwestern college town. The safest neighborhoods in Columbia, MO that are a popular choice for new residents are McBaine & Pierpont, Huntsdale, and Harg & Shaw. Besides the University of Missouri, the “Athens of Missouri” is also the home of Stephens College and Columbia College.

    15. Hazelwood

    Hazelwood belongs to St. Louis County and is part of the Greater St. Louis Area. According to the latest official estimates, this city has 25,458 residents. Hazelwood is close to the St. Louis-Lambert International Airport and connected to the rest of the country via the interstate. While it doesn’t have the lowest crime rates, it hosts some of the safe neighborhoods in St. Louis.

    The first explorers in the area were French, and they came to Hazelwood in the late 1600s. At first, the city’s name was Louisiana after King Louis XIV. The French later sold the land to Spain in the 1700s, and after that, settlers from Charlottesville and Virginia populated the area. 

    Hazelwood residents earn slightly above the state average, with a median household income of $54,573 and per capita earnings of $31,689. Around 11% of residents live in poverty. Rents are similar to the average for Missouri, with a median gross rent of $884and a median house price of $136,900.

    The Hazelwood, MO, crime rate sits at 3,213 per 100,000 residents, and in 2019, the police reported 113 violent and 695 property crimes.

    16. Raytown

    Raytown is part of Jackson County of Missouri, and it’s a suburb of Kansas City. The latest official data shows that the city has 30,012 residents.

    Residents of Raytown earn close to the state average, and the median household income sits at $52,662, with per capita earnings of $27,576. Around 12% of residents live in poverty, which is below the Missouri average, and the median gross rent is $916, while the median house price sits at $168,200. As one of the good places to live in Missouri, Raytown has a moderate standard of living. 

    The area around Raytown wasn’t developed until the late 19th century when pioneers on the Three Trails found a bit of fertile land and water in the area. The travelers who found it claimed that nature reminded them of the Blue Ridge Mountains, which is why Raytown’s original name was Blue Ridge. In the 1840s, William Ray opened a blacksmith shop that attracted new residents, and the area around the shop was known as “Ray Town,” which is how the town’s name came to be.

    Today, the Raytown, MO, crime rate is higher than in most other cities in Missouri. It amounts to 5,164 per 100,000 people, and in 2019, residents reported a total of 200 violent and 1,294 property crimes.

    17. Kansas City

    Kansas City is the largest city in Missouri and the principal municipality of the Kansas City Metro Area. It mostly lies within Jackson County, but parts of it belong to Clay, Cass, and Platte counties. The city is also the most populated one in the state, and it has 508,090 residents. 

    The Kansas City, Missouri crime rate is 5,287 per 100,000 people, which is way above the state average. In 2019, the residents of Kansas City committed 19,124 property offenses and 7,099 violent crimes.

    In 1830, Kansas City was a vital port on the Missouri River, was incorporated in 1850, and officially became a city of Missouri in 1853. The town quickly attracted residents due to its location in between Missouri and Kansas, and the proximity of the Missouri and Kansas River made it a great place for settlements.

    Today you can hear Kansas City as the answer to, “where should you not live in Missouri?” Besides the high crime rate, the quality of living is relatively low, with over 16% of residents living in poverty. The median household income is $54,194, and the per capita earnings are $32,348. While residents of the city don’t earn above the state average, the median gross rent is higher than in most other cities at $941, and the median house price is $195,300.

    18. St. Louis

    St. Louis is among the largest cities in Missouri, with 301,578 residents. It’s the principal city of the Greater St. Louis Metro Area, which extends over two states: Missouri and Illinois.

    The St. Louis, MO crime rate is extremely high, which makes it one of the worst cities to live in. Still, its diverse economy offers many options, with Nine Fortune 500 companies housed there. The Federal Reserve Bank of St. Louis and the U.S. Department of Agriculture are also located in this city.

    St. Louis used to be a vital port on the Mississippi River, and in 1877, it separated from St. Louis County and became an independent city. During the 20th century, it was a world-class city and the host of the Summer Olympics.

    Besides safety, this city isn’t among the best places in Missouri to live because of its low-income potential. The median household income in St. Louis is $43,896, and the per capita earnings are $30,542. More than 21% of people live in poverty, which is way above average. The average rent in St. Louis is $828, and the median house price is $155,200.

    The crime rate is 8,111 per 100,000 residents, and in 2019, the police reported 5,792 violent and 18,582 property crimes. As with any city with a high crime rate, researching the safest neighborhoods in St. Louis will help find a location that’s secure and what you’re looking for. 

    19. Springfield

    Springfield is the county seat of Greene County and the third-largest city in Missouri. The city has 169,176 residents, and it is the principal city of the Springfield Metro Area which encompasses five counties. It’s the home to three major universities: Drury University, Evangel University, and Missouri State University, but you won’t find it on the safest places to live in Springfield, MO list anytime soon.

    While it’s not certain where its name comes from, many believe that Springfield got its name after the city in Massachusetts. There is a famous story about James Wilson, who offered free whiskey to other residents if they voted for the name Springfield. Wilson, who was one of the town’s first residents, was born in Springfield, Massachusetts.

    Springfield is in the top 10 ghetto cities in Missouri. Its crime rate is 9,312 per 100,000 residents, which is three times higher than the state average. In 2019, law enforcement reported a total of 13,188 property crimes and 2,571 violent offenses.

    Residents of Springfield earn less than most other Missourians, with per capita earnings of $23,428, and the median household income is $36,856. Nearly 23% of people live in poverty.

    The Springfield, MO, crime rate, and low earnings make the city unattractive to new residents, especially families. Still, in case you’re interested in moving there, you should know that the median house price is $171,600, and the median gross rent in Springfield is $744.

    20. Branson

    Branson is a smaller but well-known city in Missouri. Most of it belongs to Taney County, and a portion extends into Stone County. It’s a beautiful city in the Ozark Mountains with 12,638 residents. Branson comes with a darkside, though, as it’s also first thought when asked,
    “what is the most dangerous city in Missouri?”

    Even though it’s small, Branson is a popular tourist destination. The city’s main attraction is the collection of entertainment theaters in 76 Country Boulevard. The first famous theatre was opened in 1893, and it was called the Roy Clark Celebrity Theatre, which attracted many country music stars to the city.

    Branson was named after Reuben Branson. He was one of the first residents of the area, and he opened a general store and post office, which brought new residents to the town. Branson’s incorporation came in 1912.

    The Branson, MO, crime rate is the highest in the state at 10,661 offenses per 100,000 residents, and in 2019, the police reported 1,173 property and 73 violent crimes.

    Residents of Branson have lower earnings, with the median household income being $46,319 and a per capita income of $24,285. Around 16% of people live in poverty, and the median gross rent is close to the Missouri average, at $857. The median house cost in Branson is $173,100.

    Conclusion

    Despite its reputation for high crime rates, Missouri has beautiful, safe towns that could be an excellent choice for relocation. The safest cities in Missouri may not be the most exciting, but there are many smaller jurisdictions that provide the perfect balance between country living and city life. 

    Missouri is full of rich American history, beautiful scenes, and live entertainment that makes living there fun and sustainable. Some areas are definitely better than others for crime, though, so consider it all when looking for your new place to settle down.

  • 20+ Unbelievable Insurance Fraud Statistics You Need to Know

    20+ Unbelievable Insurance Fraud Statistics You Need to Know

    Fraud in insurance may happen at any point, from the second a client’s application is filed all the way up to claims. Insurance fraud statistics estimate that insurers lose a colossal $80 billion to frauds.

    Nowadays, scams and abuse are becoming more frequent and omnipresent. The emergence of new technologies helps insurance fraud evolve, while, at the same time, fraudsters become more imaginative and refined.

    Modern technology and perpetrators’ creativity make it more challenging for experts to uncover fraud. Although insurance companies have anti-fraud units, only a small portion decides to prosecute, which fraudsters readily take advantage of.

    It might not be possible to protect the company, but it doesn’t mean that there shouldn’t be any attempt to prevent fraud. Just like the fraudsters, insurers ought to implement advanced tools and technologies.

     Intriguing Data About Insurance Fraud in the US (Editor’s Pick)

    • Nearly 2% of insurance frauds are prosecuted
    • Every year, insurers earn more than $1 trillion in premiums
    • Insurance costs in the US amount to over $40 billion annually
    • 3%–4% of insurance claims are false
    • 22% of insurers detect prospective fraud by using machine learning
    • When dealing with frauds, 7% of insurers wouldn’t include law enforcement 
    • Medical fraud expenses account for 3% of the total sum invested in healthcare programs
    • Insurers suffer the loss of $1.5 million per fraudulent case

    General Stats and Fact on Types of Insurance Frauds 

    Insurers classify frauds into several major categories: soft and hard, low-tech, and high-tech. Regardless of type, they can occur at any client touchpoint. Soft frauds aren’t typically planned and involve little to no degree of a criminal act.

    Hard frauds, on the other hand, come as a result of a deliberate criminal act. They can be committed by individuals, organizations, and even providers. In terms of legislation, insurance fraud is regarded as a severe criminal offense. 

    1. Insurance fraud costs in America exceed $40 billion every year.

    (Insurance Information Institute)

    FBI insurance fraud statistics estimate that insurance scam costs surpass $40 billion annually. Scams may be carried out by insurance applicants, policyholders, insurers, or third-party claimants at various points in the insurance transactions. Typical scams involve inflating real claims, misinterpreting facts in an application, filing claims for injuries or harm that never happened, and faking accidents. 

    2. International insurers lose $80 million due to fraudulent claims every year.

    (RGA)

    Scams are happening everywhere on the globe. The Coalition Against Insurance Fraud assesses the overall cost of insurance fraud at $80 billion, though the actual amounts might be even higher. The modern technology era helps advance scams and makes it easier for fraudsters to commit crimes. Besides, they have become much subtler, preventing experts from unveiling them on time. 

    3. Less than 2% of scams end in prosecution.

    (RGA)

    What drives scammers to pursue this type of crime is the fact that insurers are unwilling to prosecute offenders. According to insurance fraud in the US stats, only a tiny portion — not even 2% — of frauds are prosecuted. The reasons for avoiding prosecution include high trial expenses and unpredictable outcomes. But even though it might be costly and demanding, the prosecution may serve as a plausible threat and thus deter fraudsters.

    4. Between 3% and 4% of insurance claims are fraudulent.

    (RGA, The Balance)

    At the global level, approximately 1 in 30 claims is false. Such a figure further indicates that between 3% and 4% of insurance claims are fake. The most typical insurance frauds examples include health insurance scams, car insurance frauds, life insurance frauds, false thefts, and faked deaths.

    Some fraudsters even commit identity theft, which had risen by 16.7M in 2017.

    5. Insurance scams cost US families between $400 and $700 in premium expenses annually. 

    (TransUnion)

    The insurance industry represents a collection of over 7,000 companies that gain quite a fat profit on an annual basis. However, it is among the most vulnerable sectors in terms of scams. Namely, every year, insurance scams impose expenses on US families amounting to between $400 and $700 in premium costs. 

    6. Healthcare scam costs make up around 3% of national funds invested in healthcare programs.

    (BCBSM) 

    With trillions of dollars invested in the healthcare system annually, this sector is an easy target for scams. Health insurance fraud statistics show that this type of fraud, along with unnecessary medical tests or procedures, is yet another type of most frequent scams.

    To add to that, the total expenses of healthcare scams amount to $68 billion every year, according to medical insurance fraud statistics. It is the entire nation that bears those costs as they comprise nearly 3% of the government’s $2.26 trillion of investments in healthcare. What’s more, some experts estimate that the scam costs are even higher, reaching 10%, which is $230 billion of national taxpayers’ cash.

    7. Medicare scam costs are estimated at $50 billion per year. 

    (Politifact)

    This federal health insurer is a frequent victim of scams and abuse. As Medicare fraud stats denote, the insurer loses at least $50 billion dollars to false claims, frauds, and abuse every year. Considering the fact that the US government assigns over $700 billion to Medicare every year, these costs may not seem that massive. Unfortunately, they are repaid from the taxpayers’ pockets.

    8. Two executives were imprisoned due to participation in fraud. 

    (Constantine Cannon)

    Private health insurance isn’t immune to scams either. Namely, private health insurance fraud statistics recorded a case in which two Primera Medical Group executives were involved. The duo submitted fraudulent invoices worth over $8.5 million to private insurance companies. They filed allergy testing and immunotherapy procedures that were unnecessary and were never carried out. The former executives were charged with fraud and sentenced to prison. 

    9. The US government regained more than $2.2 billion from false claims in 2020.

    (US Department of Justice)

    More specifically, health insurance frauds cases accounted for more than $1.8 billion. The best example that the False Claims Act is applicable and of great importance to the US is the fact that over 30 states have established state versions of it. 

    Since it was signed into law, the False Claims Act has turned into the most successful anti-fraud act in the US. 

    10. 7% of insurers refuse to engage law enforcement.

    (RGA)

    Insurance fraud statistics suggest that insurers aren’t quite willing to involve law enforcement agencies when dealing with scams. Only 1 out of 3 agents would contact legal authorities, whereas 7% would refuse to report the fraud. This could be the reason why there is only 1.7% of successful prosecutions of identified scams. The great majority of those cases are related to health and living benefits. 

    Conversely, 33.3% of insurers stated they would always report the fraud, whereas 59.7% would hesitate to do so.

    Insurance Fraud Statistics (1)

    Insurance Fraud Statistics Involving Monetary Loss & Gain

    11. Insurance companies lose $1.5 million per fraudulent case.

     (Linkedin, Spivey Insurance Group)

    Every year, insurance organizations lose 5% of their revenue to the most common fraud cases. Translated into cash, this percentage amounts to a whopping $1.5 million per case. The figures further show that a median loss per case is $125,000. 

    Here are the top 10 insurance frauds:

    1. Minor vehicle damage scams
    2. Premeditated home fires
    3. False thefts
    4. False stolen vehicle claims
    5. Car accident frauds
    6. Natural disaster damage scams
    7. Health insurance frauds
    8. Unnecessary medical testing and procedures
    9. Renter’s insurance scam
    10. Faked death

    12. Insurance organizations earn over $1 trillion in premiums every year.

    (TransUnion)

    The whole insurance industry, consisting of over 7,000 organizations, gains a handsome profit of more than $1 trillion annually. Taking into account the vast amounts of cash circulating through the sector, it’s no wonder why the national rate of insurance fraud is continually increasing. It’s the second-favorite target of fraudsters, immediately after banking. 

    13. The size of the international insurance scam detection market may rise to $7.9 billion by 2024.

    (Globe Newswire)

    The worldwide insurance fraud detection market is predicted to increase from $2.5 to $7.9 billion in 5 years through 2024 at an annual growth rate of 25.8%. Since cyber-attacks on the insurance industry became more sophisticated, they tend to impose huge industry losses. Thus, the need to expand the entire insurance fraud detection market is not surprising. Still, not all organizations seem to be aware of the significance of fraud detection. 

    14. 22% of insurance organizations implement machine learning to fight fraud.

    (RGA)

    New trends in insurance fraud detection reveal that insurers started to implement AI to combat scams. Over 20% of organizations actively use machine learning to determine possible fraud. Such an approach is more frequent in the Asia Pacific region, specifically in markets that have high fraud incidences. Individuals can also protect themselves from identity theft fraud by using the best ID theft protection services on the market. 

    Find out how to deter identity theft.

    15. 48% of companies discovered that their agents participated in frauds.

    (RGA)

    Insurance fraud sometimes requires an “inside job.” Almost half of insurance organizations uncovered instances where their agents participated in scams. Depending on the organization, the percentage of such cases varies from very low to very high. Some reported that only 5% of their agents participated in frauds. Others have totally divergent reports, stating that about 50% of insurers were involved in scams. 

    The participation rate also varies depending on the premium type. Life insurance fraud cases show a low participation ratio of 7%. However, mortality benefits come with the highest occurrence that reaches even 60%.

    16. Car insurance scams may amount to $29 billion annually.

    (Simple Insights)

    Scams are much more expensive than ordinary people may think. The reason is quite simple — car insurance premium users bear the costs of frauds amounting to even $29 billion. In percentage terms, this accounts for 14% of a standard car insurance premium that beneficiaries are supposed to pay, as car insurance fraud stats uncover. 

    Worldwide Insurance Fraud Stats

    17. The average value of a false claim in the UK amounted to ÂŁ12,000 in 2020.

    (ABI)

    The value represented a 6% increase from the year before. 

    However, the number of detected fraudulent claims (96,000) was lower than in the previous 13 years. Moreover, it showed a 10% decrease from 2019. 

    18. Every day during the first half of 2021, fraudsters stole over ÂŁ4 million on average in the UK.

     (BBC)

    The UK seems to be among the countries with the highest rate of insurance fraud. Compared to the first half of 2020, fraud when people are deceived into giving money, and personal details rose by 71%. However, banks refunded less than 50% of the money. 

    All in all, fraudsters had stolen ÂŁ754 million up to June 2021, which was a 30% rise compared to the same period in 2020. 

    The fraudsters were not only organized criminals, but some of them were teenager thieves without previous convictions. On top of that, more than two-thirds of the fraud occurred through online platforms. 

    _Insurance Fraud Statistics #2

    19. Property frauds in the UK fell to 24,000 in 2020.

    (ABI)

    The UK insurance fraud statistics reveal a considerable jump in property frauds. Namely, the number fell by 10% compared to the previous year. Moreover, their value was ÂŁ111 million, dropping 9%. 

    Comparatively, false climbs reached the figure of 27,000 in 2019. The worth of such frauds in cash was ÂŁ124 million, 30% more in figures, and 8% in value compared to the year before. 

    20. Household insurance scams grew by 52% in the UK.

    (This is Money, Spivey Insurance Group)

    Household frauds, specifically home fires, natural disasters, and renter’s scams, are among the most common insurance frauds that scammers try to commit. Across the UK, there has been an increase in insurance scams by 27%, Out of that percentage, more than 50% are household scams. 

    21. In Canada, 5% to 15% of car insurance premiums are used for covering undetermined false claims. 

    (Insurance Institute)

    Taxpayers and insurance premium clients are those who actually cover undetected false claims. In Canada, between 5% and 15% of auto insurance premiums are assigned to covering such claims. This is yet another burden for Ontario drivers, already plagued by high insurance premiums.

    22. Car insurance frauds rose by 45% in the UK.

    (This is Money, Spivey Insurance Group) 

    Another increase is present in auto insurance fraud statistics. Car insurance scams seem to be the next favorite among the UK fraudsters, according to the figures. Such frauds typically include minor damage schemes, false stolen vehicle claims, and car accident frauds.

    The Bottom Line: Is Insurance Scam a Perfect Crime?

    Insurance fraud might be a perfect crime. The risk is minimal, while the reward potential is quite high. Even if the experts manage to detect fraud, the chance to administer punishment or a penalty is quite small. 

    A much better way to combat insurance scams is to prevent them even before they happen. This further implies strengthening portfolios or using machine learning to detect and inspect high-risk policies. Such an approach is bound to give much better results than taking legal actions or pursuing prosecution.

    People Also Ask

    Which insurance company denies the most claims?

    Some companies tend to deny the majority of insurance claims, even though they were valid. They do so in order to enhance their financial balance. They even take quite a strange approach to reward their agents who denied claims successfully. What’s even worse, they dismiss those who wouldn’t comply with those orders so as not to harm the victims. As the final move, they participate in outright scams to bypass paying clams. Those notorious organizations include, but are not limited to, Allstate, AIG, and State Farm.

    How many states make insurance fraud a crime?

    As an offense that happens when a perpetrator tries to deceive an insurance company with the aim of gathering money that doesn’t belong to them, insurance fraud is considered a crime in all 50 US states. In fact, most of the states have founded fraud bureaus whose main task is to detect and inspect scam incidents. In the majority of states, fraudulent claims are regarded as either a felony or a misdemeanor, based on the extent and nature of the committed scam. Specific types like health care frauds are considered crimes under federal law.

    How is insurance fraud dangerous for the economy?

    Insurance scams impact insurance premiums and policyholders to the greatest extent. To recover the money they lose on false claims, insurance organizations have to increase the price of premiums. That way, they pass the expenses of both the fake claim and the combat against the fraud on common policyholders. What’s more, insurance fraud statistics warn that colossal costs of health care scams are paid solely by the US taxpayers’ cash. The same could also be said for welfare fraud cases.