Category: Blog

  • Google Home Statistics That Predict the Landscape of Smart Speakers

    Google Home Statistics That Predict the Landscape of Smart Speakers

    When Google entered the smart speaker market with its Google Home and Google Assistant, few people believed it could make it in the market already dominated by Amazon Alexa. Recent Google Home Statistics proved them wrong. 

    Google is not only hanging on but also increasing its market share. In a growing market, the battle between these fierce competitors is not only about profits but also prestige.

    As consumers, we can only be glad— in an effort to beat the competition, the companies have improved their services to levels unimaginable a couple of years ago.

    Top 8 Fascinating Google Home Statistics (Editor’s Pick)

    • Google holds more than 20% of the global smart speaker market
    • Google Home can work with more than 50,000 smart home devices from more than 10,000 brands
    • There are more than one million actions available for Google Assistant
    • Almost 40% of people use smart speakers for playing music
    • More than 1 billion devices have Google Assistant installed
    • 22% of Americans aged 30 to 44 own a Google Home device
    • Google Home is the only smart speaker to understand 100% of the questions
    • 50 Million Google Home devices were sold worldwide in 2021

    Interesting Facts About Google Home Virtual Assistant

    1. 22% of Americans aged 30 to 44 own a Google Home device.

    (Statista)

    Within the network of appliances, the smart speaker acts as the hub and interface for human control. That’s why it’s one of the most crucial pieces of gear a smart home can have. No wonder, then, that more than one in five adults own a Google Home. 

    But don’t expect to regularly see a Google Home purchase among the 60 and up demographic. It’s fair to predict that devices like these may take a little while to catch on in some age groups.

    2. In a comparative test, Google Home was the only smart speaker to understand 100% of the queries directed at it. 

    (Loup Ventures)

    Google’s AI algorithm that governs speech recognition is clearly unparalleled. Having the only perfect score in “hearing” commands is a clear indication that the Google personal assistant device trumps its competition. 

    Not only that, but there is a sharp difference in “understanding” queries. Google Assistant correctly answered 87.9% of the questions it was asked, while the second highest percentage was achieved by Amazon Alexa at an ostensibly lower 74.6%.

    3. Google holds more than 20% of the global smart speaker market

    (Statista)

    This piece of data shows that Google smart speakers are holding well against the still dominant Amazon Alexa (26.4%). However, this is lower than the results Google Home Assistant had in 2019 – 24.9% of the market. This is due to the rapid expansion of brands like Baidu, Xiaomi, Alibaba, and Apple. They are taking a significant portion of the market and, by the looks of it, have no intention of slowing down.

    4. Google Home can work with more than 50,000 smart home devices from more than 10,000 brands. 

    (Google)

    In order for devices to connect to Google Home Assistant, the apps must be compatible. At the beginning of 2018, Google boasted that their device could pair up with over 1,500 devices. The fact that this number rose to 50,000 in 2022 is a certain testament to how rapidly Google Assistant is growing and developing. 

    5. Almost 40% of people use smart speakers for playing music

    (Statista)

    Hardly surprising since they are speakers before all. But it seems that people are not taking advantage of the smart speakers’ possibilities, as they are used for checking the weather (34%), answering questions (30%), or as glorified alarms and timers (45%). Only about 25% of smart speaker owners use them daily to control other smart devices in their homes.

    How many Google Homes have been sold?

    50 Million Google Home devices were sold worldwide in 2021, and the number is estimated to reach 140 billion by 2025. As we can see, Google is slowly but surely staking its claim on the smart speaker market. 

    It should be noted that there are several households with multiple smart speaker devices. To keep your smart speakers interconnected and to make sure they’re communicating efficiently, you can always make Groups in Google Home. This will help “group” the devices you specifically want working together, increasing effectiveness and making your life easier.

    6. Google Home speakers can understand two languages at once. 

    (Google)

    Google Home became the only smart speaker system that could understand two languages simultaneously. This feature uses LangID technology developed by Google. It’s especially useful for multilingual households, which aren’t exactly rare in the US.

    Google Home statistics continue to show that soon it will be the new king of smart speakers.Yet another benefit that Google’s impressive algorithms provide, this is a big advantage that its competition just cannot achieve.

    7. Google Home generates $3.4 billion in revenue 

    (Voicebot), (Statista)

    This contributed roughly $850 million to Google’s overall gross profit in 2018. After all, the product is pretty easy to find. You can buy Google Home at Target, Walmart, Kroger, and all major retailers.Of course, being readily available is the main factor in product success, but it does help.

    Still, the revenues made from hardware are just a minor part of the company’s total revenue of $256.74 billion in 2021. Most of it comes from advertising.

    8. Google claims there are more than one million actions available for Google Home personal assistant, dwarfing the estimated 30,000 skills available for Amazon Alexa. 

    (Google)

    A single voice command that can be issued to a Google Assistant is called an “action.” These new actions are added by the third-party companies that manufacture the different appliances the system connects to. 

    Google also factors in the searches you can make using their device. If you look at it that way, there is an almost endless number of actions Google Home can complete.

    9. Google Home statistics show that more than two-thirds of requests to the Google Assistant are verbalized in a natural tone—one people would use when talking to a person.

    (Google)

    When we search for something on our phone or laptop browser, we tend to use certain keywords and form sentences and phrases differently from what we do in a normal conversation. 

    However, when speaking with Google Assistant, people address it as if they were speaking with a person. Take a look at this smart home guide and see how you can take advantage of your speaker.

    10. More than 1 billion devices have Google Assistant installed 

    (Google)

    According to Google, its Assistant is featured on more than one billion devices. That is amazing if we consider that there are almost eight billion people on this planet. Experts predict that the number of IoT devices will surpass 75 billion by 2025.

    People Also Ask

    Does Google Home record what it “hears”?

    Google Home only records your voice after you say its triggering keyword. By default, that keyword is “OK Google,” but you can change it to whatever you like. Just make sure it’s not something that you often say when you aren’t speaking to your device. While Google Home may not always be recording, it is constantly listening.

    How efficient is Google Home data usage?

    That all depends on what you use your device for. Some features, like smart thermostats, use very little data.
    However, you need to be wary of features like Cast. Cast sends data packets in 20-second intervals. If left in a standby state for too long, it can send all the packets at once when awakened, which can really damage your data plan. Be sure to disable the Cast feature or reboot your device before you wake it.

    Is Google home always listening?

    Yes, Google Home is always listening, but—and this is an important caveat—it isn’t always recording. Google Home records only when you utter the keyword “OK Google.” When the device “hears” the keyword, it begins recording. It sends the recording up to the cloud and receives instructions back.
    Nevertheless, you should be careful of what personal information Google Assistant gathers from the third party devices connected to your smart home system. You can always delete recordings from the cloud, but Google Home statistics show that hardly anyone has the time and patience to micromanage the information Google and other big companies store about them.

    What percentage of Google searches are voice?

    In 2020, 50% of all searches were voice searches, and the percentage is expected to rise. The number of voice searches compared to regular, typed searches is rapidly moving in favor of the former, according to most voice search statistics.

  • 28 Captivating Teen Driving Statistics

    28 Captivating Teen Driving Statistics

    Teen driving statistics may not seem too bright when observed in general. The number of vehicle crashes involving teens is still relatively high. 

    On the other hand, we would come off as pessimistic if we didn’t notice that, for example, the number of drunk teen driving cases has been on a significant drop over the last thirty or forty years. 

    Along the following lines, we’ll introduce you to the good and the bad when it comes to teen driving. 

    The Top 8 Teen Driving Statistics (Editor’s Choice)

    • Motor vehicle crashes represent the leading cause of teen deaths and disabilities
    • 11 teenagers get killed due to texting and driving annually
    • Over 55% of teenagers confess to talking on the phone while driving
    • On average, drinking and driving is responsible for eight teenager deaths per day 
    • 13% of passenger deaths in 2019 happened while a teenager was driving
    • 31% of male drivers 15–20 who were victims of fatal crashes in 2019 were speeding
    • If accompanied, teenagers are 2.5 times more likely to show risky behavior in traffic 
    • Since 1982, drunk driving fatalities among teens have dropped by 81%

    General Teen Driver Facts 

    As estimated, there are around 15 million teen drivers in the US. That makes 6.7% of the nation’s driving population. Still, even though it is a small percentage compared to the total number of citizens who drive, the number of crashes caused by teen drivers seems to be relatively high. 

    1. The leading cause of teen deaths and disabilities is motor vehicle crashes. 

    (CDC)

    As teenage crash statistics point out, there are five leading teen death causes. The first one is accidents (unwanted injuries); the others are homicide, suicide, cancer, and heart diseases. Still, accidents take up almost half of teen death cases, and the leading cause of accidents is motor vehicle crashes. To put the numbers into perspective, even though homicide takes second place, it causes (only) 13% of all teen deaths in the US. 

    2. There are three main causes of teenage car crashes.

    (Tracking System Direct)

    All teen driving statistics agree upon one thing—the leading cause of teenage car crashes is distracted driving. Besides, it is the main cause of crashes even among adult drivers. The second most frequent crash cause among teens is speeding or going too fast for the particular road conditions. The third is the lack of scanning the road and the surroundings in general. 

    3. 1 in 5 teen drivers has an accident within the first year of driving.

    (Do Something, Southern States Insurance)

    Based on a survey among 16-year olds, teenage driving accident statistics show that teens are most likely to have a crash during the first year of driving. Besides that, teen drivers are ten times more likely to have a vehicle crash in the first year of driving than other age groups, proving that experience on the road truly matters. 

    4. In 2019, 31% of male drivers between the ages of 15 and 20 who were victims of fatal crashes were speeding.

    (CDC)

    According to the stats on teenage driving, 17% of females in the same age group involved in fatal crashes were speeding that year. Generally speaking, teenagers are more prone to speeding and allowing shorter headways. 

    5. Only 44% of teenagers would speak up if someone’s manner of driving scared them.

    (Do Something)

    Teens not feeling confident to talk when they feel endangered by the driver is a serious problem. Add the fact that crash risk increases proportionally when a teenage driver is impaired with another adolescent passenger. Thus, parents should insist on talking to their children and providing full support about speaking out loud when they feel at risk in traffic. Don’t avoid or neglect this kind of conversation—it may save lives. 

    Teen Texting and Driving Statistics

    Texting while driving, and using gadgets in general, can be more dangerous than we think, especially for teenagers, when combined with their lack of experience. 

    6. Every day, 11 teenagers get killed due to texting and driving.

    (Victoria Advocate, edgarsnyder.com)

    This means that texting and driving take around 4000 teenage lives each year. To illustrate the unawareness of the possible dangers, 32.8% of high school students admit texting or emailing while driving.

    7. Texting while driving is directly connected to other types of risky behaviors. 

    (NHTSA)

    Young driver statistics revealed that teenagers who text while driving are more likely to engage in other risky behaviors. For example, they are known to drive under the influence of alcohol and drugs, not wear a seatbelt, drive at nighttime, etc.

    8. 56% of teenagers admit to talking on the phone while driving. 

    (edgarsnyder.com, iii.org)

    Furthermore, 71% of high school seniors use their phones while driving. Besides that, 40% of seniors admit changing music, using their phone (or another device), and driving simultaneously. This is one of the most disturbing teen driver facts, especially if we know that talking while driving lowers the young driver’s reaction as if they were 70 years old. 

    9. Texting and driving are most common among senior white students.

    (CDC)

    Not only is it more common among senior students, but it is also more ordinary among white students who drive—44% of them. Opposite to that, only 30% of Afro-American and 35% of Hispanic students tend to text and drive. 

    Teenagers Drinking and Driving Statistics

    10. On average, eight teenagers lose their lives every day due to drinking and driving. 

    (Gaytravel, edgarsnyder.com)

    This means that annually, around 3,000 US teenagers die in crashes that involve drinking and driving. Additionally, around ¼ of fatalities include a drunk teenage driver. 

    11. 8,2% of high school students admit they were drinking and driving at least once.

    (edgarsnyder.com)

    Up to 8,2% of high school students drove under the influence of alcohol at least once in their lifetime, as teen drunk driving stats reveal. To make it worse, 15.1% of young drivers aged 18 to 20 admit drinking and driving in the past year. 

    12. Almost 60% of drunk teenage drivers involved in fatalities weren’t using a seatbelt.

    (edgarsnyder.com)

    To add to that, 70% of teenagers who lost their lives in accidents that include drinking and driving weren’t using a seatbelt. 

    13. Boys are more likely to drink and drive than girls. 

    (edgarsnyder.com)

    Teenage crash rates point out that 27% of male teen drivers have been a part of a fatal crash involving drinking and driving, compared to 15% female drivers. 

    14. Almost 17% of high school students rode with a drunk driver in the last month.

    (Tracking System Direct)

    Almost 17% of US high school students stated they had been driven at least once in the previous 30 days by a person drinking before operating a vehicle.

    Teen Driving Death Stats

    Even though the US Government and the states individually have introduced a list of laws to lower the number of teen deaths in traffic, unfortunately, they still occur. 

    15. The fatal crash rate is almost three times higher among teenagers.

    (iihs.org) 

    Compared to people aged 20 and over, teenagers are three times more likely to be involved in fatal car crashes. The most endangered age group is from 16 to 17. 

    16. In 2019, 2,375 teenagers lost their lives in motor vehicle crashes. 

    (iihs.org)

    Since this research investigated all motor vehicle crashes combined (not just car crashes), teenagers aged 13 to 19 were a part of the study. Still, these teen driving stats are somewhat bright if we know that the numbers have dropped by 5% compared to the year before. 

    17. 13% of passenger deaths occurred while a teen was driving. 

    (iihs.org)

    Research showed that in 2019, 13% of passenger deaths occurred when the driver was a teenager. The same year, two out of three teens who lost their lives in crashes were male. 

    18. Nighttime and weekend driving are one of the leading causes of teenage fatalities. 

    (DDLawtampa)

    Teen drivers’ statistics expose that more than a half (52% to be precise) of crash deaths involving teenagers happen on Friday and during the weekend. Additionally, 37% of these fatalities occur between 9 pm and 6 am. 

    19. 55% of teens who lost their lives in crashes weren’t using seat belts. 

    (Southern States Insurance)

    More than half of teens who died due to car crashes weren’t using a seatbelt. Different studies have shown that one of the most critical factors of this issue is communication with parents.

    Teenage Road Rage Statistics

    Anyone who ever got a glimpse at child psychology and psychology in general, knows that teenagers express rage more often than the other age groups. Hence, the fact that road rage occurs among teens usually doesn’t come off as a surprise. 

    20. Teenagers are more likely to express dangerous behaviors in traffic.

    (JSF)

    For instance, in 2019, almost 50% of teens in fatal crashes were unbelted in North Carolina, as statistics on teenage driving uncovered. One of the reasons behind these dangerous behaviors might be that teens don’t get good example behavior from their parents. 

    21. Almost 50% of teenage drivers admit to driving under the influence of marijuana.

    (iii.org)

    To be precise, 48,8% percent of them admit to having used marijuana and drove after it, judging by the 2020 study. Nonetheless, this type of behavior is on the rise. For example, the number of teens driving while being high on marijuana is 17% higher than in 2014. To add to that, statistics on teenage drivers show that most of them believe that driving under the influence of marijuana is less dangerous than ingesting alcohol and driving.

    22. 75% of serious teen crashes are due to critical errors. 

    (Safe Ride 4 Kids)

    These errors include lack of scanning to detect and react to dangerous situations, being distracted, and speeding. In fact, over a third of fatal teen crashes involve speeding. 

    Teens are more likely to speed than adults, and they don’t leave a proper amount of distance between them and the vehicle in front.

    23. Teens are 2.5 times more likely to show risky behavior in traffic if accompanied. 

    (NHTSA, edgarsnyder.com)

    Statistics on teenage drivers report that the risk of crashing gets higher if the passenger is close to their age. Namely, teens get easily distracted by their surroundings and are more likely to cause a crash. Moreover, 12% of all fatal car accidents involve a distracted teenage driver. Because of this, most US states have banned adolescent passengers in the vehicle if the driver is a teenager themself. 

    24. 40% of teens say they feel anger. 

    (Moto Safety)

    Since it is hard for teenagers to control their feelings in general, they can just as easily get overwhelmed with emotions while driving. Besides that, ingesting alcohol can easily enlarge emotions. So, keep in mind—it is of critical importance that teens do not drink and drive. 

    Positive Facts about Teenage Driving

    Even though the statistics sometimes don’t seem too bright, there are some positive facts regarding teen driving. It is essential to notice that parents’ involvement and persistence in educating their teenagers on the dangers on the road is the first step towards improving adolescent driving stats. 

    25. Teen drivers with involved parents tend to wear seatbelts twice as much.

    (Do Something)

    To add to that, statistics on teen drivers affirm that 56% of teenage drivers rely on their parents to teach them how to drive. This is an encouraging fact. Parents should educate and support their kids in becoming young drivers. 

    26. 66% of teen drivers say they care about their parent’s opinion on driving and using a phone.

    (Southern States Insurance)

    Thus, as a parent, you should talk to your teenage drivers and educate them on the issue. Undoubtedly, provide them with a phone holder. This way, you will lower your teen’s chances of using a phone for GPS purposes while driving.

    27. Drunk driving fatalities among teens have decreased by 81% since 1982.

    (Responsibility)

    Teen drinking and driving statistics reveal the falling number of teen drunk driving fatalities. According to the National Traffic Safety Administration or NHTSA, among people younger than 21, there were 5,215 recorded cases in 1982. That was also the first year for this organization to monitor the number of teen deaths in traffic. 

    28. The number of teens who drink and drive has decreased by 54% since 1991.

    (Talk it Out)

    The last two teenage drunk driving facts are very optimistic. Still, teenage underage drinking and driving is an existing problem to this day. In addition, some studies show that most teens usually have a taste of alcohol at the age of only 14. 

    Conclusion

    Even though teen drivers are the most endangered age group on the road, it is wrong to distract them or ban them from driving. Instead, support your teenagers and educate them on the matter of safety on the road. This way, you will give your part to lower the number of teen car crashes. 

    People Also Ask

    What Is the Youngest Driving Age?

    The youngest driving age in the US depends on the specific country. Still, the usual lower limit is 16 years old. In some states like Arkansas, Connecticut, Columbia, Florida, Georgia, Indiana, Maryland, Nevada, New Jersey, Ohio, Illinois, Texas, Virginia, and others, you must be 18 to get a full license. On the other hand, in states like Alaska, Arkansas, Iowa, Kansas, North and South Dakota, 14-year olds can obtain a learner’s permit. Also, in North and South Dakota and Idaho, Montana, South Carolina, you can get a full license if you are 16 years old.

    What Percentage of 16 Year Olds Have Cars?

    Even though a large majority of US adults have a driver’s license (84.1% to be precise), the number significantly drops as the age drops. For example, only 34.8% of teenage drivers aged 16 to 19 own a driver’s license. On the other hand, the age group with the most drivers is from 50 to 68 years old – 93.5%, as a survey from 2020 shows.

    What Percentage of Car Accidents Are Caused by Teenage Drivers?

    Teen drivers are ten times more likely to cause a vehicle crash in the first year of driving. Accordingly, one in every five teen drivers has a crash within the first year of getting a license. For example, 7% of motor vehicle crash fatalities were caused by teenagers in 2019.

    How Many Accidents Are Caused by Teenage Drunk Drivers?

    As the NHTSA statistics show, around 2,000 fatal crashes happen each year because of drunk teenage drivers. In 2019, almost a quarter of drivers between the ages of 15 and 20 who lost their lives in fatal motor vehicle crashes had been consuming alcohol.
    As per a survey, older high school students, male, Hispanic, and those with lower grades, were more likely to drive after drinking.

    How Many Teens Die from Driving Each Year?

    Each year, around 3,000 teenagers lose their lives on the road while driving. For example, in 2019, 2,375 teens died as a result of a motor vehicle crash. To add to the notorious statistics, around ¼ of all fatalities include a drunk teenage driver. On the bright side, the number of teen crashes has been reduced since restrictions on night-time driving for teens and other limits (such as forbidding driving with another teenager and raising the licensing age).

    What Is the Number One Killer of Teenage Drivers?

    The main cause of teen deaths and disabilities is motor vehicle crashes. All crashes are listed as ‘accidents – unwanted injuries.’ There are other less common causes of teen deaths, such as homicide, suicide, cancer, etc. The main reasons for teenage car crashes are distracted driving, speeding (or driving too fast for the particular road conditions), and lack of scanning the surroundings, as teen driving statistics imply.

  • 22 Intriguing Distracted Driving Statistics to Increase Awareness

    22 Intriguing Distracted Driving Statistics to Increase Awareness

    Even though there have been fewer cars in the streets last year, it seems like distracted driving statistics haven’t improved notably compared to the previous years.

    Nonetheless, we should all be aware of the consequences of distracted driving. Instead of ignoring this problem, we should focus on minimizing distractions on the road, now more than ever, with the crowded hospitals worldwide. This way, we will show appreciation to the tireless medical staff across the globe.

    Keep reading to stay informed about the latest stats concerning distracted driving.

    The Top 8 Distracted Driving Statistics (Editor’s Choice)

    • Every year, around 3,000 people are victims of crashes involving a distracted driver
    • In 2019, 6% of drivers in fatal crashes were distracted during the crash
    • Over 565 nonoccupants died in distracted driver crashes in 2019
    • Using cell phones while driving is responsible for 14% of deadly crashes
    • Every day, 11 teenagers are killed because of texting and driving
    • 25% of car accidents in the United States happen due to texting and driving 
    • 60% of respondents claim that they rely on GPS while driving
    • Texting while driving is six times more likely to lead to an accident than drunk driving 

    General Distracted Driving Statistics

    The first step towards reducing and hopefully eliminating distracted driving is getting into the matter, familiarizing with stats, and apprehending such behavior’s consequences. 

    1. There are three main categories of distracted driving. 

    (CDC) 

    In general, everything that takes your attention off the road and driving is a possible distraction, whether physical or mental (verbal, visual, etc.). Still, here are the three main types of distracted driving: 

    • Visual distraction – anything that makes you take your eyes off the road.
    • Manual distraction – a stimulus that makes you take your hands off the steering wheel.
    • Cognitive distraction – taking your mind off driving (it can be caused by a stimulus from the driver’s environment, or the driver can wander off in their thoughts).

    2. Around 3,000 people die every year in crashes involving a distracted driver.

    (CDC, NHTSA)

    In general, about 3,000 people die every year in crashes that involve a distracted driver. For example, NHTSA distracted driving stats revealed that in 2019, 3,142 people passed away. 

    Moreover, about eight Americans lose their lives in crashes involving a distracted driver every day.

    3. 5% of fatal crashes occur because the driver was distracted at the time of the crash. 

    (Crashstats.NHTSA)

    Besides, 8% of fatalities occurred because the distracted driver was a teenager aged 15 to 19. This age group is the riskiest one when it comes to deaths as a result of distracted driving. Stay with us to find out more about teen distracted driving statistics. 

    4. In 2019, 6% of drivers involved in fatal crashes were distracted at the time of the crash.

    (NHTSA)

    In addition, around 9% of drivers aged 15–20 who were related to fatal crashes were distracted. As a matter of fact, that’s the age group with the largest proportion of distracted drivers during fatal crashes. 

    5. In 2019, 566 nonoccupants lost their lives in distracted driver crashes. 

    (NHTSA)

    They were pedestrians, people riding their bikes or something else. This issue should be emphasized in public more often, considering that most research focuses on traffic participants as primary victims of distracted driving while neglecting victims outside the vehicles.

    Cell Phone Use While Driving Statistics

    Cell phone use while driving is the primary source of distracted driving. This way, technology is, in a way, taking the lives of people who (mis)use it. 

    6. There are three ways of using electronic devices while driving.

    (Crashstats.NHTSA)

    As stated by the National Occupant Protection Use Survey (NOPUS), three types of devices are used while driving. 

    • Drivers ‘holding phones to their ears’—stats on distracted driving indicate that this practice is more common among women than men. Also, young drivers aged from 15 to 24 years are more likely to hold their phones to their ears than the other age categories. 
    • Drivers ‘speaking with visible headsets on’.
    • Drivers ‘visibly manipulating handheld devices’. This type of misuse is also the most common among people aged between 15 and 24. 

    7. Using a phone while driving is the leading cause of distracted driving. 

    (LGinjuryfirm)

    Distracted driving facts reveal that two leading causes of distraction are talking and texting while driving. As estimated, 26% of all accidents involve cell phones. Using GPS takes second place when it comes to causes of distracted driving. The third is adjusting music and car controls. Other causes include applying makeup, wandering off, handling children or pets in the vehicle, talking to passengers, etc.

    8. 14% of fatal crashes involved using cell phones while driving.

    (TheZebra)

    In addition, 9% of all fatal crashes involve texting and driving as people’s addiction to their smartphones continues to increase. Later on, we will talk specifically about texting and driving facts.

    9. 7% of all drivers admit to using their phones at any time while driving.

    (TheZebra, iii)

    This type of behavior leads, of course, to a large number of accidents and fatalities. For example, there were 387 fatal crashes due to cell phone distraction in 2019. They led to 422 deaths. 

    In addition, of course, the financial damage is enormous—15% of the overall damage caused by crashes is connected to mobile devices. To illustrate, drivers who drive and use their mobile devices cause societal damage of 129$ billion annually.

    Teenage Distracted Driving Statistics

    Unfortunately, teenagers are the most endangered when it comes to distracted driving. Surveys show that people of this age tend to show riskier behavior in traffic than the other age groups. So firstly, let’s make straightforward what the syntagm ‘teen driver’ implies—it is a person with a valid state license, aged 15 to 18 years. 

    10. 11 teens are killed every day due to texting and driving. 

    (VictoriaAdvocate, TheZebra)

    In the US only, 11 teenagers die every day as a result of driving and texting. This indicates that over 3,000 teens are killed annually due to texting and driving. It is actually the leading cause of teen deaths in the US. This type of behavior takes more teen’s lives than mass school shootings, as texting while driving statistics demonstrate. On average, less than one person (both children and adults) dies from mass shootings every day. 

    11. 39% of high school students text or email while driving.

    (CDC)

    A study conducted in 2019 showed that 39% of US high school students texted or emailed while driving at least once in the last 30 days. Still, this habit is more common among older students. Also, it is more frequent among white than black or Hispanic students. 

    12. Students who text and drive are more likely to report other risky behaviors.

    (CDC)

    Statistics on distracted driving show that students who email or text while driving are more likely to report other types of risk behavior in transport. This includes not wearing a seat belt, driving under the influence of alcohol, riding with a person who previously consumed alcohol, etc. In addition, texting and emailing while driving is more frequent among the ‘good graders’—students who mainly gain As or Bs instead of lower grades. 

    13. Teens are more likely to show risky behaviors when accompanied by another teenager. 

    (NHTSA)

    NHTSA distracted driving statistics indicate that most teens are distracted by the passenger in the vehicle, especially if they are close to their age. The same study proved that teen drivers are 2,5 times more likely to report risky behavior while driving if accompanied by another teenager. The risk goes up proportionally to the number of passengers. For example, a teen driver is three times more likely to engage in risky traffic behavior if accompanied by multiple passengers. 

    Texting and Driving Statistics 

    When texting, you are visually, manually, and cognitively diverted from driving. Therefore, all three main types of distractions are involved. This makes texting and driving the main cause of distracted driving.

    15. When texting, the driver takes their eyes off the road for five seconds.

    (NHTSA)

    This doesn’t sound alarming, right? Let’s illustrate. When driving at 55 mph, taking your eyes off the road for only five seconds is the equivalent of driving a whole football field with closed eyes. Texting and driving statistics (that are pretty dismal) make more sense now?

    16. One in every four car accidents in the US happens due to texting and driving. 

    (Edgarsnyder, TheZebra)

    Nearly 390,000 traffic injuries happen every year because of texting while driving. It is way more dangerous than any other activity that includes a cell phone. Nonetheless, you are 400% more likely to cause an accident when driving and texting. 

    16. Apple users are more likely to be distracted while driving.

    (TheZebra, Injuryfacts.NSC)

    A study conducted at the beginning of 2021 showed a drop in distracted driving cases compared to distracted driving statistics 2020. Still, it is only the beginning of the year, which we all expected due to the lower number of vehicles on the road.

    There is a 13.7% increase in cell phone usage while driving among Apple users. Strange enough, there has been a 2.7% decrease among Android users compared to the last year. This study proves how complicated and confusing statistics can sometimes be.

    In conclusion, texting and driving death stats revealed a drop in recorded cases, even though the number of drivers using mobile devices has increased in the last few years. 

    17. 94% of drivers support banning texting and driving.

    (Edgarsnyder)

    Even though many drivers admit that they use their cell phones while driving, most of them support the idea of prohibiting texting while driving. At the same time, up to 74% of drivers support banning the usage of all hand-held mobile devices, as facts about distracted driving indicate.

    18. 60% of respondents admit that they use GPS while driving. 

    (TheZebra)

    Even though it might not seem that way, using GPS while driving can be as dangerous as texting. It is still a distraction from the driver’s attention. Unfortunately, only 7% of respondents who use GPS while driving state that they believe it is more dangerous than texting. 

    Distracted Driving vs. Drunk Driving Statistics

    The majority of people believe that drunk driving is the most destructive behavior in traffic. Still, research results are completely opposite to the standard view.

    19. Texting while driving is six times more likely to cause an accident than drunk driving. 

    (TheZebra)

    As opposed to the general opinion, statistics have shown that texting while driving is way more dangerous than driving under the impact of alcohol. (As we have already underlined, multiple types, texting, and driving, is the leading factor for distracted driving deaths.

    20. Using a phone while driving creates the same amount of distraction as 0.08% of alcohol.

    (TheZebra)

    Using a phone and driving distracts the driver and delays their reaction in case of danger in the same measure as having the legal federal amount of alcohol in the blood, which is 0.08%. We should ask ourselves how the level of distraction is the same, yet texting and driving deaths are much more common than fatalities caused by excessive alcohol consumption. 

    21. 48% of respondents believe that driving under the influence of alcohol is more dangerous than texting and driving.

    (TheZebra)

    The same number of respondents (48%) claim that they consider driving while intoxicated to be just as dangerous as driving and texting. This proves that the awareness of texting while driving dangers is on the rise. 

    22. Men are more likely to drink and drive.

    (TheZebra)

    Statistics about distracted driving indicate that women are more likely to text and drive, while men are about four times more likely to drink and drive. 

    How to Prevent Distracted Driving

    In the end, all we can do is try to improve ourselves to lower the number of distracted driving accidents. Thus, we’ve created a short manual on preventing distracted driving, using Centers for Disease and Control Protection advice on the subject.

    As a Driver

    (TheZebra)

    Put an end to multitasking while driving. Nothing is worth risking your life and the lives of your passengers. So, forget about that quick text that ‘will only take a second,’ adjusting your mirror, having a bite… Even though eating while driving statistics for 2021 were bright since the decrease of 4.2% compared to 2020, it was still one of the most frequent distractions. 

    As a Passenger

    (NHTSA)

    If you notice that the driver is getting distracted, speak up to them. Of course, try not to create any distractions yourself. Keep in mind that drivers’ attention (especially if they are young) can be diverted by loud music or sudden sounds. Most states have a law that limits the number of passengers if the driver is a teenager. Of course, no such laws refer to adult drivers; thus, safety is partly a passenger’s responsibility. 

    As a Parent 

    Communication is the key in educating your children—talk to them about all the dangers of distracted driving. Be familiar with the state’s laws and guidelines for young drivers. Try to bring them closer to your driving teenager and keep them informed about distracted driving accident statistics.

    Conclusion

    Distracted driving is a major cause of car accidents in the US. Thus, we must stay informed about the issue. Our primary goal in 2022 should be to educate our children, given that teenagers are the age group that is most involved in distracted driving fatalities. This is the only way to lower the number of crash cases involving a distracted driver. 

    People Also Ask

    How Many People Die from Distracted Driving?

    On average, around 3,000 people die every year in crashes that involve a distracted driver. These stats have been relatively invariable in the last years. Namely, in 2019, 3,142 people lost their lives due to distracted driving in the United States.
    Moreover, eight people die each day due to distracted driving.

    What Percentage of Accidents Are Caused by Distracted Drivers?

    Overall, 5% of all fatal accidents occur because of distracted drivers. Besides, up to 8% of fatalities come as a result of a distracted teen driver. Young adults are participants in 25% of the accidents that involve a distracted driver, while teenagers are even more likely to get distracted. As much as 14% of fatal crashes include using cell phones while driving. Not only that, but 9% of casualties happen because of driving and texting.

    Has Distracted Driving Increased?

    No, the number of cases that include distracted driving seems to be somewhat unchanged over the last years. Still, there are some indicators (and hope) that the numbers will start to drop. For example, the number of recorded cases of eating while driving has been on a decline. In addition, there is an increase in the figures for drivers who use cell phones. Still, the number of deaths caused by texting and driving has been decreasing.

    What Is the Number One Cause of Distracted Driving?

    The leading cause of distracted driving is using a phone. The number one cause of death involving a distracted driver is driving and texting. Surprisingly for many, GPS takes second place. The third common reason for distracted driving is adjusting car controls and music, followed by other causes, such as eating, applying makeup, handling children and pets, talking with passengers, wandering off, etc.

    What Age Group Is Most Distracted While Driving?

    Even though the statistics indicate that young adults (aged 20 to 29) participate in 25% of distracted driving cases, teenagers (aged 15 to 19) are known to get distracted more often. They are responsible for up to 8% of annual death cases caused by distracted driving. Unfortunately, up to 39% of high school students admit to texting or emailing while driving.

    How Many Deaths a Year Are Caused by Texting and Driving?

    Almost 390,000 traffic injuries happen every year as a result of texting while driving. To put numbers in perspective, one in every four car crashes occurs because the driver was texting at the time of the accident. Multiple studies have shown that a person is 400% more likely to cause an accident when driving and texting. Unfortunately, up to 7% of drivers admit to using their phones while driving.

    How Many Teens Die a Day from Texting and Driving?

    Every day, 11 teenagers die in the US as a result of driving and texting. It is the leading cause of teen deaths in the US. Over 3,000 teenagers lose their lives every year because of texting and driving. This type of behavior in traffic kills more teens than mass school shootings. For example, nearly one person (including children and adults) dies daily as a victim of mass shootings, compared to the above-stated 11 perished teens. It seems like distracted driving statistics are rather severe and defeating when it comes to our children’s lives.

  • 30 Astounding Internet Privacy Statistics in 2024

    30 Astounding Internet Privacy Statistics in 2024

    Global issues revolving around internet privacy statistics have always been crucial topics. After all, stealing and exploiting someone’s personal data isn’t limited only to physical means. It can also be possible online. As technology advances, new concerns have emerged in recent years.

    Nowadays, anyone with an online profile might be at risk, especially those who are not very familiar with how the internet works. To find out how you can protect your online privacy, here’s a master list of the statistics that will astound you.

    Surprising Internet Safety Statistics to Keep in Mind (Editor’s Choice)

    • The most prevalent kind of online data breach in the world is identity theft
    • In 2020, over 91% of internet users in Japan were concerned about online privacy
    • Iceland has the highest internet freedom percentage
    • In the United States, 95% of digital shoppers don’t trust online shopping ads
    • 79% of US online consumers don’t think companies would take responsibility for online privacy issues
    • Out of 194 countries, 128 have legislation to protect data and privacy
    • The highest percentage of people aware of its country’s online privacy laws is in India
    • Around 9% of digital users residing in the United States consider digital privacy fake

    Interesting Internet Privacy Facts

    The internet can be used in hundreds of ways. With millions of individuals using it every day to browse data, perform online purchases, and manage social media accounts, it is important to protect your personal information. Here are some facts you should consider to gain insight into how your online data can be compromised.

    1. Over 164.68 million private records have been exposed in the United States, according to the invasion of privacy statistics.

    (CNBC)

    The global issue of online privacy has gained popularity in the last few years, and for a good reason. According to research, around 540 online data breaches have already been reported in the US in the first quarter of 2020. If not prevented, this number can increase in the second part of the year.

    2. 48% of Americans think they have no control over their online privacy and security regarding the search terms they use.

    (Pew Research Center)

    A significant part of handling online privacy is user control. Maintaining safety on the internet means that you should control how much personal information you put online.

    Many US citizens agree with this perspective. Around 48% think that they have zero control over the search terms they enter in search engines.

    3. 95% of US online consumers don’t trust online shopping ads and recommendations.

    (Statista)

    When you regularly shop online, the sites you are visiting will analyze your standard search terms. They will then show ads and recommendations in accordance with your shopping preferences.

    However, this modern feature is not very popular among digital users. According to a study, 95% of online buyers in the US don’t trust online ads shown on VR or AR headsets.

    4. Consumer privacy statistics show that 81% of US consumers don’t trust online shopping ads on mobile phones.

    (CSA)

    Mobile ads can often be perceived as more bothersome due to their “unskippable” feature. This situation can be prevented by installing an ad blocker on your phone — the same thing people usually do on their desktop devices. 

    5. 86% of internet users in the US think that bloggers and influencers aren’t trustworthy.

    (Statista)

    Surfing statistics have shown that with the rise of the internet, new types of entertainment have become mainstream. Examples of such are bloggers and influencers that can be found on every social media platform.

    However, internet users seem to be distrustful of these online celebrities. According to a recent study, around 86% of internet users living in the US do not trust bloggers and influencers.

    Internet Privacy Statistics

    6. In 2019, 47% of US Baby Boomer mobile users were concerned about data privacy issues.

    (Statista)

    Research showed that approximately 47% of mobile users in the US were worried about their data privacy. It is also worth noting that this percentage came from American adults born in the Baby Boomer era spanning from 1946 to 1964.

    In contrast, those belonging to Gen Z were the least concerned about this issue — only 28% of them. As this demographic refers to individuals who were 8–23 years old, they probably were not fully aware of internet dangers.

    7. Identity theft is one of the most popular privacy concerns with technology worldwide.

    (Statista)

    The most common type of data breaches that might occur online is identity theft. With many online platforms and services asking for users’ personal information, you should be careful when giving your data. In an updated survey, identity theft accounts for 65% of the data breach incidents from all over the world.

    Find out how to deter identity theft.

    8. Google received around 40,000 information requests from federal government agencies January–June 2020.

    (Los Angeles Times)

    Out of them, over 15,500 were subpoenas. Generally speaking, federal agencies can request personal information from online platforms for legitimate reasons. 

    An example of that is when a federal service needs a specific individual or group’s online data to proceed with the investigation. 

    9. Internet privacy statistics show that 34% of US users feel uncomfortable with tech corporations sharing their location data with the government during the pandemic.

    (Statista)

    Numerous digital programs and innovations have been made to help during the pandemic. One such example is government agencies keeping track of individuals’ location data.

    However, around 34% of digital users in the US feel very uncomfortable with tech corporations sharing their location with government agencies, while only 12% feel very comfortable with it.

    10. According to internet privacy statistics, 79% of Americans don’t believe that companies will take responsibility in case of data misuse.

    (Pew Research Center)

    Although data breach incidents can be prevented, they might be inevitable for many corporations. In such scenarios, the company should take responsibility and ensure the privacy of its customers. Approximately 79% of digital consumers located in the US don’t entirely trust tech companies. It is mostly applicable to data misuse situations.

    Global Privacy Concerns Statistics

    The issue of online security is not limited only to a few countries. It is now a global matter that is taken seriously by many. Here are some stats and facts that will tell you more about internet privacy from all over the world.

    11. 128 out of 194 countries have legislation to protect data and privacy. 

    (UNCTAD)

    As per Internet safety statistics, that translates to nearly 66% of countries having legislation. The primary reason for these legislations is the storing, use, and sharing of personal data to third parties without consumers’ approval. 

    12. Iceland has the highest percentage of internet freedom.

    (Statista)

    Internet freedom can vary depending on the country. Many parts of the world provide an open door for internet usage. For example, Iceland has the highest rating for internet freedom with 95 index points, followed by Estonia with 94 index points.

    13. Australia, the US, and Italy received 76 index points for practicing internet freedom.

    (Statista)

    The data privacy statistics in 2020 show how global laws work for privacy control and internet freedom. Due to technological demands, several countries have a high Internet Freedom Index. Estonia is second on the list with 94 index points, followed by Canada and Germany with 87 and 80 points.

    14. China has the least internet freedom with 10 index points.

    (Statista)

    Several parts of the world have limited the amount of internet freedom for their citizens. A stark example is China — one of the rising technological giants on the planet. According to the updated global censorship statistics and facts, China occupies the last place with 10 index points.

    15. Internet users in Nigeria are most concerned about their internet privacy.

    (Statista)

    Due to the growing global concern about data privacy, many countries have raised awareness about its potential risks. According to Statista, approximately 82% of online users in Nigeria have become more concerned about their privacy than in the previous year.

    16. 91.6% of internet users in Japan were concerned about online privacy in 2020.

    (Statista)

    Japan has also become one of the tech industry leaders. According to internet privacy statistics, around 91.6% of internet users from Japan expressed concern about internet privacy. Moreover, older generations had the tendency to worry more. 

    17. According to online privacy statistics, people in the United States, Indonesia, and Mexico are most concerned about their internet privacy due to foreign governments.

    (Statista)

    Aside from being aware of their respective country’s online privacy laws, various users have also expressed concern about potential privacy breaches by foreign governments. While it might seem far-fetched, breaches are possible risks in the rapidly developing technology era.

    According to a survey, the US, Indonesia, and Mexico’s awareness rates on internet dangers statistics have increased. The US has an awareness rate of approximately 77%, Indonesia ranked with 75%, and Mexico had a total percentage of 72%.

    18. India has the highest awareness rate concerning online privacy’s importance and their country’s online privacy laws.

    (Statista)

    Raising awareness about this global issue is an important task, especially in the digital transformation era. Online privacy facts show that digital users in India have the highest awareness levels of their country’s internet privacy laws.

    19. In 2019, 59% of internet users in Germany were aware of their country’s internet privacy regulations.

    (Statista)

    Aside from India, other communities have also become more aware of their country’s online privacy regulations. According to the internet and social media safety statistics from 2019, around 59% of online users in Germany were aware of internet privacy rules and regulations in their country.

    20. 52% of female internet users in the US expressed concern about their data security.

    (Forbes)

    Women generally spend more time on the Web and use social media for personal reasons. Moreover, around 52% of women in the US are concerned about their data privacy, while their male counterparts stand at 33%.

    Internet Privacy Statistics #2

    Internet Safety Facts and Statistics

    The risks of browsing the internet can be prevented by employing online protective measures. To improve your online safety, you should familiarize yourself with more factual stats you can find below.

    21. 74% of US internet users are concerned about online privacy.

    (Statista)

    A staggering amount of digital users from the US have become concerned about their online privacy. In an updated study about digital users’ privacy, around 74% of internet users in the US expressed their worries about their internet privacy rights.

    22. 33% of US internet users partially understand their country’s law about online privacy.

    (Pew Research Center)

    If the lack of awareness about this serious topic is not remedied, it can lead to potential privacy issues in the future. As can be seen in an up-to-date review of internet privacy issues from 2019, only 33% of internet users from the US have obtained general or in-depth knowledge about their country’s laws and regulations about data privacy.

    23. 9% of US internet users think that digital privacy is not real.

    (Statista)

    While it is a growing issue that demands global attention, some individuals choose not to believe in it. In a survey about social media safety, 9% of US internet users believe that online privacy is a myth.

    24. According to privacy invasion statistics, identity theft and fraud are the most prominent internet privacy concerns in the US.

    (Statista)

    As mentioned before, identity theft and fraud are the most concerning privacy issues in the US. Obtaining general or in-depth knowledge about data privacy laws can help you protect your sensitive information from data breaches.

    25. Only 23% of US internet users trust social media ads.

    (Statista)

    Social media privacy statistics show that not a lot of internet users in the United States feel safe on social media. Although social media has become a space for everything, including advertisements, clicking on a suspicious link can pose a risk to your online safety. It seems that a great percentage of internet users in the US think in the same way, as only 23% of them put their trust in ads on social media.

    26. Privacy statistics show that only 33% of internet users frequently change their passwords.

    (Statista)

    One of the protective actions you can take for maintaining online safety is frequently changing your passwords. It is recommended that you change your passwords at least once in three months.

    However, not everyone follows this word of advice. As stated in a recent study conducted on internet users worldwide, only 33% of global online users frequently change their passwords.

    27. Online safety statistics show that 45% of internet users worldwide avoid opening emails from unknown sources.

    (Statista)

    Unknown email addresses are also considered online risks, and many internet users agree on a global scale. According to recent statistics, around 45% of online users worldwide avoid opening suspicious email messages.

    28. 41% of worldwide users disclose less personal data on the internet.

    (Statista)

    Approximately 41% of digital users worldwide decided to share less personal data on the internet. As said before, maintaining privacy can also be about sustaining control. You have to think twice before clicking on an online post and be careful about sharing your details.

    29. Cookies and internet privacy stats show that 16% of internet users worldwide don’t take any protective measures online.

    (Statista)

    Global awareness about online privacy has increased and gained momentum in recent years and is expected to continue growing. However, many users are either unaware of or not paying attention to online risks. Around 16% of digital users worldwide do not implement any protective measures for protecting their personal data.

    30. According to internet safety statistics, only 36% of internet users worldwide have an antivirus program.

    (Statista)

    Installing an antivirus program is probably one of the necessary steps in online protection. It prevents data breaching viruses from attacking your computer system where private and personal data might be stored. However, only 36% of people worldwide have an antivirus program installed on their computers.

    Conclusion

    The internet potential is vast and sometimes unknown. While it is mostly used for communication, entertainment, and other purposes, it can also be a space for privacy risks caused by online perpetrators, as stated in the recent stats of internet privacy. That is why you can use advanced and straightforward methods to protect your online experience.

    Some ways of doing so are updating your passwords as frequently as you can or perhaps consider using a password locker and manager. Double-checking the web pages you visit and the email messages you open can also help. The worldwide demand for increased data security has become a significant motivator for tech corporations to step up, which means you should contribute as well.

    People Also Ask

    How much personal data is on the internet?

    As almost everything has become digital nowadays, it might be unavoidable to share personal data online. This is usually the case when registering on an online platform.
    If we try to find out how much personal data is on the Web, we should consider the total sum of data held by all the big online storage companies like Google, Facebook, Amazon, and Microsoft. It is estimated that these companies store at least 1.2 million terabytes of data.
    However, that figure excludes other big providers like Dropbox, Barracuda, and SugarSync, so the numbers are actually much higher.

    Is privacy guaranteed on the internet?

    Like many actions in life, browsing the Web can bear potential risks. However, these risks can be prevented. Social media privacy facts show that social media users from the US have taken online protective measures very seriously.
    Examples of such are the following:
    – Updating online accounts and passwords
    – Using the best antivirus program
    – Checking the web pages they visit to see if they are verified
    – Limiting the personal information shared on the internet

    How important is privacy on the internet?

    Privacy on the Web is an essential factor to consider, especially if you want a safe experience online. An excellent antivirus program can make all the difference. If you have some privacy issues with social media, it can prevent hacking your accounts and obtaining personal data. It also enables you to digitize your daily tasks, such as shopping, without worrying about data privacy.

    Do users care about privacy?

    Privacy issues are an important concern for many users. Around 75% of people in the US care about online privacy. This percentage is expected to grow in the next few years, as digitalization takes over everything.
    However, the primary interest in this topic may vary depending on the user demographic. According to internet privacy stats, baby boomers are most concerned about online privacy. In contrast, young individuals from Generation Z are least concerned about data privacy.

    Is online privacy dead?

    US users agree that online privacy is vital in the modern age. However, various external factors might affect the level of privacy a digital consumer can attain.
    As statistics about internet privacy show, several countries have limited internet freedom, leading to less user privacy protection. On the other hand, tech companies are on the fast advancement track. Major corporations have stepped up and launched security protocols for their consumers.

    How can I get internet privacy?

    Attaining internet privacy doesn’t have to be a complicated process. For the most part, taking a few precautionary steps is all you need to ensure your data security. An example of that is the simple act of thinking twice before clicking on an unreliable link.
    Increasing your awareness by checking internet privacy statistics can also be a huge help. This in-depth article has provided a complete lowdown on risk and prevention strategies you can employ.

  • 20 Food Stamp Fraud Statistics To Know in 2024

    20 Food Stamp Fraud Statistics To Know in 2024

    Hunger is a global issue, and the situation in the US makes no exception. As part of a prevention strategy, the government has established the Supplemental Nutrition Assistance Program or SNAP.

    The program distributes benefits to everyone in need, known as food stamps. The process happens through a digital system — the Electronic Benefits Transfer (EBT). Food stamps have become the country’s safety net against hunger and food insecurity, especially during the pandemic. 

    However, not everyone has the same positive intentions when utilizing these benefits. The latest food stamp fraud statistics reveal a significant increase in malpractice when it comes to distribution. 

    To find out more about this topic, here is a complete list of facts about the current predicament of food stamps abuse in the US.

    Stats and Facts About Food Stamp Abuse (Editor’s Choice)

    • The cost of trafficked food stamps is between 1 and $4.7 billion annually 
    • One in ten retailers is exploiting food stamp benefits
    • 90% of small retail shops are targets for retailer trafficking
    • New York and California have the most food stamp investigations
    • Food stamp investigations have increased by 30%
    • Taxpayers in Florida have lost $12 million due to food stamp exploitation

    Frequency of Welfare Fraud Statistics

    Benefit programs such as SNAP contribute to the general welfare of the country. Unfortunately, some people unrightfully take advantage of the initiative. 

    Here are some facts about the frequency of fraud cases in the US food stamp program and the costs of preventing such actions.

    1. USDA spends around $5 million every year to fight food stamp scams.

    (FSN)

    Cases of individuals extorting food stamp benefits have become so common, the authorities have taken various steps to prevent them. 

    A recent news report reveals the US Department of Agriculture invests nearly $5 million from federal taxpayers’ money every year to investigate food stamp fraud cases.

    2. According to a food stamp fraud report, the cost of trafficked benefits is between $1 and $4.7 billion every year.

    (FGA)

    Billions of dollars are dedicated to satisfying the massive demand for food stamps annually. Unfortunately, a significant percentage does not go to the determined recipients of SNAP. 

    The Food and Nutrition Service estimates that up to $4.7 billion are stolen from the program every year.

    3. Food stamp abuse facts reveal that over one in ten retailers are likely committing fraud.

    (FSN)

    Fraud cases are not just an individual effort. Some retail stores registered in SNAP find loopholes to exploit, despite the program’s prevention protocols. Retailers might sell ineligible items and misrepresent information to gain benefits for themselves. 

    4. 90% of small business stores are targets for retailer trafficking.

    (FSN)

    Authorities often look at the most likely targets to determine how to prevent fraud cases from increasing. Research shows that the welfare fraud percentage in small retail businesses is very high. Since small business owners have an average income of about $71,000, fraud significantly impacts them.

    5. 40% of large stores are among the main retailer trafficking targets.

    (FSN)

    Food stamp fraud statistics reveal that primary retail stores and supermarkets are also part of the scheme. Even restaurants in some states that provide hot meals for food stamp recipients are investigated for malpractice.

    6. Investigations of food stamp fraud cases have increased by over 30% in the last few years.

    (Forbes)

    The depth of this issue has led to a surge of inspections focused on food stamps abuse. According to most recent statistics, investigations have risen by more than a third, compared to 2012, and are likely to increase even more.

    7. Over one in five US households experience food insecurity.

    (Poynter)

    Regardless of the food stamp abuse statistics, there is an actual need for the program. Food stamp distribution is one of the primary US solutions to national hunger.

    Food Stamp Abuse Statistics by State

    The cost and impact of deception in the food stamp program vary in every state. Let’s take a look into more detailed facts about the demand and irregularities in the distribution of food stamps across the US.

    8. New York and California are the US states with the highest percentage of welfare fraud investigations.

    (FNS)

    New York and California are the two states with the highest percentage of food stamp investigations. Almost half of the country’s cases are from New York.

    9. Taxpayers in Florida lost over $12 million due to food stamp abuse in 2018.

    (Florida Daily)

    Maintaining benefits programs like SNAP requires tax money. Around 6% of your tax goes to food stamps, energy assistance, and other income security programs.

    Misusing funds can have a significantly negative effect on the whole state. An example is Florida, where taxpayers lost over $12 million in a year due to food stamp fraud.

    10. Illinois has canceled benefits for over 150,000 SNAP participants due to ineligibility, according to EBT fraud statistics.

    (PEW)

    Not everyone can be eligible for the food stamp program, however, social workers lack the time and resources to check every application adequately. 

    An example of such irregularities is Illinois. SNAP canceled food stamp benefits for over 150,000 people in a year after an additional investigation deemed them ineligible. This action saved up to $70 million. 

    11. SNAP fraud statistics show that around 20% of those who were denied benefits in Illinois re-applied.

    (PEW)

    Because of multiple changes in the system, SNAP applicants had a short period to provide the necessary information for their eligibility checks. That led to a failure in response and consequential benefit cancellations. Fortunately, 20% of them were able to re-apply for the benefits program.

    12. SNAP has investigated only five out of nearly 51,000 reported cases in Missouri.

    (AP News)

    Due to underdeveloped investigation processes, only five of 51,000 reported cases were opened for further action. The reason is the lack of enough information to continue the research on the alerts.

    SNAP Fraud Rate and Expenses

    SNAP aims to help people in need, however, the success of its mission and the social perception of its work might be two very different things. The following stats will show you some interesting information on the fraud rates and the initiative’s costs.

    13. Less than half of the US adults consider SNAP as a trustworthy benefit program.

    (YouGov)

    The SNAP fraud stats have become a public concern. With millions of people depending on this nationwide project, only 47% of them actually believe in the way SNAP operates. 

    For comparison, 57% consider Medicare trustworthy. To put things in perspective – 18.1% of people in the US have Medicare.

    14. SNAP’s expenses have increased by $2 billion per month to cover the effect of the pandemic.

    (FSN)

    The pandemic caused the hunger and food insecurity rates to go higher than ever. In response, SNAP has increased its expenses by $2 billion monthly to ensure fair distribution and decrease the food stamp fraud rate.

    15. Congress should increase SNAP benefits by 15% in response to the general rate of food insecurity and food stamp fraud.

    (Poynter)

    Despite the additional effort, authorities have concluded that it might not be enough. As more households become financially unstable due to the pandemic, putting food on the table is becoming an even more significant issue. 

    According to a statistical study, the US Congress should increase the nationwide food stamp benefits by at least 15% to cover every family’s needs.

    16. 14 out of 10,000 households involved in SNAP are guilty of food stamp abuse.

    (YouGov)

    These numbers show that intentional fraud regarding the food stamp benefit is rarely happening. The detailed application process is ensuring fair distribution based on elaborate background checks.

    17. Welfare fraud statistics show that 59% of US adults believe that misrepresenting information in SNAP applications is a common occurrence.

    (YouGov)

    As a consequence of the growing rate of welfare fraudulent cases, the general public’s opinion of the benefit programs is unfavorable — over half of the US adults think that fraud is common in SNAP applications. 

    18. The food stamp error rate for SNAP is estimated to be 3.7%.

    (PEW)

    The high demand for the benefit means various administrative processes are delayed, and errors are becoming more prevalent. Food stamp fraud stats estimate the error rate in SNAP to be nearly 4%.

    19. EBT fraud statistics reveal that over 320,000 retailers participate in SNAP and are often a subject of inspection.

    (FSN, USDA)

    Aside from households, retailers often make up a significant part of the SNAP participants’ list. All of these participants are analyzed routinely by FNS to detect and penalize fraudulent retailers.

    20. The highest ever payment accuracy rate of SNAP was 96.58% in 2012.

    (USDA)

    Due to the risk of abuse of food stamps, the authorities have cooperated to improve the level of integrity of SNAP’s processes. One of those collaborative efforts is known as the SNAP Stewardship Solutions Project. 

    The ongoing strategy aims to ensure the correct administration of food stamp benefits. Fortunately, SNAP’s payment accuracy rate peaked at over 96% since the project began, marking it as the highest ever achieved.

    Conclusion

    The issue of hunger and food insecurity has become non-dismissible in the US, leading to the SNAP establishment. A significant number of households and retailers, however, take unrightful advantage of the program. They either sell ineligible items, misrepresent data, or lie in the application process.

    Current food stamp fraud statistics have revealed that not only abuse cases are on the rise, but the percentage of families reliant on the program. SNAP supports approximately 38 million residents in the US, and the number is expected to increase as an aftermath of the pandemic. 

    In response to this nationwide demand, authorities have delivered multiple plans to ensure quality and fair service for every household in need. Examples are the increasing funds for fraud investigations, mobile food access, and further checks on SNAP applicants.

    People Also Ask

    Can you go to jail for food stamp fraud?

    As with every illegal act, a conviction for food stamp abuse can have severe repercussions. Depending on the circumstance, those found guilty are suspended from the SNAP and could even go to jail.
    The punishment for food stamp fraud cases depends on the extent of the committed act. In many cases, convicted individuals are financially penalized, plus an incarceration period. Having a criminal record can have long-term consequences, such as unemployment.

    What percentage of welfare recipients are frauds?

    The authorities have addressed the illegal use of benefits systems as a serious issue. Fraud cases account for between 3 to 5% of welfare recipients.
    USDA reportedly spends $5 million to fight welfare fraud annually.

    What state uses the most food stamps?

    A state’s demand for food stamps is determined by its population size and the economy’s condition. According to statistics on food stamp abuse and usage, 10% of California’s population are registered participants in SNAP and is the state with the most fraud cases.

    What is the welfare fraud rate for SNAP?

    Thanks to strategies, such as the use of ETB cards, the number of fraud cases in SNAP can be limited. In a published study about food stamp fraud statistics, SNAP’s average fraud rate currently amounts to at least 0.9%.
    While it is a seemingly small percentage, SNAP’s total costs can total up to billions. One fraud case can lead to a massive loss for the organization and the taxpayers.

  • Terrifying Cybercrime Statistics – Protect Yourself in 2024

    Terrifying Cybercrime Statistics – Protect Yourself in 2024

    Today we are almost entirely dependent on hackable technology. Your phone, your computers, your car, your bank and credit card purchases, even your smart home devices and alarm systems (IoT) can be hacked into. In fact, a hacker attack takes place worldwide every 39 seconds, affecting one in three Americans each year.

    In the following article, you’ll get a chance to see some cybercrime statistics from a variety of dependable sources that will help you understand the real threat you’re facing as a business, a person, and an employee. You’ll also learn a bit about how you can protect yourself. 

    Cybercrime is almost constant, committed by professionals and often extremely well-organized groups. As you will see, it’s also increasing in scope, sophistication, and cost.

    Important Cyber Crime Facts and Statistics (Editor’s Picks)

    • At least 330 million people were victims of some type of cybercrime in 2020
    • Two out of three companies worldwide have experienced a cyber attack in the past year
    • There were 1.51 billion IoT device breaches in the first half of 2021
    • Google predicts that 20% of social accounts will be compromised sooner or later
    • A day of botnet activity for hire can cost $67
    • More than $400 million ransom was paid through cryptocurrencies in 2020
    • $262.4 billion was spent on cybersecurity in 2021, and it will grow to $459 billion in 2025

    General Cybercrime Statistics, Scope and Frequency

    1. In 2020, at least 330 million people were victims of some type of cybercrime. 

    (Norton)

    That’s in 10 countries, many of which have outdated or even no cybercrime laws. Sometimes, you won’t even notice you were a target, like in case your computer becomes a part of a bot network. In some cases, you might even have to face financial losses. 

    2. Cybercriminals generate revenues of $1.5 TRILLION annually.

    (Dr. Michael McGuire, University of Surrey)

    The people behind recent cybercrimes no longer fit the stereotypical idea of a kid in a hoodie operating from his mom’s basement, at least not entirely. Today, we are up against organized crime, a professionalized underground industry that pays off big time. 

    3. Two out of three companies worldwide have experienced a cyber attack in the past year.

    (Cybint)

    Individuals are not the only victims of cybercrime – many companies, usually small to midsized ones, have to face increasing data breach or denial of service risks. This can answer questions about how many cybercrimes are committed each year. Companies can lose a significant amount of money in lawsuits and permanently damage their clients’ trust.

    4. Credit or debit card fraud – almost 30% of all identity thefts.

    (III)

    Credit card frauds happen when a person steals your card information and then uses it to gain access to cards and bank accounts. Even as banks try hard to make some types of attacks more difficult, criminals still turn a profit, and everyone needs to stay tuned to the new developments.

    5. It takes 228 days, on average, for a company to even realize it’s been hacked.

    (Varonis)

    That’s one of the most frightening cybersecurity statistics , since criminals can mess around with your confidential data for months on end before you even notice something’s wrong, and start fixing the damage.

    6. 35.14% of computers in China are in danger of being infected by malware.

    (Kaspersky)

    China is the country with the highest rate of infected computers in the world, which does suggest to a degree that China is primarily the victim, not the perpetrator of cybercrime.

    Types of Cybercrime

    The most common types of cybercrime experienced by consumers or someone they know include: 

    7. Viruses – the number of detected malware surpassed 700 million.

    (Statista)

    This could lead to software and even hardware failure, identity or personal information theft or nothing at all, no visible damage. Even then, a Trojan could even make your device a zombie server sending out spam, consuming your network and internet resources. Therefore, make sure to protect yourself with the finest antivirus software.

    8. Stolen account password – cyber security statistics show that there are around 15 billion of them for sale on the Dark Web.

    (Newsweek)

    Your password is a part of authentication, a secret only you are authorized to know, that helps you access a system. Using upper and lowercase letters along with numbers and some symbols is one way to fight brute force attacks, but this confidential information is still often stored and easily accessible in poorly protected devices. Or if you prefer, buy the best password manager for your needs to ensure all round protection.

    9. Email or social media hacking – Google predicts that 20% of social accounts will be compromised sooner or later.

    (ZeroFox)

    Once you’ve been hacked on a social media channel, the attacker will observe communication and use this insight to access other accounts for further criminal actions. This is usually done for financial gain – asking a bank to transfer money, and/or causing emotional damage, in case of extortion.

    10. Phishing – almost seven million new scam and phishing pages were created in 2020.

    (Bolster)

    Giving out account information to the attacker pretending to be your bank or other authority. This is done via email, message (smishing) or phone support (vishing). The attacker might ask for personal information like password, or ID number, or might ask you to configure your computer to suit your needs. A very productive type of cyberattacks as companies still ignore the human factor, and sees security as a solely technical problem.

    11. $170,404 is the average amount of cash attackers demand.

    (Sophos)

    Out of 357 companies that paid ransom, 20 of them paid just $10,000, while the highest amount was $3.2 million. The United States are the most targeted country in the world when it comes to ransomware, as they are the most willing to actually pay up, thus accounting for most of the global ransomware profits.

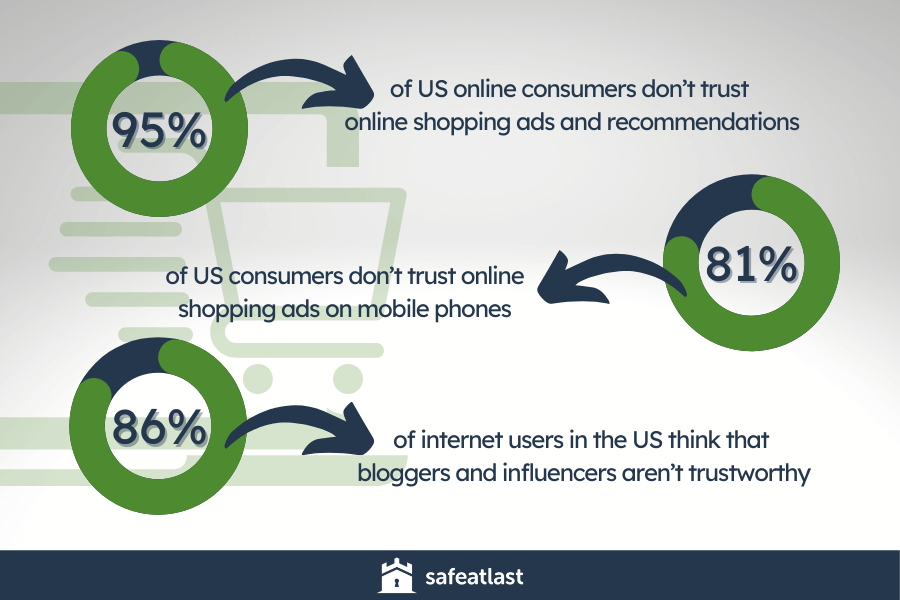
    12. People in 86% of organizations click on phishing emails.

    (Tessian)

    When talking about the general population that cannot be trained by companies, including customers, the stats are worrying. People tend to believe these pretend links are legit, and a fake website you might be led to is dangerous to an untrained eye.

    13. 75% of malware in 2021 was delivered by email.

    (HP Wolf Security)

    One of the most important cyber crime statistics and trends today is that hacking is becoming less and less prevalent as a technical problem. And as Medium noticed, using humans as the weak link is a growing trend, and it’s becoming more and more expensive and difficult to raise awareness of employees worldwide.

    14. In 2020, people sent 791,790 complaints to the Internet Crime Complaint Center.

    (IC3)

    A good proof that social manipulation hackers use to gain access to confidential info is so successful that even the FBI got involved. That year, the adjusted costs amounted to over $4.2 billion in the USA.

    15. More than $400 million ransom was paid through cryptocurrencies in 2020.

    (Chainalysis)

    Cybercrime and Cryptocurrency have established quite a reputation for being interlinked, even though the most popular cryptocurrencies like bitcoin or monero are relevant, although their position is quite overhyped as part of the cybercrime economy.

    16. The laundered money held in Bitcoin amounts to $2.8 billion annually.

    (Comply Advantage)

    The blockchain system supporting the cryptocurrency is eroding criminals of their anonymity these days, since doing business is a matter of public record, and web cookies are quick to link money transfers to individuals.

    17. The number of DDoS attacks increased by 55% in 2020.

    (F5)

    DSoS, or distributed denial-of-service, is one of the most prevalent cybercrime trends and is exactly what it sounds like: an effort to make a certain website unavailable for hours, days, even weeks at a time, by overflowing it with traffic from hijacked computer systems.

    18. 66% of small businesses suffered a cyberattack

    (Kaspersky)

    This affects them a great deal, since many of them go out of business within the first couple of months of being hacked.These business cybercrime statistics matter a great deal when you have a small client base, and your reputation matters a great deal.

    19. A day of botnet activity for hire can cost $67.

    (ZDNet)

    The hourly rate is around $9. It takes a huge amount of traffic to crash a website, and that’s why many botnets are bought and sold sold on the underground online market, fueling cybercrime growth.

    20. By 2030, there will be almost 25.5 billion connected smart devices worldwide.

    (Statista)

    Smart doorbells, smart fridges, smart lights, watches, heating, cars, home security systems, and even machines in your hospital: their one big characteristic is that they are incredibly easy to hack, as security is rarely a priority despite the fact that they are sleek mediators to stealing important data, or enabling DDoS attacks.

    21. There were 1.51 billion IoT device breaches in the first half of 2021.

    (IoT World Today)

    Hacked IoT devices enable easy access to much larger systems. They usually don’t have an OS or antivirus protection. This makes them easy targets, and the number of attacks is on the rise. In 2020, Kaspersky had registered only 639 million such attacks.

    22. Singapore’s government health database was hacked, stealing 1.5 million records.

    (GovInsider)

    In 2018, even the Prime Minister of Singapore, Lee Hsien Loong had his data stolen. The attackers had accessed, copied, and possibly sold info containing names, identity card (IC) numbers, addresses, and dates of birth.

    23. IoT devices suffered more than 1.5 billion attacks in 2021

    (Digit)

    These cybercrime statistics are a bigger deal than anyone seems to realize, and experts believe that companies are not allocating enough resources for smart device protection. Worldwide, companies seem slow to learn the risks and security implications of this weak link.

    24. More than 24,000 mobile malware is blocked on a daily basis.

    (Kaspersky)

    This is no surprise with today’s mobile-first technology. Cybercrime follows the traffic and the money. Hackers also try to take advantage of the fact that our phones are not as protected as our computers.

    25. Hacking statistics say that 93% percent of all mobile transactions in 2019 were blocked as fraudulent.

    (Help Net Security), (Statista)

    Coming as no surprise in today’s mobile-first technology, with mobile apps generating more than 50% of total web traffic. Some of the more challenging security issues stem from the competitive market’s demand for opening up our systems for connected, online use.

    The bank cyber crime statistics are increasingly disturbing now that users’ data is available to third parties. Criminals take advantage of the convenient, single sign-in we use to view our information or pay our bills. Before this new trend, the bank systems were closed.

    26. In 2017, 6M celebrity Instagram accounts were exposed.

    (The Telegraph)

    Some of the celebrities affected were Harry Styles, Selena Gomez, Taylor Swift, and Emma Watson. The dark web was stacked with contact details and personal life.

    (The New York Times)

    One worker in the Pentagon thought it wise to click on a twitter link marketing a simple family vacation. The U.S. Department of Defense has thousands of social media accounts, used as means of communication between personnel, friends and family. This proved to be a huge liability.

    What Are Some Examples of Cyber Crimes?

    28. In 2017, Wikileaks released more than 8,761 classified CIA documents.

    (The Guardian)

    The biggest ever leak of confidential documents from the CIA, this info describes in great detail the way that the CIA breaks into phones, communication apps and other electronic devices.

    29. In 2018, 500 million guests were compromised in the attack on the Marriott hotel chain.

    (BBC)

    Leaked info from this web crime included passport info, credit card details, as well as names & phone numbers of guests who checked into the Starwood properties on or before Sept 10 the same year.

    30. In 2017, Yahoo admitted that 3 billion user accounts were hacked

    (The New York Times)

    Namely, all of them. The first time Yahoo came out with this info was in 2016, when only 500+ million breaches were accounted for, so it took a while to even realize the true scope of the breach. Global cyber crime statistics show that this is still the biggest breach in history and is not expected to be overtaken.

    31. In 2016, FriendFinder Networks Inc was attacked, leaking 339 million personal accounts.

    (CSO)

    As this is a dating and adult entertainment site, the particularly sensitive nature of the leaked information like sexual orientation and if a user was looking for extramarital affairs caused significant emotional harm. This is still one of the biggest breaches in this field.

    32. In 2015, The Ashley Madison breach leaked info on 32 million users 

    (Reuters)

    The results varied from disheartening to downright tragic. With Ashley being primarily an adultery dating site, the data breach lead to numerous divorces, even suicides. Talking about distressing cybercrime incidents, this cost a staggering $11.2 million in lawsuits. 

    33. In 2017, 2.4 million records containing personally identifiable information was stolen from Equifax.

    (FTC)

    This data analytics and technology company reported a huge data breach that affected 147 million people. The company agreed to pay settlements of around $425 million.

    34. In 2015, Anthem Inc. experienced a data breach that affected around 80 million people.

    (Reuters)

    Above, we mentioned the theft of healthcare data. One of the most well known cases leaked info containing social security numbers, medical IDs, birthdays, addcyber theftresses, names, even income data.

    Famous Cybercrime Convictions

    Arrests and convictions for cybercrime are very rare. This is because the perpetrators are hard to identify, and they often operate from countries that have no extradition agreements with targeted countries. But every once in a while, a cybercrook gets caught and convicted.

    35. Mark Vartanyan accessed personal info from 11 million computers worldwide, causing $500 million in losses.

    (Crebs On Security)

    This hacker was convicted of cyber theft and developing, maintaining and distributing malware between 2012 and 2013, and then again in 2012.

    36. Susan Atrach hacked into celebrity email accounts in 2018.

    (Mirror)

    This 21-year-old was charged for a number of crimes after having hacked into Selena Gomez’s email account, taking hold of sensitive, personal data. Her crime involved stealing computer data to conduct fraud, identity theft, obtaining money or data using illegal means and hacking into celebrity accounts.

    37. In the UK, four in ten businesses were subject to cyberattacks in the past 12 months.

    (Gov.uk)

    Moving on to cybersecurity statistics in the UK – the 2021 Cyber Security Breaches Survey these attacks cost every business £8460, per successful attack, on average. This amounts to billions of pounds, not counting the emotional damage and personal costs of buying into various types of fraud. Many small businesses close after suffering such an attack.

    38. Hackers can make up to $2 million per year.

    (Dark Reading)

    When answering the question how much money do cyber criminals earn, one must consider their level of expertise, whether they belong to an organization, and how many projects they are working on. Particularly successful cybercriminals make $167,000 every month. A middle-of-the road hacker makes up to $75,000.

    39. $262.4 billion was spent on cybersecurity in 2021, and it will grow to $459 billion in 2025.

    (Cybersecurity Ventures)

    The ever-increasing number of cyberattacks and data breaches is forcing companies of all sizes across the world to invest in security. So how much money do companies spend on cybersecurity has increased in recent times, in part because of the new regulations imposed by the General Data Protection Regulation (GDPR), a shifting buyer mindset, an increased awareness the importance of cybersecurity, and the overall evolution to a digital business strategy.

    40. The starting cyber security assessment cost for a business with at least 50 employees is around $10,000.

    (TrustNet)

    The answer to the question how much does a cyber security assessment cost requires a multifactor analysis that relies on the individual scope, size, and complexity of your business, your industry (some are high-risk, and some are not), the size of your organization, number of offices, and even details like the complexity of your company’s inner workings.

    In the case of evaluating the cost for a cybersecurity and security risk assessment, most analysts advise checking the total cost of ownership, which involves your methodology, experience, and finally, product quality and value.

    Cybercrime Statistics by Country:

    41. An estimated 47% of all computers in China are infected by malware.

    (Statista)

    According to data available, the runner-up is Turkey with 42.88% of all computers infected… followed by Taiwan, with 38.98%.

    42. In 2017, there was an average of 24,089 records breached per country.

    (Purplesec)

    India was by far the leading nation with as many as 33,000 breaches. The USA counted 28,000.

    43. Chinese cyber attacks accounted for over 35% of all cyber attacks in India in 2019.

    (Indian Defence Review)

    In 2019, India experienced 50,000 cyberattacks from China alone. Other countries that targeted India were Slovenia, Ukraine, the Czech Republic, and Mexico.

    Conclusion

    Cybercrime is on the rise and we are becoming more and more dependent on technology, from our smart devices, to databases in schools and hospitals. The biggest hope in overcoming these issues seems to lie in sophisticated security techniques, and most of all, educating the general public as well as employees about cyber security facts.

    Many companies lose millions of dollars on lawsuits caused by cyberattacks. Cybercrime has become a well thought-out, complex, and expensive form of organized crime. This is why any company with a good sense of risk assessment ought to get some sort of cybersecurity for their system. And don’t forget, educating your employees and protecting your IoT devices is a must if you don’t want to be featured in our next cybercrime statistics article.