Category: Blog

  • Intriguing Amazon Alexa Statistics You Need to Know in 2024

    Intriguing Amazon Alexa Statistics You Need to Know in 2024

    The use of smart speakers is increasing globally, and many consumers are keeping up with this trend. Alexa has become a household name for consumers, businesses, and more. The answers are in the facts. If you look at the recent Amazon Alexa statistics, you’ll understand its global impact.

    From its demographics to its effect on the global market, this article explains how Amazon Echo is set to become an integral part of our lives. 

    However, many questions have been raised due to its popularity.

    Is it a practical device?

    Is it safe?

    How useful can it be for work and leisure time?

    Well, check out the latest numbers and see for yourself.

    Alexa Demographics & Fascinating Stats (Editor’s Choice)

    • Since its launch, Alexa has gained more than 100,000 skills
    • In 2020, almost seven in ten smart speaker users in the US used Amazon Echo
    • About 100,000 smart home devices support Alexa
    • In 2020, around 10.8% of digital buyers relied on Amazon Alexa for online shopping
    • In 2020, Amazon made up over half of the US smart speaker market share by brand
    • By 2025, 130 million Amazon Echo speakers are projected to be shipped worldwide
    • In Q1 of 2021, Amazon shipped over 20% of all smart speakers globally

    Amazon Echo Demographics Statistics

    People’s curiosity for using smart speakers has sparked in recent years. Digital natives from different age groups and backgrounds have become accustomed to using Amazon Echo. With these ongoing developments, let’s take a look at its domestic and global reach.

    1. Almost 70% of smart speaker users in the US used Amazon Echo in 2020. 

    (Tech Crunch)

    Amazon Echo is still dominant in the world of smart speakers. As studies show, 69.7% of American citizens used Amazon Echo in 2020. This percentage dropped slightly by the end of 2021, reaching 68.2%, but it doesn’t shake up the status quo. 

    2. As Amazon Alexa competitors statistics show, Google Home had 25% market share in 2019. 

    (Globe Newswire)

    As per the Amazon Echo stats of the same survey, Alexa/Echo dominated the market that year, with 70% market share. Having 5% of the market share, Apple HomePod took the third place. 

    The survey covered several countries — the US, the UK, India, Australia, Japan, Brazil, Germany, China, South Korea, Russia, Indonesia and France. 

    3. Alexa has gained over 100,000 skills since its launch. 

    (Statista)

    Amazon Alexa is an AI-powered virtual assistant developed by Amazon. The more commands it receives, the more skills and information it learns. 

    According to Amazon Alexa facts, Alexa started with only 130 skills. However, that number increased to 100,000 skills in only six years. The progress is truly remarkable, considering that Alexa was launched in November 2014.

    4. In the US, Alexa’s number of skills reached 70,729.

    (Statista)

    As more and more people use Amazon Alexa, its ability to receive and execute commands will only improve. If we look at the impact of Alexa by country, the US has become its most significant learning environment and primary consumer market. Reportedly, the number of Alexa’s skills reached 70,729 in the United States. 

    5. Meanwhile, Amazon Alexa has grown to learn 36,341 skills in the UK.

    (Statista)

    Although fewer than in the US, Alexa has gained a significant number of skills in the UK, reaching 36,341 in January 2020.

    6. Amazon holds the highest ranking in the market for smart speakers, accounting for 21.7% of smart speaker purchases globally. 

    (Statista)

    Ever since its global launch, Amazon has been conquering the smart speaker market. As the Amazon Alexa sales show, it held the top position in the global market in 2019. More specifically, it accounted for over 21.7% of smart speaker purchases worldwide.

    7. 79% of digital buyers from the UK had an Amazon Echo in 2019. 

    (Statista)

    Aside from the US, other countries are also catching up with smart speaker hype. If we analyze the Amazon Echo user demographics, we can conclude that almost 80% of digital shoppers from the UK owned an Amazon Echo in 2019. 

    8. The international version of Amazon Alexa supports only three languages. 

    (The Ambient)

    Even though Alexa can speak English, Italian, French, Japanese, German, Portuguese and Spanish, only three languages are available on the international version—English, Spanish, and German. 

    9. 33.6% of smart speaker users in Spain have an Amazon Echo. 

    (Statista)

    Spain has also become more digitized in recent years. According to Alexa statistics, an estimated 33.6% of smart speaker consumers in Spain use an Amazon Echo. Google is in the lead with 35% of users. 

    10. 53% of American users are satisfied with Amazon Echo.

    (Statista)

    While its popularity is rising, customer satisfaction is not lacking either. According to recent studies on Alexa’s client base, more than half of US users are very satisfied with Amazon Echo functions.

    Amazon Echo Market Share Statistics

    The smart speaker industry is moving fast, with the number of units hitting 163 million in 2021. To learn more about it, check out the following statistics. 

    11. Amazon accounted for more than 50% of the US smart speaker market share by brand in 2020. 

    (Voicebot)

    The purchase and usage of smart speakers have become more of a trend in the modern era. According to smart speaker statistics, Amazon is the leader in the industry. The Amazon market share on smart speakers in the US accounted for 53% in 2020. 

    12. 18% of millennials use Amazon Alexa for voice-assisted shopping. 

    (Voicebot)

    Different generations are becoming more familiar with smart speakers and their functions. Millennials who are now a considerable part of the population use Alexa for various reasons. As seen from Amazon Echo facts, around 18% of them use Amazon Alexa for shopping-related purposes. 

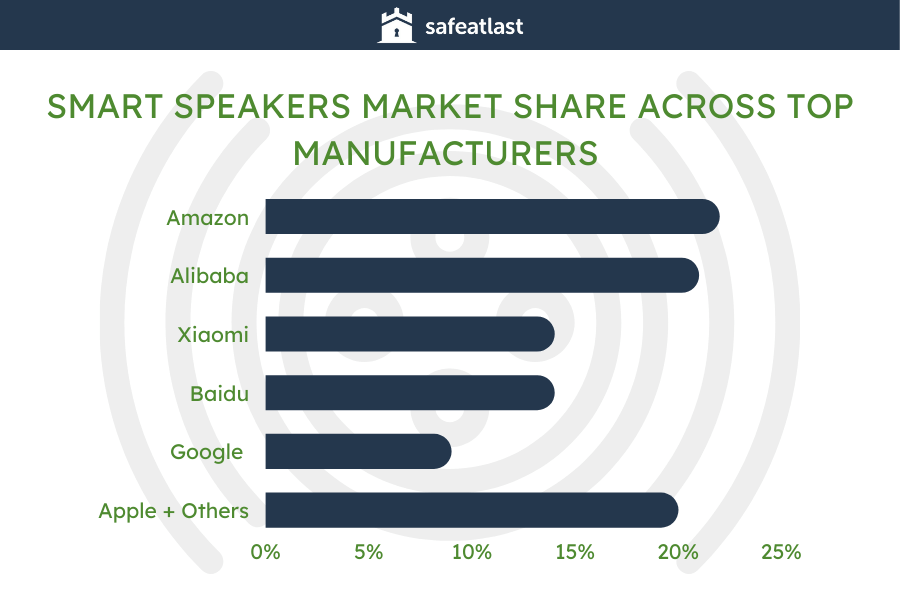
    13. In the first quarter of 2021, Amazon shipped around 22% of all smart speakers worldwide. 

    (Tech Hive)

    Alibaba was right after Amazon, shipping 21% of the smart speakers during that period. Moreover, Xiaomi and Baidu accounted for 14% each, and Google’s market share was 9%. The remaining 20% were divided by Apple and other manufacturers. 

    Amazon Alexa Statistics

    14. In January 2019, Amazon Echo Dot had the biggest market share. 

    (Voicebot)

    According to smart speaker statistics, its market share was 31.4%. Moreover, it was more popular than Echo, Echo Spot, Echo Plus, and Echo Show — Amazon’s higher-priced products. As for Google, the Home and Home Mini were equally popular, each having an 11.2% share.

    15. Amazon retains the top spot for smart speaker sales globally. 

    (Voicebot)

    With the world put on pause because of the pandemic, several industries’ sales markets have slowed down considerably. This effect includes the smart speaker market. 

    However, Amazon has retained the top spot in global sales for Amazon Echo despite a slight decline. According to Alexa web statistics, Amazon accounted for 23% of the global sales for smart speakers in the first quarter of 2020, which was more than all its competitors. 

    16. Since 2020, Alexa has become compatible with over 100,000 smart home devices. 

    (Statista)

    One of the main concerns when buying a smart speaker is that it may not be a practical choice for you if you’re building a smart home. However, this problem is solved thanks to Amazon Echo’s increasing compatibility.

    As Amazon Echo stats show, Alexa is now compatible with 100,000 smart home devices. That’s a 40% increase since 2019 when Alexa was compatible with 60,000 devices. Ranging from voice-activated lights to automatic smart door locks, you can connect almost any device to a smart speaker.

    17. Approximately 10.8% of digital buyers used Amazon Alexa for online shopping in 2020. 

    (eMarketer)

    More and more consumers consider using smart speakers and voice assistants for shopping. According to Alexa facts, around 10.8% of consumers used Amazon Alexa for at least one purchase in 2020. That percentage increased to 11.5% by the end of 2021. That’s hardly surprising, considering that the volume of all global digital payments in the first half of 2020 increased by 21%.

    18. The third generation Echo Dot was the UK’s most purchased Amazon product during Black Friday in 2019. 

    (Statista)

    Another main concern for potential consumers is the affordability of smart speakers, which can be alleviated with seasonal and holiday discounts. In the UK, the Amazon Alexa sales growth soared during Black Friday.

    Many online buyers purchased the third generation Echo Dot. More precisely, 32.6 thousand units were sold, and it became the most purchased Amazon product in the UK.

    19. 130 million Amazon Echo speakers are expected to be shipped globally by 2025. 

    (Statista)

    With its continual growth over the years, Amazon is projected to make more sales soon. As Amazon Alexa trends show, about 130 million Amazon Echo speakers will be shipped to different parts of the world by 2025.

    20. There were 91,700 downloads of the Alexa App in the UK. 

    (Statista)

    Setting up an Amazon Echo in your home means you will have to utilize the Alexa app. iPhone users in the UK downloaded the app more than 91,000 times in February 2020 alone. 

    Amazon Echo Data Usage and Consumer Statistics

    Some of the main aspects of using Alexa are its availability, practical functions, and data usage. How practical is it to have a smart speaker in your house? Let’s find out. 

    21. For the most part, consumers use Amazon Echo more as a source of information than entertainment.

    (Voicebot)

    Smart speakers are multipurpose. Still, more than 60% of Amazon Echo users utilize this device to find information, as Amazon Alexa statistics show. Examples of such activities are checking the time, weather, and recent news.

    22. At least 63% of US citizens are familiar with Amazon Alexa. 

    (Voicebot)

    Considering the fact that people use the internet for everything from shopping and entertainment to business communication, it’s not surprising that smart speakers have become the norm. 

    Therefore, if we take a look at the Amazon Echo statistics, we can see that around 63% of the American population knows about Amazon Echo and its functions. At the very least, those who are 12 years of age and older know about Alexa.

    23. On average, Amazon Alexa uses 36MB of data daily. 

    (Good Home Automation)

    If you have a limited data plan, it’s worth knowing how much data Amazon Alexa uses. According to Amazon Echo data usage statistics, Alexa uses 36MB per day, which translates to 252MB per week or 1.08GB per month. The numbers are based on 30 minutes of music streaming, two smart-home commands, one question about the weather, and one general question. 

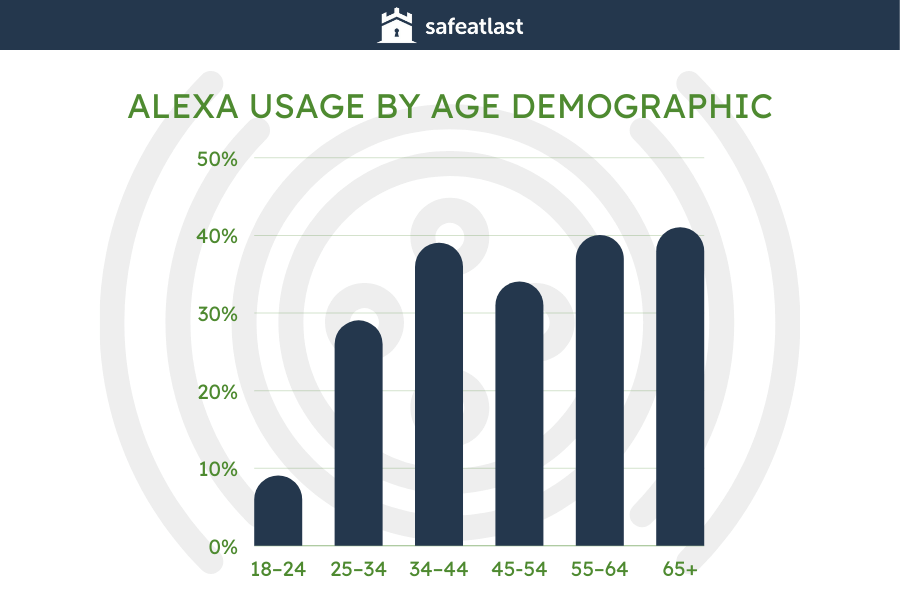
    24. A survey finds that 41% of people aged 65 and over use Alexa. 

    (eMarketer)

    Stats on Amazon Echo demographics reveal that younger people don’t use Alexa as much. Namely, four out of ten respondents aged 55–64 use Alexa, and 34% of those between the ages of 45 and 54 use it. 

    25. In the 34–44 age group, 39% of respondents use Alexa.

    (eMarketer)

    Moreover, the percentage is even lower for those 25–34 (29%). Alexa stats show that the lowest share of respondents using Alexa is in the 18–24 age group — 19%. 

    In comparison, Siri takes the leading role among adult Gen Zers, as six in ten voice assistant users 18–24 use it. 

    Even though Google Assistant doesn’t dominate any age group, it has a considerable share of users across the board. 

    Amazon Alexa Statistics #2

    26. Amazon extended the audio clip limit for Alexa from 90 to 240 seconds.

    (Voicebot)

    Recently, Amazon has upgraded Alexa functions to meet customers’ needs. One of those upgrades is the extended limit of audio clips that can be analyzed by the device. 

    From its original 90 seconds, Amazon Echo has increased the audio file time limit to 240 seconds, according to Amazon Alexa facts. This audio file time is more than double its former length. With this upgrade, it opens up more opportunities for a completely new set of uses. 

    27. 84.9% of Echo owners used Amazon Alexa to set a timer at least once. 

    (Voicebot)

    Aside from asking for information, Amazon Alexa is often used to assist with everyday tasks. According to more recent Alexa voice statistics, 84.9% of Echo owners have used the device to set a timer, followed by 82.4% who used it to play songs and 66% who used it to read the news. 

    28. There were 53.6 million Amazon Echo shipments worldwide in 2020.

    (Statista)

    Amazon Echo is one of the most sought-after smart speakers, and the number of sold items speaks volumes about its dominance. 

    According to Amazon Alexa statistics 2020, 53.6 million Amazon Echo speakers were sold in the same year. The number grew to 65 million in 2021. 

    29. More than 250,000 marriage proposals have been made to Alexa. 

    (Statista)

    Amazon Echo statistics affirm that Amazon Echo is one of the most popular gadgets, and interacting with Alexa is a daily occurrence. Thanks to artificial intelligence and machine learning, it can answer almost any question. 

    It’s also useful for entertainment and can even hold simple conversations. One of the more amusing facts is that more than a quarter of a million marriage proposals have been made to Alexa.

    Conclusion

    The sales growth and usage rate of Amazon Alexa have been increasing in many countries. Starting from North America, Amazon Alexa has gained millions of customers and became an integral part of thousands of households. Its usage rates have also increased exponentially in other countries. A stark example is the UK, where Amazon Alexa also dominates the market. 

    According to Amazon Alexa statistics, it’s main use is as a digital assistant for daily activities. For the most part, it gives information such as time, weather, and news reports. Moreover, Amazon Alexa can stream music, make to-do lists, set alarms, and control your smart video doorbell and various other smart home devices. Alexa is truly a multipurpose assistant—it can even be your personal sommelier if you don’t know which wine compliments your dish. According to some Amazon Echo facts and trivia, all you need to do is ask the “Wine Gal” for advice. 

    You can order food without getting off your couch or find a board game manual. Alexa can even help you plan a vacation. If you don’t want to spend a lot of money, you can simply ask your assistant to find a travel deal that suits your budget. One thing is certain — Amazon Alexa will continue to be the most convenient virtual assistant you can get.

    People Also Ask

    Does Amazon own Alexa?

    Amazon Alexa is a virtual assistant launched in 2014. It’s one of Amazon’s products, among many others, such as smart home gadgets and appliances. It’s available for purchase in multiple locations around the world.
    Moreover, current trends have played a significant role in getting Amazon to where it is today. It has been estimated that around 63% of US citizens know what Amazon Echo is and what it does for its digital users.

    How many users does Amazon Alexa have?

    In the US alone, stats show that around 70% of smart speaker users have an Amazon Echo in their homes. This number continues to grow as consumers shift toward voice-activated services.
    Therefore, it’s not surprising that many consumers use or plan on using Amazon Alexa. According to reports, there are 40 million Alexa users in the US alone. With the increasing number of devices Alexa is compatible with and skills it can learn, it’s expected that Amazon Alexa will have even more users in the future.

    Are Alexa and Siri the same thing?

    If we compare their primary functions, Alexa and Siri are rather similar. Both of them are virtual assistants based on AI that evolves and learns skills through client’s inquiries. If you interact with Alexa or Siri, you will get a verbal response.
    However, Alexa functions as a smart home assistant found in Amazon’s line of Echo smart devices.
    On the other hand, Siri is a virtual assistant built for Apple’s devices only. It’s typically connected to iPhones, and it comes in the form of Apple HomePod devices. Siri operates on a natural language processing program, while Alexa uses conversational artificial intelligence.

    Who is better, Siri or Alexa?

    Alexa and Siri are the top-ranked contenders in the battle of virtual assistants. Despite their similarity, their functions and abilities may not be ideal for every user. So, when it comes to the question of Siri vs Alexa, It all boils down to customers’ needs. 
    If you are looking to turn your home into a smart home that’s easy to control, Amazon Echo can be a practical choice. Moreover, according to statistics, Amazon Echo has more potential for automating daily tasks. For example, Alexa can help you with online shopping, manage connected appliances, and secure the house with a smart lock.
    On the other hand, Siri is more suitable for mobile users, especially those familiar with Apple devices. Instead of being a third-party device, Siri is usually built into the mobile devices’ systems. You can activate it for setting up schedules, sending emails, and calling people in your contact list.

    Is Alexa’s voice a real person?

    Even though Alexa’s voice sounds human, it was not originally a real person’s voice. Thanks to the woman behind Echo, Toni Reid, Alexa became the voice of modern technology. This voice-activated virtual assistant originated from the latest text-to-speech systems and artificial intelligence. 
    More updates have been added to the device for a friendlier, more human-like sound. For example, you can change an accent to match yours. Celebrities such as Samuel L. Jackson can also be heard on Amazon Echo. If you’re interested in adding personality to your smart speaker’s voice, Jackson is here to set your alarm, reply to your question about the weather, and more. 
    It’s not surprising that Amazon has decided to implement such neat features since voice search trends are expected to continue rising. According to Amazon Alexa statistics, 44.7% of consumers use smart speakers like Amazon Echo for voice search, and this percentage will only grow in the future.

  • 22 Hopeful Solar Energy Statistics to Excite You in 2024

    22 Hopeful Solar Energy Statistics to Excite You in 2024

    The sun has been an essential resource for humanity since the dawn of time, and Bell Laboratories made the first solar panel in 1954. Since then, solar energy statistics show solar power as one of the fastest-growing industries in the United States.

    Solar power is the conversion of sunlight into electricity and is probably one of the most significant inventions of the 21st century.

    That said, we’ve put together some fascinating statistics that will help you understand just how much renewable energy has grown over the years and what the future holds. Without further ado, let’s jump into them.

    Essential Solar Energy Facts & Stats (Editor’s Pick)

    • Solar energy is accountable for around 1.7% of the US electricity generation
    • California installed 23 GW of solar capacity in 2019
    • At 205 GW, China had the largest installed solar capacity globally in 2019
    • In 2020, more than 2,400 kWh of electricity was generated from fossil fuels
    • Since 2000, solar energy production has increased, and coal production has decreased
    • Up to 97% of solar panels are recyclable
    • Since 2016, the US solar community has quadrupled
    • A home can save up to $30,000 over its solar panel system’s lifetime

    General Solar Energy Statistics

    Have you ever wondered how much solar energy the US generates and whether it is a leading country in solar energy generation?

    In the next set of stats, you can find the answers to these questions and much more. So, if you are interested, make sure you read on.

    1. Solar energy makes up 1.7% of the US electricity generation.

    (EIA)

    According to solar energy statistics from 2019, over 4,127 billion kilowatt-hours of electricity were generated in electricity generation facilities all over the US. Out of that number, 62.6% of the electricity was from fossil fuels, 19.6% from nuclear energy, and 17.6% from renewable energy sources.

    Solar Energy Statistics

    2. By the third quarter of 2021, the US had installed 113.5 GW of solar PV capacity. 

    (SEIA)

    According to solar energy statistics, that was enough to power almost 22 million people in the United States. Moreover, in the third quarter alone, it installed around 5.4 GW. 

    For the first time in the industry’s history, residential solar installations surpassed 1 GW and over 130,000 systems in only one quarter. On top of that, utility-scale solar installations reached another third-quarter high at 3.8 GW. 

    Based on some solar energy growth projections, we can expect that the annual installation of solar panels will only increase in the future. 

    3. In 2019, California installed 23 GW of solar capacity.

    (CNBC)

    California has been the leader in installing solar energy in the United States for a few years in a row. As almost 17% of California’s electricity comes from solar energy, it is no surprise that the country is the leader with more than 23 GW of installed solar capacity. North Carolina is second with around 4.5 GW of installed solar, and the third is Arizona with 3.6 GW.

    4. Asia dominated the global solar capacity expansion in 2019, accounting for around 60% of the total. 

    (Irena)

    When it comes to generating renewable energy by country in 2019, China, Japan, Vietnam, the Republic of Korea, and India were the countries with the highest amount of new capacity. 

    However, we can’t leave behind some other countries, which also showed substantial increases, like the US, Spain, Germany, Australia, and Ukraine.

    5. In 2019, China had the largest installed solar capacity (205 GW) globally. 

    (NS Energy)

    It produced 223.8 TWh of electricity. So, this statistic shows that, when it comes to the generation of solar energy, the percentage is the highest in China. More specifically, the Huanghe Hydropower Hainan Solar Park was China’s largest single solar project (2.2 GW). 

    Furthermore, the US accounted for the second-largest installed solar capacity (76 GW) and produced 93.1 TWh of electricity.

    6. A total of 1.47 million solar roofs were identified in the United States.

    (Clentecnica)

    Researchers at Stanford University made a solar energy report in which they mapped almost every solar roof in the US. Using the satellite, they correctly identified 93% of solar rooftops across 48 states and got the number of over 1.47 million of them.

    Interestingly, before this type of solar satellite mapping, scientists made solar maps by measuring the total amount of sunlight that arrived at a given spot.

    Solar Energy Statistics #2

    Solar Power Statistics

    These statistics are essential because they can help you better understand solar energy and solar energy generation. That said, in the next set of stats, you will see just how much solar power is generated in the US and learn a thing or two on community solar.

    7. The average US solar installation is about 5 KW.

    (Solstice)

    The solar energy facts and information tell us that the average US solar home has about 20 solar panels, and all of them generate about 5 KW. However, if you want to cover 100% of your energy usage, you may need more solar panels, especially if you live in a big house or have central air conditioning.

    Solar Energy Statistics #3

    8. In 2019, 72.3 billion kWh were generated from solar sources.

    (Statista)

    The renewable energy statistics show that the US invested a lot into renewable energy sources between 2000 and 2019. In 2019, 72.3 billion kWh were generated from solar sources, 273.7 billion kWh from conventional hydroelectric power, and 300 billion kWh from wind sources.

    9. In the first quarter of 2021, 131 MW of community solar was installed. 

    (SEIA)

    Compared to the first quarter of 2020, that was a 15% decrease. Moreover, the amount was nearly 70% lower than the last quarter of 2020. 

    However, lower first-quarter numbers don’t have to be signs of a long-term trend. The solar community is on the rise, and solar energy statistics from 2020 and 2021 show precisely that.

    10. The global investment in solar energy was $141 billion in 2019.

    (Statista)

    According to the solar panels stats from 2019, the world saw many new investments in the renewable energy sector. The investments in solar energy technologies came to $141 billion. The only industry that was supported more was the wind power sector that received over $142 billion. 

    11. Solar has ranked first or second regarding electric capacity added in the last seven years.

    (SEIA)

    In the last ten years, solar has achieved a growth of about 40%. The following fact on solar energy doesn’t come as a big shock since the solar capacity has ranked first or second for seven years in a row. However, 2020 saw the most significant success, as solar produced 43% of all new electrical capacity in the US — the largest share in history.

    12. 89% of adult US citizens supported solar farms in 2019.

    (Pew Research)

    The recent energy statistics show that the US has been investing more and more in renewable energy. In 2019, it had full support from US citizens — 9 out of 10 homeowners said they would install solar panels to save money on electricity bills. However, a mere 9% opposed it, and 2% were undecided. In addition, 83% of US citizens supported wind turbine farms, and only 14% were against them.

    Solar Energy vs. Fossil Fuels Statistics

    The difference between solar energy and fossil fuels is that solar energy is a renewable energy source, while fossil fuels are nonrenewable resources. You will see more significant differences between these two energy sources in the next set of stats.

    13. Electricity generated from fossil fuels costs 5–17 cents per kWh.

    (Consumer Affairs)

    Many consumers burn fossil fuels because they think it is much cheaper and more convenient. However, going solar can be a money-saver in the long term. Solar system statistics tell us that solar renewable energy is better for the environment and the average cost is somewhere between 3 and 6 cents per kWh.

    Solar Energy Statistics #4

    14. Over 2,400 billion kWh of electricity was generated from fossil fuels in 2020. 

    (EIA)

    That equated to fossil fuels (natural gas, petroleum, coal, and other gases), making 60.6% of the total electricity generation that year. Overall, more than 4,000 billion kWh of electricity were generated in US utility-scale electricity generation facilities in 2020. 

    15. Since 2000, solar energy production has gone up, and coal production has declined.

    (Pew Research, IEA)

    Statistics on solar energy use in the US show that solar has achieved the most considerable growth compared to any other energy source. 

    On the other hand, coal had its peak in 2008 when about 1.2 billion tons were mined. However, in 2019, coal accounted for around 36.7% of the total electricity production.

    Solar Energy Facts

    Many solar power and panel facts can be found on the Web. However, we’ve picked some of the most interesting ones that will surely catch your eye. So if you want to learn more about solar energy, keep on reading.

    16. SolarStar is the largest solar farm in the US.

    (Solstice)

    We will start with one of the most interesting solar power fun facts. When SolarStar was built back in 2015, it was the world’s biggest solar farm. Located in California, it now has over 1.7 million solar panels spread out over 13 square kilometers. That said, SolarStar produces about 579 MW of solar energy and can power 255,000 homes.

    17. “Solar photovoltaic installer” is the fastest-growing job in the US.

    (CNBC)

    The Bureau of Labor Statistics analyzed over 20 jobs to see which would achieve immense growth by 2026. Although several jobs had double-digit growth, solar power stats showed that the career that came first with the 105% growth was a solar photovoltaic installer. This is just one of many facts on how the solar energy industry will continue to grow in the future.

    18. 90–97% of solar panels are recyclable.

    (Solstice)

    This is just one of many facts about why solar energy is good for the environment and climate change. According to the solar panel statistics, 90–97% of all solar panels can be recycled into new ones or sold for a great price on any commodity market. Experts on solar energy also estimate that recyclable solar materials’ value will reach $15 billion by 2050.

    Solar Energy Statistics #5

    19. The average home can save $10,000–$30,000 over its solar panel system’s lifetime.

    (EnergySage)

    Solar panels are not just great for the environment; in addition to smart home systems, solar panels can help you save some money as well. However, many factors impact the amount of savings. 

    In detail, some of the most critical ones are local electricity rates, the angle and size of the home’s roof, and direct sunlight during the day. That is to say, according to solar panel stats, Massachusetts is the state with the greatest 20-year-period savings in the US ($42,021). 

    20. The US community solar capacity has quadrupled since 2016.

    (E360)

    One of the many interesting solar power facts is that the solar community has become four times bigger in four years. In other words, the solar community generated 300 MW in 2016, while now it is generating more than 1,400 MW, which is enough to power 266,000 households.

    21. Solar panels don’t need direct sunlight to generate electricity.

    (Harrisons Energy)

    If we take a closer look at the solar panel facts, we can see that solar panels don’t need direct sunlight to generate power. The photons in the natural daylight are responsible for solar panels generating electricity, so they don’t need exposure to direct sunlight to produce energy.

    22. The first solar panel was invented in 1940.

    (Axpo)

    Although Alexandre Edmond Becquerel discovered the photovoltaic effect in 1839, one of the most attractive solar panels facts shows that it took about 100 years to invent the first solar panel. Russell S. Ohl developed the first solar panel in 1940, and Bell Laboratories designed the first commercial solar panel in 1954.

    Conclusion

    Solar energy is one of the cleanest energy sources as it doesn’t produce any pollutants. It is a renewable energy source that requires low maintenance and is easy to install.

    We can see from these facts about solar energy that more and more people and governments have turned to solar energy as they feel they can contribute more to the environment.

    That said, if solar energy is harnessed as it should be, it can satisfy all future energy needs. Hopefully, these statistics will help you realize that solar power has a vital role in the fight against climate change.

    People Also Ask

    How common is solar energy?

    According to the latest statistics, solar is the most popular renewable energy source, and it has become the favorite type of electricity. On a global scale, renewable energy sources made up 24% of electricity generation back in 2014. The latest statistics also show that solar energy sources will only grow in the future. For example, solar generation made 11% of the total US renewable energy generation back in 2017. It is estimated that it will make 48% of US renewable energy by 2050, which makes it the fastest-growing electricity source.

    Is the solar industry growing?

    The solar industry is the fastest-growing renewable energy industry in the US. For instance, the solar energy market was valued at over $52 billion in 2018 and is expected to reach over $223 billion by 2026. We should also note that solar energy use has undergone massive growth since the early 2000s and has experienced a 49% growth rate every year. Moreover, more than one million US homes have solar panels and are being powered by solar energy.

    How much solar energy is used in the US?

    Solar energy makes 1.6% of the total US electricity generation. In 2019, electricity generation facilities all over the US generated 4,118 billion kWh of electricity, while 63% of the electricity was from fossil fuels, 20% from nuclear energy, and 18% from renewable energy sources. In addition, 3.4 acres of solar panels are required to generate one gigawatt of electricity over a year.

    Which state has the highest solar capacity?

    The United States is the world leader in generating renewable energy with over 67,885.000 GWh. Additionally, in the US, California is the leader in solar energy usage, with nearly 17% of its energy coming from 23 GW of newly installed solar capacity. In second place is North Carolina with 4,308 MW, in third Arizona with 3,400 MW, and in fourth is Nevada with 2,595 MW of installed solar capacity.

    What percent of the world’s energy comes from solar power?

    The U.S. Energy Information Administration (EIA) made a report in 2015 about solar power, estimating that approximately 12% of world energy consumption came from renewable sources such as geothermal, hydropower, biomass, solar, and wind. Facts suggest that world energy consumption from renewable sources will increase to 17% by 2040.
    That said, Asia is the leading continent regarding solar energy generation. Here are the top five countries that generate the most solar energy — the United States, China, Italy, Japan, and Germany.

    How many people use solar energy?

    The US has more than 1.3 million solar installations, with over 40 GW of generation capacity. The latest statistics show that 1 MW of electricity can power 164 homes, so 40 GW is enough capacity to power 6,560,000 American households.
    However, solar remains the third most important renewable energy source in terms of worldwide installed capacity. Hydro and wind lead the way as the essential renewable energy sources in 2020, with solar energy not that far behind.

    Which country uses the most solar energy?

    As Asia is the leading continent regarding solar energy, it comes as no surprise that China is the leading country with an immense solar capacity of 130 GW more than any other country. It still holds the record for the largest operational solar project conducted in 2018. One of the most exciting facts about solar power is that Los Angeles is the leader in installed solar PV capacity.

    What are three important facts about solar energy?

    Out of many amazing facts regarding solar energy, the following three are the most important ones. The first is that more and more people are installing solar panels to reduce electricity bills. Second, solar power is clean and does not contribute to climate change. The third and most important fact is that solar energy is the future. From these solar energy statistics, we can see that the solar community in the US became four times bigger in the last four years, which is proof of the statement mentioned above.

  • Is Siri Better Than Google? – 16 Interesting Siri Statistics

    Is Siri Better Than Google? – 16 Interesting Siri Statistics

    Siri was first released back in 2011 and has truly revolutionized the way people interact with content on the web. Siri statistics show that it is still very popular, and it is not hard to see why. This smart voice assistant recognizes voice queries and comes up with the best answers and solutions.

    Millions of people use these devices nowadays, and they have many options to choose from. Besides Siri, there is also Alexa, Google Now, Cortana, Bixby, and numerous others.

    However, it is still one of the most popular smart assistants out there. Is it because it was the first of its kind, or is it because it is still the best? Let’s find out.

    Siri Stats that Prove the Future Is Already Here (Editor’s Picks)

    • More than one billion devices feature voice assistant services
    • There are  500 million devices featuring Siri
    • About 45% of people keep their smart speakers in the bedroom
    • 25% of people buy household items using voice assistants
    • 98% of smartphone users have tried Siri
    • 62% of iPhone owners use the assistant in their cars
    • Siri uses an average of 63 kB per query
    • Only 6% of people use Samsung Bixby

    Siri Statistics to Consider

    1. Latest available data shows that Siri is used on 44% of smartphones in the U.S.A.

    (Voicebot)

    Based on the results of a survey that included 1040 U.S. citizens, 44% of smartphone users prefer Siri to any other virtual helper. Google Assistant is second with 30%. Amazon Alexa holds third place with 17%. Samsung and its Bixby assistant came fourth with just 4%.

    2. There are  500 million Siri voice assistant devices.

    (Voicebot)

    Apple casually shared the information that Siri was available on half a billion devices around the globe. This seemed to be a direct stab at one of the greatest Siri competitors; despite its global dominance in other areas Google Assistant has exactly the same result.

    3. 98% of smartphone users have tried Siri but most of them don’t use it.

    (9to5mac)

    Although Apple might boast that 98% of users have tried Siri, the truth is that a lot of people don’t really use it. The high percentage can be explained by the fact that models after the iPhone 4S come with pre-installed Siri and most users are willing to try it once or twice.

    What are voice assistants used for?

    Voice assistants are incredibly versatile so their actual usefulness depends on the user’s needs. In addition to providing answers to a range of questions, these assistants can make appointments, control home devices, play media files, and perform dozens of other tasks. Voice-controlled AI can be integrated into mobile apps (as it is the case with the Siri feature) or specially designed smart speakers.

    4. According to Siri user statistics, 62% of iPhone owners use the assistant in their cars.

    (Business Insider)

    Siri is the ultimate hands-free device so users can make calls, send out texts, or do research while driving. It’s safe and efficient, and can even assist you in combination with the GPS navigation system.

    5. 97% of iPhone users just don’t feel comfortable using voice search in public.

    (9to5mac)

    As useful as this technology can be, it is still far too overt in nature for many people. In fact, only 3% of iPhone users use technology like Siri online in public, instead opting to use it in the privacy of their homes or vehicles.

    6. Siri uses an average of 63 kB per query.

    (Ars Technica)

    One of the biggest complaints users had when Siri first came out was the fact that it seemed to use up a lot of data. Ars Technica decided to test this out and calculated that each query used an average of 63 kB. Considering it’s been nearly eleven years since the assistant was released, its data use is much less of an issue now.

    7. Siri voice search statistics show 90% of Siri users use it on their smartphones.

    (Statista)

    A 2021 survey conducted in the US showed that Siri was mostly used on mobile phones (90%). People who use it also like using it in their cars (16%) and via their earphones (8%).

    Apple’s Siri has been criticized for lacking innovation and having flawed speech recognition software, but that still didn’t affect its dominance on the market. This probably has to do with the fact that Siri was the first voice-enabled virtual assistant available and many people recognize the brand as the ultimate representation of the technology.

    8. Siri stats show that it lost 7.3 million users between 2016 and May 2017.

    (9to5mac)

    Despite its success on the market, the voice assistant still managed to lose 7.3 million monthly users in just a year. That number represented roughly 15% of its total U.S. user base.

    9. Only 6% of people use Samsung Bixby and around 5% use Microsoft Cortana.

    (Statista)

    Samsung seems to be losing the race with Bixby, which came to life in 2017. The fact that Bixby users have noted numerous functionality gaps, lack of data sync, and voice recognition problems isn’t helping. Microsoft’s Cortana is in a similar position, and the company itself acknowledges its failure to create a top-notch voice assistant.

    10. Statistics about Siri show that it makes up about a quarter of all Wolfram searches.

    (VentureBeat)

    Wolfram Alpha is Siri’s weapon of choice when it comes to unearthing scientific facts or solving mathematical problems. Unlike traditional search engines like Google, Wolfram doesn’t look for the answers on the internet. Instead it trawls through its own enormous but reliable database and computes the answer.

    11. Voice search statistics say that 25% of people say they most often buy household items using voice assistants.

    (SEJ)

    Second place on the list goes to buying apparel and entertainment, including movies and music, at 21.15%. In third place, 18.94% of users buy games with the voice assistant. Users are least likely to use voice search to find local services with only 3.52%.

    12. More than 45% of users keep their smart speakers in the bedroom. 

    (Voicebot.ai)

    This shows a shift in trends, as the living room was once the most popular place to put a smart speaker. It is now in second place, with 43.2%. The analysts suggest it is because smart speakers and voice search are becoming more important for our morning and evening routines.

    This smart home guide will show you how to make the most out of your smart speakers, as well as other smart devices.

    13. Today, more than one billion devices feature voice assistant services. 

    (Voicebot.ai)

    The most common way to interact with a voice assistant is via smartphones, then cars and, finally, smart speakers. The four biggest providers of voice assistants are Apple Siri, Google Assistant, Amazon Alexa, and Microsoft Cortana.

    14. Google Assistant read through 2865 romance novels to improve its linguistic abilities.

    (The Verge)

    Apparently, one of the best ways for AI technology to improve its communication skills is by reading a truckload of romance novels online. Google Assistant went through nearly 3000 raunchy novels to bring its conversation game to the next level.

    Siri Statistics: Key Takeaways

    This technology is taking over the world, and there is no doubt search by voice will take a leading role in the future. Why? Because in times when speed and convenience are the most important factors, the AI tech improves and smart assistants are offering faster and better results. The market is a battleground for IT giants with incredible resources at their disposal.

    Voice search statistics suggest younger generations will be more inclined towards this technology, starting with millennials, who are already quite interested in the concept.

    One of the main reasons why Siri is still one of the most popular virtual assistants out there is the fact that it has been on the market for so long. People recognize the brand and trust its reputation above all. For many users, Siri is the very definition of a smart assistant, and the Siri usage statistics prove it.

    However, some studies suggest users are dissatisfied with the lack of innovation and overall improvement of the software. If Apple wants to stay in the lead, the company will have to show its users that it – and more specifically Siri – is ready to listen.

    Overall, this technology is still fairly new and has a long way to go. That said, healthy competition in the industry is pushing voice assistants to improve rapidly.  Hopefully the major players won’t let us down.

    People Also Ask

    What percentage of searches are voice?

    58% of the US online adult population has used voice search at least once, while more than 33% of them use it at least once a month. Moreover, almost half of the voice search users (47.2%) expect to increase their voice search frequency. The numbers for smart speaker owners are even higher—about 89% of them use voice search regularly, and almost two-thirds of them intend to increase usage.

    Who is smarter, Google or Siri?

    A company called Loup Ventures tested all the major smart speakers by asking them to answer 800 questions. Google Assistant managed to get 87.9% of the answers correct, while Siri came in second with 74.6%. The two smart assistants function differently when it comes to sources. While Google goes through the information available online, Siri uses Wolfram to answer questions. It is software that computes the answer based on scientific, reliable databases.

    Is Alexa better than Siri?

    The two smart assistants are a bit different. Amazon Alexa uses Bing’s search engine for her search queries, while Siri relies on Wolfram, specialized software that goes through reliable scientific sources.
    Although it’s a small difference, Siri seems to be slightly smarter than Alexa based on research by Loup Ventures. Alexa answered 72.5% of the 800 questions it was asked. Siri statistics show that it managed to answer 74.6% of them correctly.

  • 29 Alarming Violent Crime Statistics To Raise Awareness

    29 Alarming Violent Crime Statistics To Raise Awareness

    Violent crime highlights humanity’s ugly side. That’s why the law is very hard on violent crime perpetrators. Nevertheless, the latest violent crime statistics show that this kind of crime still occurs quite frequently. In fact, some forms of it happen at alarming rates.

    To shed more light on this issue, we gathered a series of insightful data on violent crime. This collection will show you just how the situation with violent crime in the US has developed over the years.

    From aggravated assaults to robberies, you’ll see dozens of stats that outline the most pressing violent crime problems in the United States. We’ll also present you with statistics from other countries around the world.

    While solving this problem is ultimately the authorities’ role, the best way to initiate change is to spread awareness.

    Top Stats on US Violent Crime Rate (Editor’s Pick)

    • In the United States, a murder happens every 32.5 minutes
    • In 2019, there were 1,690 homicides in California
    • There were more than 21,570 murder and manslaughter cases in the US in 2020
    • In 2019, D.C. had a reported crime rate of 1,049 per 100,000 people
    • The murder rate in Los Cabos, Mexico, is 111.3 per 100,000 people
    • Aggravated assaults comprised almost 70% of violent crimes in 2019
    • In 2019, 73.7% of murder cases in the US involved a firearm

    Recent Trends in US Violent Crime

    1. Most recent info suggests that one murder happens every 32.5 minutes in the US.

    (FBI)

    FBI violent crime statistics show that an instance of violent crime takes place every 26.2 seconds. Rape happens every 3.8 minutes, one robbery takes place every 1.9 minutes, and an aggravated assault occurs every 39.2 seconds.

    From this data, it’s clear that murder is among the rarest types of violent crime.

    2. In 2019, 7,484 murder victims in the US were Black individuals.

    (FBI)

    The data on homicide by demographic highlights that Black individuals make up a disproportionate number of victims per year.

    Violent crime statistics by race show that, out of 13,927 murder victims in 2019, almost half were Black males. To be more precise, 6,446 Black males and 1,035 Black females were victims of murder.

    Meanwhile, 5,787 white people were murdered in 2019. Out of those, 4,026 were males, and 1,759 were females.

    3. The US recorded over 21,570 murder and manslaughter cases in 2020.

    (Statista)

    Homicide and manslaughter rates have been descending over the years. Except for a few spikes, these rates have slowly been going down since the 1990s.

    To illustrate, national crime statistics show us that 2019 saw a slight decrease in murder and manslaughter cases than the previous year. However, there was a substantial increase in 2020 that hadn’t been reported since 1995. 

    4. In 2020, the United States reported 921,505 aggravated assaults.

    (Statista)

    An aggravated assault usually involves some sort of weapon with which the attacker can inflict a serious injury.

    According to violent crime statistics from 2019, when there were 822,017 cases of aggravated assault, that was the only type of crime that recorded a rise in the number of criminal cases in recent years. In 2018, there were 810,982 such cases.

    5. 243,600 robbery cases were reported in 2020.

    (Statista)

    Similar to murder cases, the number of robbery cases has also gone down over the years. Back in 1990, there were 639.270 reported instances. Although generally declining, they experienced a slight increase during the Great Recession from 2007 to 2009.

    Violent crime statistics show that the number of robbery cases is significantly higher than the one of murder cases.

    6. 126,430 rape cases were reported in 2020.

    (Statista)

    Unlike robbery and murder, rape cases’ trajectory hasn’t been nearly as steady. Over the decades, it has seen several dips and jumps. For example, the number of cases shot up from 85,141 to 143,765 between 2012 and 2018.

    Moreover, violent crime statistics in the US show that the number of rape cases has fluctuated in the last few decades. Law agencies reported 109,060 cases in 1992. From there, the number nosedived till 1999, when it reached 89,411 instances.

    In 2000, the number of rapes started growing again. Crime statistics in the USA show that they increased from 90,178 to 95,235 in 2002. 

    7. In 2019, California recorded 1,690 murder cases.

    (Statista)

    California has the largest population in the United States. Therefore, it makes sense that it also has the greatest number of violent crimes happening within its borders.

    Looking at the data on US murders per year, we can see that California had the most murders in 2019. Next on the list was Texas with 1,409, and the third was Florida with 1,122 murders.

    These three states also happen to be the ones with the most people. On the other end of the spectrum, Vermont and Wyoming, two of the least populated states in the US, had 11 and 13 cases, respectively.

    Highlights of the Violent Crime Rates in the US

    8. The arrest rate of violent crimes was 156.3 per 100,000 citizens in 2019.

    (FBI)

    Violent crimes happen less often than property crimes. The 2019 rate of the former was 366.7, while it was 2,109.9 for the latter. But proportionally, there are significantly more arrests for violent than for property crimes. In comparison, the arrest rate for property crimes was 343.3 per 100,000 citizens.

    9. For Black males, the murder rate per 100,000 people is 8.3 times higher than that of white males.

    (BJS)

    When we look at the US homicide rate, we can see that the Black males’ rate is 18.5 per 100,000 persons, while the white males’ rate is only 2.8. On the other hand, the Native American murder rate is 4 cases per 100,000 people. Meanwhile, the Asian rate is only 1.3—the lowest of all ethnicities in the United States.

    10. The rate of murder and nonnegligent manslaughter was five cases per 100,000 residents in 2019.

    (Statista)

    The 1990s had the highest crime rates in US history, violent or otherwise. For example, back in 1991, there were 9.8 cases per 100,000 residents. Nowadays, they’re remarkably low compared to that decade.

    11. Murder and manslaughter had a clearance rate of 54.4% in 2020.

    (Statista)

    Crime clearance means arresting a person for the crime they’ve committed and bringing them to trial. Alternatively, it can refer to a situation where a said person cannot be brought to trial because of uncontrollable situations (like death).

    According to violent crime rates, murder and manslaughter had the highest clearance rate in 2020. In second place was aggravated assault, with a rate of 46.4%. Overall, violent crimes had a 41.7% clearance rate.

    Property crimes had a significantly lower crime clearance rate of 14.6%. Out of these, different types of burglary and motor vehicle theft had 14% and 12.3% clearance rates, respectively.

    Violent Crime Statistics by State

    12. The District of Columbia’s violent crime rate in 2019 was 1,049 per 100,000 residents.

    (Statista)

    The District of Columbia had the largest number of violent crime cases per 100,000 people in 2019. In fact, it had the highest rate by a wide margin. The other two states that made the top-three list were Alaska and New Mexico, with 867.1 and 832.2 crime rates, respectively.

    The violent crime rate by state shows that all three states were far above the national average of 379.4 cases per 100,000 people. A total of 22 US states had above-average violent crime rates. With 381 cases for every 100,000 residents, Colorado had the rate closest to the average.

    13. In 2020, Maine had the lowest violent crime rate of 108.6 cases per 100,000 residents.

    (Statista)

    New Hampshire and Vermont were also among the safest countries in the US, with 146.4 and 173.4 violent crime rates per 100,000 citizens, respectively. These three states had the lowest violent crime rates by state in the US in 2020. 

    14. Louisiana has a homicide rate of 12.4.

    (World Population Review)

    Louisiana has an alarmingly high homicide rate, the highest in the United States. We can see the proof of this claim in the violent crime statistics from 2021. Just to compare, the other two countries with the highest homicide rate are Missouri and Nevada, with 9.8 and 9.1 homicide rates.

    15. Detroit had a violent crime rate of 1965.33 crimes per 100,000 residents in 2019.

    (Statista)

    According to violent crime statistics by the city, Detroit had the highest number of violent offenses in 2019.

    St. Louis was the second-most dangerous city with 1927.32 cases. Meanwhile, Memphis was third, reporting 1901.42 crimes per 100,000 citizens.

    16. The sexual assault rate in Alaska is 161.9.

    (World Population Review)

    Sexual assault statistics show that Alaska has an abnormally high number of rapes per 100,000 residents.

    The state’s rate is almost four times bigger than the average national US violent crime rate for this category. Despite this extremely high rate, rape isn’t the most common violent crime in Alaska. That would be aggravated assault.

    Apart from sexual assault, Alaska also has the third-highest crime rate in the US. Its authorities report 3,777.89 cases per 100,000 people. Violent crime makes 21% of all crimes in Alaska, whereas 79% are property crimes.

    Violent Crime Statistics by Country

    17. The city of Los Cabos in Mexico has the biggest murder rate in the world — 111.3 per 100,000 people.

    (Statista)

    All these statistics probably sound very concerning to you. But you’ll get a clearer picture of the situation when we compare the rates in the United States to those in other countries around the world.

    Violent crime rates by the city show that Los Cabos, Mexico, has the greatest number of murders per 100,000 people. Not far behind is Venezuela’s capital, Caracas, with a similar murder rate of 111.2.

    Interestingly, the majority of the world’s most dangerous cities are located in Central and South America. Cities like Acapulco, Natal, Tijuana, la Paz, and Fortaleza are in either Mexico or Brazil.

    The United States also has the highest violent crime rates by country, though only four cities are present on the said list. In the ascending order of crime rates, we have Detroit, New Orleans, Baltimore, and St. Louis.

    18. Australia has a homicide rate of 0.94 per 100,000 people.

    (World Population Review)

    In terms of homicides, Australia is considered one of the most peaceful countries worldwide.

    On the other hand, the Australian violent crime rate for rapes is relatively high. Research shows that the country’s rape rate is 28.6 per 100,000 citizens.

    While it is much lower than in South Africa (132.4) or Botswana (92.9), it’s far from the country with the lowest number of recorded rapes per 100,000 people (Azerbaijan with 0.2).

    19. El Salvador has the highest murder rate of 82.84.

    (World Population Review)

    According to the data on the violent crime rate by country, El Salvador has the highest murder rate per 100.000 residents. Jamaica is second with 57, and Honduras is third with a 41.7 murder rate.

    Violent Crime Statistics

    20. The highest rape rate is in South Africa—132.4.

    (World Population Review)

    South Africa has an extreme incidence of rape, outpacing any other country in the world. In second place is Botswana, with a 92.9 rate. The third is Lesotho, with an 82.7 rape rate.

    If we rank the countries by violent crime rate, South Africa is among the top five with 35.9. It sits just under Belize with 37.9.

    21. Japan’s homicide rate is 0.28.

    (World Population Review)

    Generally speaking, Asia is the continent with the lowest violent crime rates. Japan takes first place in Asian countries. Second is Indonesia with a homicide rate of 0.5, while in third place is China with a rate of 0.62 per 100,000 inhabitants.

    The Japanese violent crime rate is also very low regarding rape—1 case per 100,000 people.

    22. The crime rate in the UK is 96.4 per 1,000 people.

    (Statista)

    Regarding countries, England and Wales have the highest crime rate of 102.8, while Scotland recorded the most significant crime rate decrease, from 82.6 in 2002/03 to 45.1 in 2019/20.

    23. The number of homicides reached 809 in the United Kingdom in 2019/20.

    (Statista)

    UK violent crime stats show an increase in the number of homicides in 2019/20 compared to 2018/19. More precisely, the 2019/2020 period had 40 more cases than 2018/2019, during which 769 cases had been reported. This rise is related to a cut in resources and workforce UK law enforcement agencies experienced at the time.

    All the same, the figures show an overall decline in the homicide rate in the last 15 years. For example, the violent crime statistics by year show much higher numbers for 2002/2003. There were 1,215 homicide cases in that period — the highest number in the country’s recent history.

    The number of homicides in the UK began dipping this time. A year later, the number slumped by almost 200 cases. It continued dropping (with mild fluctuations) until 2013/2014. This was the period with the fewest homicides — 615 cases were reported in the UK.

    Violent Crime Facts

    24. In 2019, 68.2% of violent crimes were aggravated assaults.

    (FBI)

    Aggravated assaults account for the majority of violent offenses in the United States. In 2019, their rate was 250.2 per 100,000 residents.

    On the other hand, murder statistics show that it made up a much smaller percent of reported crimes. According to crime rates in America, approximately 1.4% were murders.

    25. Rape accounted for 8.2% of violent crimes in 2019.

    (FBI)

    Out of the total number of violent crimes in the States, rape accounts for a relatively small percent. Data from 2019 demonstrates this — the rape rate in 2019 was 29.9 per 100,000 people. When converted into the overall number of cases, almost 100,000 rapes were reported that year.

    US violent crime statistics show that, although relatively rare, rape cases aren’t the least prominent kind of violent crime. That title would belong to murder. In 2019, homicide accounted for 1.4% of all reported violent crimes.

    However, if we observe rape on a year-to-year basis, we can see a clear fall in its rate. According to the FBI’s stats on violent crime rates by year, the rape rate was 31 back in 2018.

    26. Firearms were used in 73.7% of murder cases in 2019.

    (FBI)

    The United States has a unique relationship with firearms. The country has relatively high gun crime rates, but guns are also an inseparable part of its history and culture. This makes the firearm crime problem difficult to solve. The statistics on gun crimes show that firearms are a part of most murder cases.

    Although most common, guns were not the only weapon used in murder cases that year. According to violent crime stats, knives and other cutting instruments made up 10.6% of all weapons. Moreover, perpetrators used other unknown but dangerous weapons (blunt objects, tools, and the like) in 11.4% of the cases.

    In 2019, the rarest murder weapons were so-called personal weapons. The United States violent crime statistics show that only 4.3% of murders were caused by personal weapons such as hands, fists, feet, and similar.

    27. 51% of US citizens think crime is a severe problem.

    (Statista)

    Some parts of the US have a bigger problem with crime than others. Crime rates significantly correlate with population density and living conditions.

    The violent crime statistics in the USA show that more than half of people think that crime in the US has gotten out of hand. Conversely, only 10% of US citizens think the crime rate in their area is a problem.

    Violent Crime Statistics #2

    28. In 2019, 5,319,654 white people were arrested.

    (FBI)

    Out of all the arrests in 2019, white people made up the greatest percentage in the United States. As the ethnic majority of the country, it makes sense that they took up the biggest share of arrests.

    According to the FBI violent crime statistics by race, out of 7,710,900 offenses in 2019, 2,115,381 arrested persons were African Americans.

    29. 5,012,260 males were arrested in 2019.

    (FBI)

    Data from the FBI shows that men are vastly overrepresented in criminal arrests. In fact, the number of arrested males is several times bigger than that of females.

    If we look at the violent crime statistics by gender, it is clear that males dominate this category. Out of 6,917,552 cases in 2019, only 1,905,292 were committed by women.

    Conclusion

    Crime is a part of our everyday lives. We can reduce it, but we can’t eradicate it without resorting to inhumane means. However, the situation could likely be better than it is now.

    From these violent crime statistics, we see that the violent crime rate is decreasing. Some crimes, such as rape, haven’t been dropping linearly for various reasons, but overall, the situation seems to be getting better.

    Especially compared with the 1990s, the rates of robbery, murder, aggravated assault, and rape have dropped significantly. For the most part, the downward trend is still present.

    That said, we are still far from living in the closest feasible version of a crime-free world.

    People Also Ask

    What is classified as a violent crime?

    A violent crime is when the victim is threatened or harmed with violence. The term “violent crime” usually includes homicide, murder, assault, manslaughter, sexual assault, rape, extortion, and kidnapping.
    Four types of violent crimes are dominant in the US — murder (including nonnegligent manslaughter), forcible rape, robbery, and aggravated assault. Furthermore, we should also note that different countries have different systems for reporting and recording crime.

    Is stealing a violent crime?

    It depends on the category “stealing” refers to. Robbery, for example, is classified as a violent crime. On the other hand, theft and larceny fall into the scope of property crimes.
    Robberies are fairly numerous in the United States, though not to an alarming extent. In 2019, there were almost 300,000 reported robbery cases. But compared to thefts and cases of larceny, they aren’t that prevalent in the States.

    What city has the highest crime rate?

    Detroit leads the way as the most violent city in the United States. In 2019, there were over 1965.33 violent crimes per 100,000 citizens. In second place was St. Louis with around 1927.32 crimes, and in third was Memphis with 1927.42 reported crimes per 100,000 inhabitants.
    However, the city with the highest murder rate worldwide is Los Cabos in Mexico, followed by Acapulco and the capital of Venezuela, Caracas.

    Why is violent crime decreasing?

    Violent crime decreases for a variety of complex reasons. The increase of resources for policing can contribute to curbing violent crimes. Moreover, better policies have a positive effect on reducing the violent crime rate.
    Law enforcement is not the only thing that makes violent crime go down. For example, improved living standards also make society safer. According to violent crime statistics, the reduced demand for hard drugs also leads to lower crime rates.

  • 20 Fascinating California Real Estate Statistics

    20 Fascinating California Real Estate Statistics

    California, known for its sunny and hot weather, is among the greatest real estate markets in the US. California real estate statistics show a growing demand for accommodation, particularly in the metropolitan areas of Los Angeles, San Francisco, and San Diego. Also, houses in California are among the costliest personal properties in the world. 

    Apart from the weather and breathtaking sceneries, California is in great demand due to its booming economy. Even the coronavirus pandemic couldn’t halt the house sales. After the decrease in the first half of 2020, the sales surged again in August. Several factors made Golden State’s real estate attractive again.

    Top California Home Sales Statistics and Facts (Editor’s Choice)

    • Property sales across the six-county Southern California region increased by 43.5% between May and June 2020
    • There are 13,044,266 houses and apartments in California
    • The average market rent is $2,333 per month
    • 43.7% of homes on the market were built between 1970 and 1999
    • 473,500 homes were sold in California in 2019
    • The median value of condos and single-family houses amounts to $635,055
    • The sale of million-dollar real estate increased by 18.1% in June 2020

    General California Real Estate Statistics

    2020 was excruciating for the Californian property market. Namely, it encountered the greatest decline after the Great Recession in 2008. Luckily, the real estate market managed to overcome the challenges in June with the biggest increase in month-to-month sales in the past 40 years. Plus, the average price of home units set another record.

    1. In California, 1,700 more houses were sold in 2020 than in 2019. 

    (First Tuesday Journal)

    The California housing market witnessed a meager 0.4% increase in home sales from 2019 to 2020, reaching 439,200 sold houses. The coronavirus pandemic has taken its toll on the economy both in the US and other countries worldwide.

    The unexpected recession forced many businesses to close, and a devastating number of employees ended up jobless. Real estate’s fate was no different. The economic volatility coupled with job losses resulted in a low sales volume. More precisely, 42% fewer homes were sold in 2020 than in 2005.

    2. 437,500 houses were sold in 2019. 

     (First Tuesday Journal)

    California home sale statistics show that 437,500 homes were sold in 2019 in the state of California. However, in comparison with the sales in 2018, these figures showed a 1% decrease. In other words, 4,400 fewer homes were sold in 2019 than in 2018. Compared to 2005 statistics, that’s a massive drop in sales volume. 

    3. 465,400 home units were sold in August 2020.

    (California Association of Realtors), (California Association of Realtors)

    According to real estate trends in California, home sales were on a rising trajectory between 2019 and 2020. More precisely, there was a 6.3% increase in sales from July 2019 and a 14.6% increase from August 2019, reaching 465,400 houses sold by August 2020. The median price of homes also went up by 6.1% between August 2019 and August 2020. However, the California real estate sales started dropping, reaching a record low in 2022. Namely, the year-to date-sales in July reached just 295,460, which is 31.1% less than the same month a year before.

    4. SoCal real estate market prices grew by 12.9% in August 2020.

    (Norada Real Estate Investments)

    Several months ago, the average price of a home unit in Southern California hit $640,000. That marked almost a 13% increase from August 2019. California real estate sales from July and August 2019 indicated a drop of 3.9% and 5.2%, respectively, for single-family homes in LA County. The average price grew by 7.9%, only to hit $677,260. Orange County experienced the greatest surge in sales—13.7% from the year before. The average price increased by 14.8% from 2019, reaching $930,000. 

    5. The median value of condos and single-family houses amounts to $635,055.

    (Zillow)

    Currently, single-family homes and condos are valued at a median of $635,055, marking a 10.9% increase in value during the past year. This price is adjusted according to seasons and involves only the middle price tier of houses. According to California housing market predictions, a 3% increase in home prices is expected. 

    6. The sale of million-dollar real estate increased by 18.1% in June 2020.

    (PR Newswire)

    Home units valued below $500,00 comprised 48% of overall sales in California as of May 2020. However, such homes made up only 44% of total sales in June 2020. Conversely, the sale of properties estimated at a million dollars rose by 18.1%, as opposed to 15.6% in May.

    7. The median home value in California is $574,957. 

    (Neighborhood Scout)

    The prices in California generally indicate a rising trajectory. Currently, the positive direction of the real estate market demonstrates that the average value of a home unit amounts to slightly over $570,000. In percentages and value, home prices go as follows:

    • Up to $59,223 — 2.8%
    • $59,224–$118,496 — 2.4%
    • $118,497–$237,000 — 7.6%
    • $237,001–$355,415 — 12% 
    • $355,416–$473,900 — 14.7%
    • $473,901–$592,258 — 14.2%
    • $592,259–$888,619 — 22.8%
    • $888,620–$1,184,775 — 10.8%
    • Over $1,184,775 — 12.7% 

    8. Property sales across the six-county Southern California region increased by 43.5% between May and June 2020. 

    (Los Angeles Times)

    According to home sales statistics, property sales in the six-county Southern California region increased by almost 44% from May to June 2020. It was the biggest increase in home sales in one month since 1988. 

    Still, the record sales were 15.2% down from the year before. In April and May, the Southern California home sales dropped by 31.5% and 45% year-over-year, respectively. 

    9. The median price of home units in California rose to $555,500 in June 2020.

    (Los Angeles Times)

    The real estate median price increased by 2.9% in Southern California. Home sale statistics reveal that such a price of estates in the six-county region amounted to more than half a million dollars in June 2020. But, bear in mind that not all properties were sold at that price. The median reflects the point at which 50% of houses were priced for more and 50% for less than that amount.

    10. The median price year-over-year in 45 counties in California increased by 10%. 

    (Manage Casa)

    As California real estate trends show, the median home price increased by 10% in 45 out of 51 counties tracked by the California Association of Realtors. However, the number of active listings dropped by 51.1% in March from the year before, marking a decline in listings of more than 50% for three months in a row. 

    11. July sales increased by 24.7% from the previous month. 

    (Pacific Sotheby’s International Realty)

    In July 2020, the California housing market graph in the past 50 years saw the strongest monthly gain. Namely, the growth of real estate sales by almost 25% that occurred that month was the highest since 2006. As for the National Association of Realtors, such a surge in sales reflects the seasonally adjusted annual rate of a massive 5.86 million. 

    12. The mortgage rate in California currently stands at around 3%. 

    (Interest)

    As California real estate data show, mortgage and refinance rates are below the national average. It currently stands at 3.02% for a 30-year fixed rate and 2.28% for a 15-year fixed rate. Even though houses in many areas across the state are very expensive, low interest rates will help buyers save money on mortgage expenses and potentially allow more people to buy properties. 

    13. The average market rent is $2,333 per month. 

    (Neighborhood Scout)

    California real estate statistics show an increase in rent prices as well. Currently, renters need to pay around $2,300 a month to rent a house. But, the homeownership rate reveals that there are more owners than renters—53.7% vs. 46.3%, respectively. Rental statistics show that the remaining 8% are vacant properties, resulting in a big imbalance between the supply and demand in the real estate market.

    When Will House Prices Drop in California?

    Without a doubt, 2020 was intriguing for the Californian housing market. The prices were rising, and there was a clear indication that it would be yet another successful year for real estate in California. Then the pandemic happened and threatened to harm the market. Luckily, it fought back and showed extraordinary resilience. Based on the current situation and projections, property price trends show they won’t drop anytime soon. 

    14. The home unit prices should rise by 3% by the end of April 2021 in Southern California. 

    (OCR)

    According to forecasts, a 1.3% drop in prices will occur in 41 US states. But that isn’t the case with the Los Angeles housing market forecast 2020-2021. Namely, Southern California is among those states that aren’t expecting the decline. Quite the contrary, the prices are bound to grow by 3% in LA County by April 2021. Orange County will see an increase of 5%, whereas the Inland Empire expects a rise of 6%.

    15. The Bay Area home sales prices increased by a whopping 128% in inflation-adjusted dollars between 1997 and 2018. 

    (Vital Signs)

    Throughout California median home price history recorded since 1997, the demand for houses in the Bay Area has been quite strong. Given the region’s thriving economy, limited supply of land and vacant real estate, and overall popularity, it’s not surprising that the Bay Area’s home prices are continuing to grow. 

    16. The average home price reached $706,900 in August 2020.

    (HBI) 

    As far as projections go, the California housing market crash is unlikely to happen soon. The decline in sales during the lockdown is now nearly forgotten, and the surge in the June-September period helped the market to rebound. In fact, a record-high average price of $706,900 was recorded in August 2020. That was a 14.5% increase from the same month in the previous year.

    17. There are 13,044,266 houses and apartments in California.

    (Neighborhood Scout) 

    Property stats show that there are more than 13 million homes and apartments in California. In terms of types, 57.7% are single-family homes, while 23.5% are apartment complexes. Small apartment buildings comprise 7.9% of the overall number, whereas townhomes make up 7%. 3.7% are mobile homes, whereas other types comprise 0.1%.

    18. 33.4% of homes have three bedrooms.

    (Neighborhood Scout)

    One-third or 33.4% of US homes have three bedrooms, 27.6% have two bedrooms, while 17% have four bedrooms. 13.5% of homes are with only one bedroom, whereas 4.3% are with five bedrooms. 4.2% have no bedrooms. The average price of building a three-bedroom house is $180,000 to $240,000, depending on the location, size, and style.

    19. The average home price in San Francisco Bay jumped by 18.7% in August 2020. 

    (Homebuying Institute)

    San Francisco Bay Area housing market predictions for 2020 were certainly about the price increase. However, the already expensive Bay Area witnessed the largest home price jump of almost 19% over the year. Besides, it stood out regarding the number of property sales, which, in turn, added to the price increase. 

    Other areas that saw an increase in prices include the Central Coast region (16.4%), Southern California (12.9% YOY), and the Central Valley region (12.2%).

    20. 43.5% of homes on the market in California were built between 1970 and 1999. 

    (Neighborhood Scout)

    California home sales data show that plenty of homes were built and sold between 1970 and 1999. Namely, 43.5% of homes were built during that period. The second most productive period was between 1940 and 1969 when 32.7% of houses were built. Only 9.1% of houses built in 1939 and prior are still standing, whereas 14.6% of houses were built after 2000. 

    The Bottom Line: The Overall Health of California Real Estate Market

    The first six months of 2020 were volatile for the real estate market in California. The year began solidly, with rising sales and profit. Then the coronavirus pandemic took place and threatened to crush the entire market. Economic volatility, job losses, and the global lockdown nearly stopped home sales and purchases.

    Somewhere around June, the housing market rekindled. According to California home sales statistics, there was a record in purchases and prices. Even the rent prices jumped considerably. The following months were even more productive for real estate agents, enabling them to make a hefty profit. Without a doubt, the most sought-after region was Southern California, with an increase in sales of over 40% in just a few months. In July only, the region documented an adjusted annual rate of over nearly 6 million, which hasn’t been seen in over half a century. 

    People Also Ask

    Is the housing market dropping in California?

    Presently, the housing market in California is going through an immense increase in sales and, therefore, in prices too. The figures have been skyrocketing ever since May or June, with the highest growth noticed in Southern California, specifically in the San Francisco Bay Area and LA County. The prices might drop by 1.3% by April 2021 in all areas except for SoCal. This region expects an increase in prices by 3%, 5%, and 6% in LA County, Orange County, and the Inland Empire, respectively.

    When will the housing market crash in California?

    Due to the temporary health and economic issues bothering America, the question of a market crash is relatively frequent and expected. But, based on the growth in sales, the Californian real estate market isn’t likely to crash soon. The five primary factors that will prevent such a situation include low mortgage rates, the disbalance between supply and demand, i.e., the lack of vacancies, the buyers’ demand, the overall market’s strength, and the ability to adapt.

    Is real estate a good investment in California?

    Regardless of somewhat higher prices, California has always been among stunning locations for real estate investments. The primary reason is its strong economy, maybe the strongest across the entire US. California provides an array of job opportunities that result in employment growth. In fact, the unemployment rate is at its lowest in the last 50 years. Job prospects are expected to attract more people to relocate to California. In turn, the growing economy is bound to result in higher housing demand in many fantastic Californian cities.

    Why is California real estate so expensive?

    The high demand for accommodation and the lack of home units affected the price range in the housing market. It’s the classic supply and demand factor—a rising number of people seek to live there, but there aren’t quite enough homes. Simply put, California hasn’t built enough houses. As for the estimations, the state should build 180,000 new home units every year to prevent prices from changing.

    What is the cheapest place to live in California?

    Southern California is undoubtedly among the priciest places to live in Golden State. Los Angeles, San Francisco, San Diego, and San Jose are among the most attractive cities. Even though it’s among the most expensive states, California still has affordable locations to offer.
    The five cheapest cities include:
    – Ventura, with an average household income of $66,485 and a median home price of $428,600
    – Camarillo, with a median household income of $87,120 and a median accommodation price of $456,500
    – Simi Valley, where a median income amounts to $89,595, whereas the home value is $438,700
    – Oxnard, in which a household earns $62,349 on average and need to pay $332,600 for an average home
    – Vacaville, as the cheapest, Vacaville sells an average home for $275,100, and its citizens earn $74,207 on average.

    Where is the best place to buy a house in California?

    Although Los Angeles, San Francisco, and San Jose are among the most attractive Californian cities, they aren’t listed as the best cities for buying a house, mainly because of the high prices.
    The most attractive place to buy a house is determined according to four factors: livability (including factors such as facilities, education, healthcare, and employment), average home unit price, value predictions (what you’ll get for your money), and buyer-seller index (a balance between buyers and sellers). According to California real estate statistics, Hawthorne, home to Tesla, SpaceX, and The Boring Company, is the best place to buy a house.

  • Workplace Violence Statistics Amidst a Global Pandemic

    Workplace Violence Statistics Amidst a Global Pandemic

    Since the start of the pandemic, we have been approaching our work and communicating with our colleagues in new ways. Still, workplace violence statistics don’t seem to have changed much. 

    It is still hard to put all the puzzle pieces together when it comes to 2020 statistics. The pandemic still lasts, and we have no idea when it will end. Thus, let’s look at the information available so far and see how to raise workplace violence awareness in our communities. 

    The Top 7 Workplace Violence Stats (Editor’s Choice):

    • There are four types of workplace violence
    • Every year, over 2 million U.S. employees experience workplace violence 
    • Around 27% of all violent workplace events are related to domestic violence
    • 85% of workplace murders involve firearms
    • Around 35% of female fatalities on the job are the result of homicide
    • About 86 police officers were fatally injured on the job in 2019
    • In the last two years, 8 in 10 teachers have reported being victimized in the workplace 
    • Over 75% of all registered nurses have experienced workplace violence

    Most Common Types of Workplace Violence

    As defined by the U.S. Department of Labor, workplace violence includes ‘any act or threat of physical violence, harassment, intimidation, or other threatening disruptive behavior that occurs at the worksite.’

    1. Four different types of workplace violence exist. 

    (AlertMedia)

    The term ‘violence at work’ implies a couple of different categories. Namely, there are four unique varieties of workplace violence generally defined on the basis of previous incidents and history of workplace violence. For example, the perpetrator might not have any connections to the workplace or the employees. Also, he could be in touch with the workplace and the workers.

    Another type includes a former or current employee showing violent behavior. The perpetrator can also have a personal relationship with employees and none with the workplace (women are mostly victims of the last type of workplace violence). 

    2. The most dangerous U.S. states to work in are Michigan, Montana, and Indiana.

    (Rave Mobile Safety)

    Workplace injury statistics by state have revealed the most dangerous U.S. countries. Even though states like California, Florida, Texas, and New York have recorded many workplace assaults, they aren’t the most hazardous to work (these states also have the highest number of employees).

    If we compare the percentage of the working population to the rate of fatal assaults in the workplace, Michigan is the most dangerous state to work in, with 41 deadly assaults in 2019; Montana is second, with 31 assaults, and Indiana third, with 28 recorded cases. 

    Workplace Violence Statistics 2020

    In 2020, most workers were working from home, so the conditions were different. Still, the rate of bullied workers didn’t seem to drop last year. 

    3. More than 2 million U.S. employees experience workplace violence annually.

    (shrm.org, AFL-CIO)

    Unfortunately, these numbers are somewhat vague because many victims don’t talk about the assaults for various reasons. In 2019, 841 people died due to workplace violence, while workplace harassment statistics show that over 30,000 people suffered nonfatal injuries related to violence.

    (U.S. Bureau of Labor Statistics)

    In 2019, an employee died every 99 minutes as a result of a work-related injury. That year was the worst in the last decade (from 2009 to 2019) regarding workplace death statistics, with 5 333 deceased employees in the U.S. only. The worst year sincer 1992 was 1995, with more than

    6 600 fatal work injuries. In conclusion, there were 3.5 fatalities per 100 000 full-time employees in 2019. 

    5. 24% of employees are aware of previous workplace violence incidents. 

    (shrm.org)

    Almost a fourth of all workers are aware of previous violent incidents in their company, as recent workplace violence statistics suggest. While more than half of the questioned employees (57%, to be accurate) answered they were unaware of any violence at their work, 14% reported at least one case in the previous year. 

    6. 12% of employees state that they feel unsafe at work.

    (shrm.org)

    Simultaneously, 2% of questioned employees expressed feeling ‘very unsafe’ at their workplace. This means almost every seventh worker doesn’t feel safe at work, as workplace violence stats indicate. In other words, if we assume that a working area consists of 10 employees, for example, that means every active group of employees has at least one employee that feels threatened and at risk at their workplace. 

    7. 78% of all workplace violence happens to Caucasian people.

    (NCVRW Resource Guide – Workplace Violence)

    Reportedly, 78% of known workplace victimization happened to Caucasian people, 9% to Black or African-American employees, while 8% of recorded cases to Hispanic or Latino workers. 

    Workplace Violence Statistics and Domestic Violence

    8. 27% of all violent workplace events are connected to domestic violence.

    (Alice Training)

    Up to 27% of all violent workplace incidents are somehow connected to domestic violence. Also, almost 80% of all recorded cases have nothing to do with the workplace but rather with a particular employee with whom the perpetrator has a personal connection, as the workplace conflict statistics indicate.

    9. Only 20% of U.S. companies offer training on domestic violence.

    (shrm.org)

    This number comes off as even smaller and less significant if we know that 19% of all surveyed companies reported violence cases at the workplace directly connected with domestic abuse in the past twelve months. Additionally, 16% stated to have had a similar incident in the past five years. 

    Workplace Homicide Statistics

    10. In 2019, 86 police officers were fatally injured at the workplace.

    (U.S. Bureau of Labor Statistics)

    The rate of fatal work injuries in police officers was 11.1 per 100,000 full-time employees. Moreover, 81.4% of them happened to officers between the ages of 25 and 54. According to violence in the workplace statistics, only 10.5% of the fatal injuries occurred to women officers. 

    11. In 2021, there were five fatal workplace shootings, as per workplace violence statistics by year. 

    (Statista)

    The workplace shooting which involved the highest number of fatalities was the Boulder supermarket shooting in Colorado. No one was injured, but ten people died. The other workplace shootings happened in Indiana, Georgia, and there were two shootings in California. 

    12. 85% of workplace homicides include firearms.

    (NCVRW Resource Guide – Workplace Violence)

    This number is quite devastating, but the good news is that the rate of workplace violence related to firearms has dropped significantly since 1995. The number of homicidal violent incidents with guns dropped by more than a half between 1995 and 2015, from 762 registered cases in 1995 to 354 in 2015.

    13. 35% of women’s workplace fatalities result from murders.

    (Law.JRank)

    Overall, there’s a significant difference in the number of men and women killed in the workplace. In fact, the available workplace death statistics note that only 15% of males who lose their lives on the job are murdered. 

    Former or current employees are accountable for around 5% of workplace homicides.

    Violence in the Workplace Statistics by Industry

    14. Law enforcement officers suffer the highest rate of nonfatal workplace violence.

    (NCVRW Resource Guide – Workplace Violence)

    Mental health workers come second, while transportation employees come third when the nonfatal workplace violence rate is in question. 

    15. 80% of teachers reported being victimized in the workplace in the last two years.

    (Rave Mobile Safety)

    Even though often overseen and neglected, violent behavior towards teachers is widespread. Not only did most of the teachers report victimization, but 44% of them precisely stated having been physically attacked, as well.

    When that happens, it’s best if teachers are equipped with pepper sprays to easily deter attackers.

    Workplace Violence Statistics in Healthcare

    16. One in every five cases of workplace injuries happens in the private health care industry.

    (U.S. Bureau of Labor Statistics)

    In 2019, almost 600 000 cases of nonfatal injuries and illnesses happened in the health care and social assistance industry, more than in any private sector. Manufacturing industries take second place, with more than 420 000 reported cases in 2019, as national workplace violence statistics revealed. Retail trade is close by, with almost 400 000 recorded cases. The same year, 2.8 million nonfatal injuries and illnesses happened in the private industry in general. 

    17. As per data from Cox Medical Center Branson, there were 68 injuries to health care workers in 2020. 

    (Advisory Board)

    Based on workplace bullying statistics, that represented a significant increase from 2019 when there were only 17 such injuries. 

    As we can see, violence against health workers has increased since the beginning of the pandemic. As a result, many hospitals take extra steps to protect their employees. 

    That is to say; Cox Medical Center Branson is going to provide 400 employees with panic buttons on their identification badges.

    18. 76% of all registered nurses stated to have experienced workplace violence.

    (What to Become)

    Unfortunately, a study conducted in 2019 reveals that only 20%-60% of all nurses decide to report workplace violence, no matter whether physical or verbal, even though most of them have gone through a violent workplace experience at least once. 

    19. Most states adopted enhanced penalties for violence against healthcare workers.

    (The New England Journal of Medicine)

    Workplace safety statistics affirm that 37 U.S. states have adopted protective laws for nurses and other healthcare workers concerning workplace violence. Expectedly, the content of these laws varies from state to state. Still, only three states have no enhanced penalties in any form (Montana, South Carolina, and Wyoming), while the other ten states adopted protection laws only for the first responders and EMS workers.

    Conclusion 

    It seems like even though COVID-19 pandemics have changed the way we work and interact with our employers, not much has changed when it comes to workplace violence statistics. The same industries have been in greatest danger as before—law enforcement, transportation, and (now even more) health care workers. Still, there is always the other side of the coin.

    For example, the number of workplace incidents that include firearms has decreased in the last two decades. In the end, the most important goal for every company should be to raise awareness of workplace violence and offer comfort and support to the workers affected by it. 

    People Also Ask

    How Many People are Killed Annually in Incidents of Workplace Homicides?

    Every year, unfortunately, there are many fatal workplace injuries. However, in 2020, that number was the lowest one since 2013. In detail, there were around 4,764 fatal workplace injuries in 2020, with an employee dying every 111 minutes from such injury.
    Moreover, with over 1,700 fatal injuries, the most frequent types of fatal injuries involve transportation.

    How Common Is Workplace Violence?

    It depends on the industry. For example, it is the most common in law enforcement and health care industries. Some numbers in these industries come off as more than alarming. For instance, up to 76% of all registered nurses reported having been victims of workplace violence at least once in their working life. Also, 80% of teachers state that they had been victimized at their workplace as well.

    How Many Workplace Violence Incidents Were There in 2020?

    There aren’t any exact numbers for 2020 so far, but there is accurate information about the previous years. For example, each year, there are approximately 2 million workplace violence cases in the U.S. only (both reported and non-reported). The year 2019 was the worst for death cases caused by workplace violence (more than 5 500 workers were fatally injured that year).

    Which Occupation Has the Highest Rate of Workplace Violence?

    Law enforcement officers take the first place when it comes to workplace violence. Still, other sectors are at high risk, as well. Health care workers (especially the ones working in the private sector) suffer from nonfatal violence. Also, transportation workers are at higher risk.

    What Percentage of Workplace Violence Is Tied to Domestic Violence?

    Even though the connection between these two types of violent behavior is often neglected, studies have shown that many victims who suffered workplace violence also suffered domestic violence. More than fourth of the registered cases (27% to be precise) suffered both types of violence. The victims, mostly women, in most cases of female harassment knew the perpetrator, as the workplace violence statistics indicate.