The sun has been an essential resource for humanity since the dawn of time, and Bell Laboratories made the first solar panel in 1954. Since then, solar energy statistics show solar power as one of the fastest-growing industries in the United States.
Solar power is the conversion of sunlight into electricity and is probably one of the most significant inventions of the 21st century.
That said, we’ve put together some fascinating statistics that will help you understand just how much renewable energy has grown over the years and what the future holds. Without further ado, let’s jump into them.
Essential Solar Energy Facts & Stats (Editor’s Pick)
- Solar energy is accountable for around 1.7% of the US electricity generation
- California installed 23 GW of solar capacity in 2019
- At 205 GW, China had the largest installed solar capacity globally in 2019
- In 2020, more than 2,400 kWh of electricity was generated from fossil fuels
- Since 2000, solar energy production has increased, and coal production has decreased
- Up to 97% of solar panels are recyclable
- Since 2016, the US solar community has quadrupled
- A home can save up to $30,000 over its solar panel system’s lifetime
General Solar Energy Statistics
Have you ever wondered how much solar energy the US generates and whether it is a leading country in solar energy generation?
In the next set of stats, you can find the answers to these questions and much more. So, if you are interested, make sure you read on.
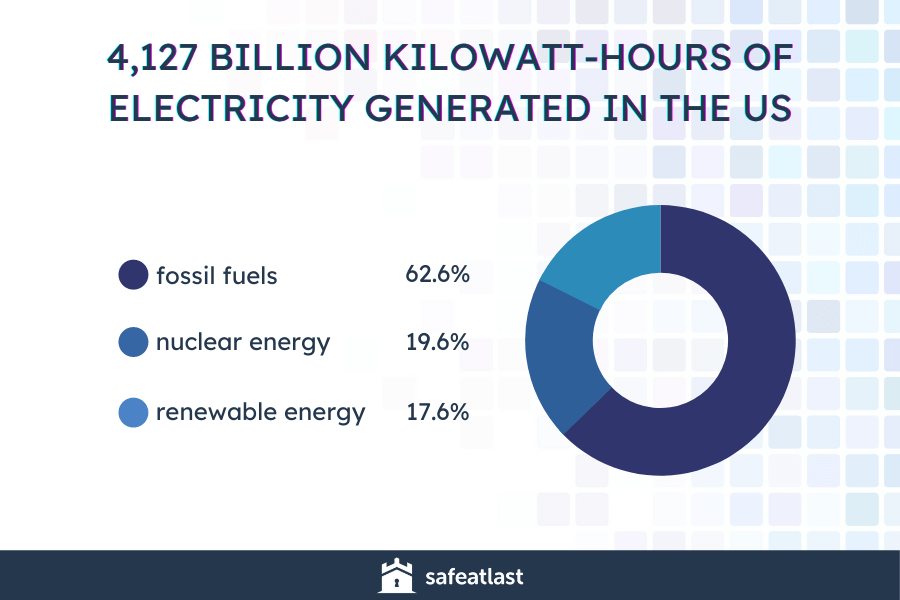
1. Solar energy makes up 1.7% of the US electricity generation.
(EIA)
According to solar energy statistics from 2019, over 4,127 billion kilowatt-hours of electricity were generated in electricity generation facilities all over the US. Out of that number, 62.6% of the electricity was from fossil fuels, 19.6% from nuclear energy, and 17.6% from renewable energy sources.
2. By the third quarter of 2021, the US had installed 113.5 GW of solar PV capacity.
(SEIA)
According to solar energy statistics, that was enough to power almost 22 million people in the United States. Moreover, in the third quarter alone, it installed around 5.4 GW.
For the first time in the industry’s history, residential solar installations surpassed 1 GW and over 130,000 systems in only one quarter. On top of that, utility-scale solar installations reached another third-quarter high at 3.8 GW.
Based on some solar energy growth projections, we can expect that the annual installation of solar panels will only increase in the future.
3. In 2019, California installed 23 GW of solar capacity.
(CNBC)
California has been the leader in installing solar energy in the United States for a few years in a row. As almost 17% of California’s electricity comes from solar energy, it is no surprise that the country is the leader with more than 23 GW of installed solar capacity. North Carolina is second with around 4.5 GW of installed solar, and the third is Arizona with 3.6 GW.
4. Asia dominated the global solar capacity expansion in 2019, accounting for around 60% of the total.
(Irena)
When it comes to generating renewable energy by country in 2019, China, Japan, Vietnam, the Republic of Korea, and India were the countries with the highest amount of new capacity.
However, we can’t leave behind some other countries, which also showed substantial increases, like the US, Spain, Germany, Australia, and Ukraine.
5. In 2019, China had the largest installed solar capacity (205 GW) globally.
(NS Energy)
It produced 223.8 TWh of electricity. So, this statistic shows that, when it comes to the generation of solar energy, the percentage is the highest in China. More specifically, the Huanghe Hydropower Hainan Solar Park was China’s largest single solar project (2.2 GW).
Furthermore, the US accounted for the second-largest installed solar capacity (76 GW) and produced 93.1 TWh of electricity.
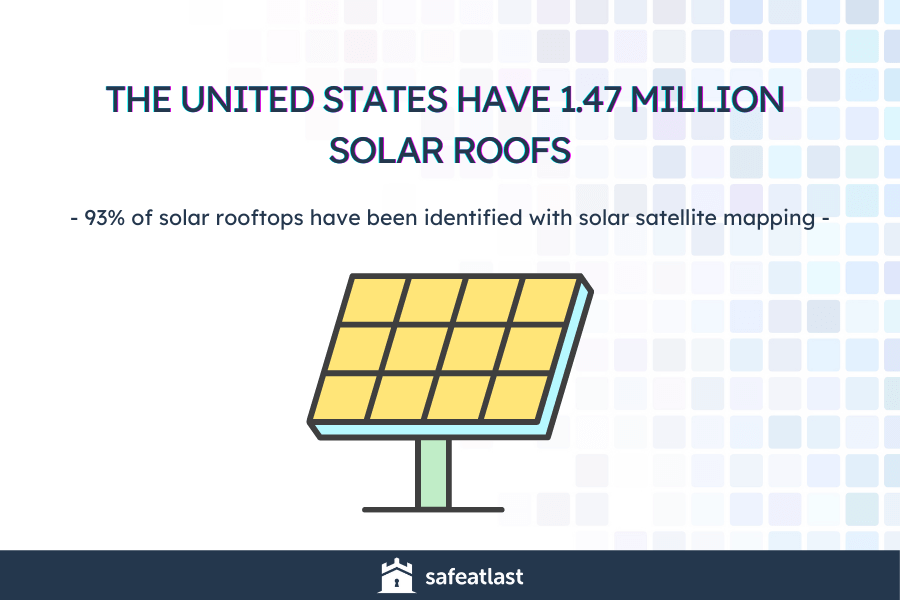
6. A total of 1.47 million solar roofs were identified in the United States.
(Clentecnica)
Researchers at Stanford University made a solar energy report in which they mapped almost every solar roof in the US. Using the satellite, they correctly identified 93% of solar rooftops across 48 states and got the number of over 1.47 million of them.
Interestingly, before this type of solar satellite mapping, scientists made solar maps by measuring the total amount of sunlight that arrived at a given spot.
Solar Power Statistics
These statistics are essential because they can help you better understand solar energy and solar energy generation. That said, in the next set of stats, you will see just how much solar power is generated in the US and learn a thing or two on community solar.
7. The average US solar installation is about 5 KW.
(Solstice)
The solar energy facts and information tell us that the average US solar home has about 20 solar panels, and all of them generate about 5 KW. However, if you want to cover 100% of your energy usage, you may need more solar panels, especially if you live in a big house or have central air conditioning.

8. In 2019, 72.3 billion kWh were generated from solar sources.
(Statista)
The renewable energy statistics show that the US invested a lot into renewable energy sources between 2000 and 2019. In 2019, 72.3 billion kWh were generated from solar sources, 273.7 billion kWh from conventional hydroelectric power, and 300 billion kWh from wind sources.
9. In the first quarter of 2021, 131 MW of community solar was installed.
(SEIA)
Compared to the first quarter of 2020, that was a 15% decrease. Moreover, the amount was nearly 70% lower than the last quarter of 2020.
However, lower first-quarter numbers don’t have to be signs of a long-term trend. The solar community is on the rise, and solar energy statistics from 2020 and 2021 show precisely that.
10. The global investment in solar energy was $141 billion in 2019.
(Statista)
According to the solar panels stats from 2019, the world saw many new investments in the renewable energy sector. The investments in solar energy technologies came to $141 billion. The only industry that was supported more was the wind power sector that received over $142 billion.
11. Solar has ranked first or second regarding electric capacity added in the last seven years.
(SEIA)
In the last ten years, solar has achieved a growth of about 40%. The following fact on solar energy doesn’t come as a big shock since the solar capacity has ranked first or second for seven years in a row. However, 2020 saw the most significant success, as solar produced 43% of all new electrical capacity in the US — the largest share in history.
12. 89% of adult US citizens supported solar farms in 2019.
(Pew Research)
The recent energy statistics show that the US has been investing more and more in renewable energy. In 2019, it had full support from US citizens — 9 out of 10 homeowners said they would install solar panels to save money on electricity bills. However, a mere 9% opposed it, and 2% were undecided. In addition, 83% of US citizens supported wind turbine farms, and only 14% were against them.
Solar Energy vs. Fossil Fuels Statistics
The difference between solar energy and fossil fuels is that solar energy is a renewable energy source, while fossil fuels are nonrenewable resources. You will see more significant differences between these two energy sources in the next set of stats.
13. Electricity generated from fossil fuels costs 5–17 cents per kWh.
(Consumer Affairs)
Many consumers burn fossil fuels because they think it is much cheaper and more convenient. However, going solar can be a money-saver in the long term. Solar system statistics tell us that solar renewable energy is better for the environment and the average cost is somewhere between 3 and 6 cents per kWh.

14. Over 2,400 billion kWh of electricity was generated from fossil fuels in 2020.
(EIA)
That equated to fossil fuels (natural gas, petroleum, coal, and other gases), making 60.6% of the total electricity generation that year. Overall, more than 4,000 billion kWh of electricity were generated in US utility-scale electricity generation facilities in 2020.
15. Since 2000, solar energy production has gone up, and coal production has declined.
(Pew Research, IEA)
Statistics on solar energy use in the US show that solar has achieved the most considerable growth compared to any other energy source.
On the other hand, coal had its peak in 2008 when about 1.2 billion tons were mined. However, in 2019, coal accounted for around 36.7% of the total electricity production.
Solar Energy Facts
Many solar power and panel facts can be found on the Web. However, we’ve picked some of the most interesting ones that will surely catch your eye. So if you want to learn more about solar energy, keep on reading.
16. SolarStar is the largest solar farm in the US.
(Solstice)
We will start with one of the most interesting solar power fun facts. When SolarStar was built back in 2015, it was the world’s biggest solar farm. Located in California, it now has over 1.7 million solar panels spread out over 13 square kilometers. That said, SolarStar produces about 579 MW of solar energy and can power 255,000 homes.
17. “Solar photovoltaic installer” is the fastest-growing job in the US.
(CNBC)
The Bureau of Labor Statistics analyzed over 20 jobs to see which would achieve immense growth by 2026. Although several jobs had double-digit growth, solar power stats showed that the career that came first with the 105% growth was a solar photovoltaic installer. This is just one of many facts on how the solar energy industry will continue to grow in the future.
18. 90–97% of solar panels are recyclable.
(Solstice)
This is just one of many facts about why solar energy is good for the environment and climate change. According to the solar panel statistics, 90–97% of all solar panels can be recycled into new ones or sold for a great price on any commodity market. Experts on solar energy also estimate that recyclable solar materials’ value will reach $15 billion by 2050.

19. The average home can save $10,000–$30,000 over its solar panel system’s lifetime.
(EnergySage)
Solar panels are not just great for the environment; in addition to smart home systems, solar panels can help you save some money as well. However, many factors impact the amount of savings.
In detail, some of the most critical ones are local electricity rates, the angle and size of the home’s roof, and direct sunlight during the day. That is to say, according to solar panel stats, Massachusetts is the state with the greatest 20-year-period savings in the US ($42,021).
20. The US community solar capacity has quadrupled since 2016.
(E360)
One of the many interesting solar power facts is that the solar community has become four times bigger in four years. In other words, the solar community generated 300 MW in 2016, while now it is generating more than 1,400 MW, which is enough to power 266,000 households.
21. Solar panels don’t need direct sunlight to generate electricity.
(Harrisons Energy)
If we take a closer look at the solar panel facts, we can see that solar panels don’t need direct sunlight to generate power. The photons in the natural daylight are responsible for solar panels generating electricity, so they don’t need exposure to direct sunlight to produce energy.
22. The first solar panel was invented in 1940.
(Axpo)
Although Alexandre Edmond Becquerel discovered the photovoltaic effect in 1839, one of the most attractive solar panels facts shows that it took about 100 years to invent the first solar panel. Russell S. Ohl developed the first solar panel in 1940, and Bell Laboratories designed the first commercial solar panel in 1954.
Conclusion
Solar energy is one of the cleanest energy sources as it doesn’t produce any pollutants. It is a renewable energy source that requires low maintenance and is easy to install.
We can see from these facts about solar energy that more and more people and governments have turned to solar energy as they feel they can contribute more to the environment.
That said, if solar energy is harnessed as it should be, it can satisfy all future energy needs. Hopefully, these statistics will help you realize that solar power has a vital role in the fight against climate change.
People Also Ask
How common is solar energy?
According to the latest statistics, solar is the most popular renewable energy source, and it has become the favorite type of electricity. On a global scale, renewable energy sources made up 24% of electricity generation back in 2014. The latest statistics also show that solar energy sources will only grow in the future. For example, solar generation made 11% of the total US renewable energy generation back in 2017. It is estimated that it will make 48% of US renewable energy by 2050, which makes it the fastest-growing electricity source.
Is the solar industry growing?
The solar industry is the fastest-growing renewable energy industry in the US. For instance, the solar energy market was valued at over $52 billion in 2018 and is expected to reach over $223 billion by 2026. We should also note that solar energy use has undergone massive growth since the early 2000s and has experienced a 49% growth rate every year. Moreover, more than one million US homes have solar panels and are being powered by solar energy.
How much solar energy is used in the US?
Solar energy makes 1.6% of the total US electricity generation. In 2019, electricity generation facilities all over the US generated 4,118 billion kWh of electricity, while 63% of the electricity was from fossil fuels, 20% from nuclear energy, and 18% from renewable energy sources. In addition, 3.4 acres of solar panels are required to generate one gigawatt of electricity over a year.
Which state has the highest solar capacity?
The United States is the world leader in generating renewable energy with over 67,885.000 GWh. Additionally, in the US, California is the leader in solar energy usage, with nearly 17% of its energy coming from 23 GW of newly installed solar capacity. In second place is North Carolina with 4,308 MW, in third Arizona with 3,400 MW, and in fourth is Nevada with 2,595 MW of installed solar capacity.
What percent of the world’s energy comes from solar power?
The U.S. Energy Information Administration (EIA) made a report in 2015 about solar power, estimating that approximately 12% of world energy consumption came from renewable sources such as geothermal, hydropower, biomass, solar, and wind. Facts suggest that world energy consumption from renewable sources will increase to 17% by 2040.
That said, Asia is the leading continent regarding solar energy generation. Here are the top five countries that generate the most solar energy — the United States, China, Italy, Japan, and Germany.
How many people use solar energy?
The US has more than 1.3 million solar installations, with over 40 GW of generation capacity. The latest statistics show that 1 MW of electricity can power 164 homes, so 40 GW is enough capacity to power 6,560,000 American households.
However, solar remains the third most important renewable energy source in terms of worldwide installed capacity. Hydro and wind lead the way as the essential renewable energy sources in 2020, with solar energy not that far behind.
Which country uses the most solar energy?
As Asia is the leading continent regarding solar energy, it comes as no surprise that China is the leading country with an immense solar capacity of 130 GW more than any other country. It still holds the record for the largest operational solar project conducted in 2018. One of the most exciting facts about solar power is that Los Angeles is the leader in installed solar PV capacity.
What are three important facts about solar energy?
Out of many amazing facts regarding solar energy, the following three are the most important ones. The first is that more and more people are installing solar panels to reduce electricity bills. Second, solar power is clean and does not contribute to climate change. The third and most important fact is that solar energy is the future. From these solar energy statistics, we can see that the solar community in the US became four times bigger in the last four years, which is proof of the statement mentioned above.
Leave a Reply
You must be logged in to post a comment.