Author: Darko Jacimovic

  • 30 Astounding Internet Privacy Statistics in 2024

    30 Astounding Internet Privacy Statistics in 2024

    Global issues revolving around internet privacy statistics have always been crucial topics. After all, stealing and exploiting someone’s personal data isn’t limited only to physical means. It can also be possible online. As technology advances, new concerns have emerged in recent years.

    Nowadays, anyone with an online profile might be at risk, especially those who are not very familiar with how the internet works. To find out how you can protect your online privacy, here’s a master list of the statistics that will astound you.

    Surprising Internet Safety Statistics to Keep in Mind (Editor’s Choice)

    • The most prevalent kind of online data breach in the world is identity theft
    • In 2020, over 91% of internet users in Japan were concerned about online privacy
    • Iceland has the highest internet freedom percentage
    • In the United States, 95% of digital shoppers don’t trust online shopping ads
    • 79% of US online consumers don’t think companies would take responsibility for online privacy issues
    • Out of 194 countries, 128 have legislation to protect data and privacy
    • The highest percentage of people aware of its country’s online privacy laws is in India
    • Around 9% of digital users residing in the United States consider digital privacy fake

    Interesting Internet Privacy Facts

    The internet can be used in hundreds of ways. With millions of individuals using it every day to browse data, perform online purchases, and manage social media accounts, it is important to protect your personal information. Here are some facts you should consider to gain insight into how your online data can be compromised.

    1. Over 164.68 million private records have been exposed in the United States, according to the invasion of privacy statistics.

    (CNBC)

    The global issue of online privacy has gained popularity in the last few years, and for a good reason. According to research, around 540 online data breaches have already been reported in the US in the first quarter of 2020. If not prevented, this number can increase in the second part of the year.

    2. 48% of Americans think they have no control over their online privacy and security regarding the search terms they use.

    (Pew Research Center)

    A significant part of handling online privacy is user control. Maintaining safety on the internet means that you should control how much personal information you put online.

    Many US citizens agree with this perspective. Around 48% think that they have zero control over the search terms they enter in search engines.

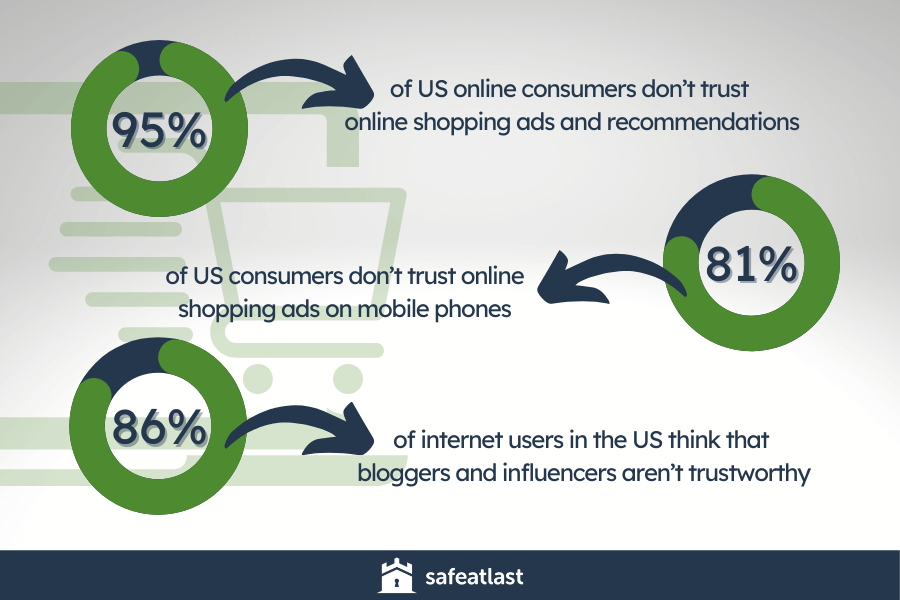
    3. 95% of US online consumers don’t trust online shopping ads and recommendations.

    (Statista)

    When you regularly shop online, the sites you are visiting will analyze your standard search terms. They will then show ads and recommendations in accordance with your shopping preferences.

    However, this modern feature is not very popular among digital users. According to a study, 95% of online buyers in the US don’t trust online ads shown on VR or AR headsets.

    4. Consumer privacy statistics show that 81% of US consumers don’t trust online shopping ads on mobile phones.

    (CSA)

    Mobile ads can often be perceived as more bothersome due to their “unskippable” feature. This situation can be prevented by installing an ad blocker on your phone — the same thing people usually do on their desktop devices. 

    5. 86% of internet users in the US think that bloggers and influencers aren’t trustworthy.

    (Statista)

    Surfing statistics have shown that with the rise of the internet, new types of entertainment have become mainstream. Examples of such are bloggers and influencers that can be found on every social media platform.

    However, internet users seem to be distrustful of these online celebrities. According to a recent study, around 86% of internet users living in the US do not trust bloggers and influencers.

    Internet Privacy Statistics

    6. In 2019, 47% of US Baby Boomer mobile users were concerned about data privacy issues.

    (Statista)

    Research showed that approximately 47% of mobile users in the US were worried about their data privacy. It is also worth noting that this percentage came from American adults born in the Baby Boomer era spanning from 1946 to 1964.

    In contrast, those belonging to Gen Z were the least concerned about this issue — only 28% of them. As this demographic refers to individuals who were 8–23 years old, they probably were not fully aware of internet dangers.

    7. Identity theft is one of the most popular privacy concerns with technology worldwide.

    (Statista)

    The most common type of data breaches that might occur online is identity theft. With many online platforms and services asking for users’ personal information, you should be careful when giving your data. In an updated survey, identity theft accounts for 65% of the data breach incidents from all over the world.

    Find out how to deter identity theft.

    8. Google received around 40,000 information requests from federal government agencies January–June 2020.

    (Los Angeles Times)

    Out of them, over 15,500 were subpoenas. Generally speaking, federal agencies can request personal information from online platforms for legitimate reasons. 

    An example of that is when a federal service needs a specific individual or group’s online data to proceed with the investigation. 

    9. Internet privacy statistics show that 34% of US users feel uncomfortable with tech corporations sharing their location data with the government during the pandemic.

    (Statista)

    Numerous digital programs and innovations have been made to help during the pandemic. One such example is government agencies keeping track of individuals’ location data.

    However, around 34% of digital users in the US feel very uncomfortable with tech corporations sharing their location with government agencies, while only 12% feel very comfortable with it.

    10. According to internet privacy statistics, 79% of Americans don’t believe that companies will take responsibility in case of data misuse.

    (Pew Research Center)

    Although data breach incidents can be prevented, they might be inevitable for many corporations. In such scenarios, the company should take responsibility and ensure the privacy of its customers. Approximately 79% of digital consumers located in the US don’t entirely trust tech companies. It is mostly applicable to data misuse situations.

    Global Privacy Concerns Statistics

    The issue of online security is not limited only to a few countries. It is now a global matter that is taken seriously by many. Here are some stats and facts that will tell you more about internet privacy from all over the world.

    11. 128 out of 194 countries have legislation to protect data and privacy. 

    (UNCTAD)

    As per Internet safety statistics, that translates to nearly 66% of countries having legislation. The primary reason for these legislations is the storing, use, and sharing of personal data to third parties without consumers’ approval. 

    12. Iceland has the highest percentage of internet freedom.

    (Statista)

    Internet freedom can vary depending on the country. Many parts of the world provide an open door for internet usage. For example, Iceland has the highest rating for internet freedom with 95 index points, followed by Estonia with 94 index points.

    13. Australia, the US, and Italy received 76 index points for practicing internet freedom.

    (Statista)

    The data privacy statistics in 2020 show how global laws work for privacy control and internet freedom. Due to technological demands, several countries have a high Internet Freedom Index. Estonia is second on the list with 94 index points, followed by Canada and Germany with 87 and 80 points.

    14. China has the least internet freedom with 10 index points.

    (Statista)

    Several parts of the world have limited the amount of internet freedom for their citizens. A stark example is China — one of the rising technological giants on the planet. According to the updated global censorship statistics and facts, China occupies the last place with 10 index points.

    15. Internet users in Nigeria are most concerned about their internet privacy.

    (Statista)

    Due to the growing global concern about data privacy, many countries have raised awareness about its potential risks. According to Statista, approximately 82% of online users in Nigeria have become more concerned about their privacy than in the previous year.

    16. 91.6% of internet users in Japan were concerned about online privacy in 2020.

    (Statista)

    Japan has also become one of the tech industry leaders. According to internet privacy statistics, around 91.6% of internet users from Japan expressed concern about internet privacy. Moreover, older generations had the tendency to worry more. 

    17. According to online privacy statistics, people in the United States, Indonesia, and Mexico are most concerned about their internet privacy due to foreign governments.

    (Statista)

    Aside from being aware of their respective country’s online privacy laws, various users have also expressed concern about potential privacy breaches by foreign governments. While it might seem far-fetched, breaches are possible risks in the rapidly developing technology era.

    According to a survey, the US, Indonesia, and Mexico’s awareness rates on internet dangers statistics have increased. The US has an awareness rate of approximately 77%, Indonesia ranked with 75%, and Mexico had a total percentage of 72%.

    18. India has the highest awareness rate concerning online privacy’s importance and their country’s online privacy laws.

    (Statista)

    Raising awareness about this global issue is an important task, especially in the digital transformation era. Online privacy facts show that digital users in India have the highest awareness levels of their country’s internet privacy laws.

    19. In 2019, 59% of internet users in Germany were aware of their country’s internet privacy regulations.

    (Statista)

    Aside from India, other communities have also become more aware of their country’s online privacy regulations. According to the internet and social media safety statistics from 2019, around 59% of online users in Germany were aware of internet privacy rules and regulations in their country.

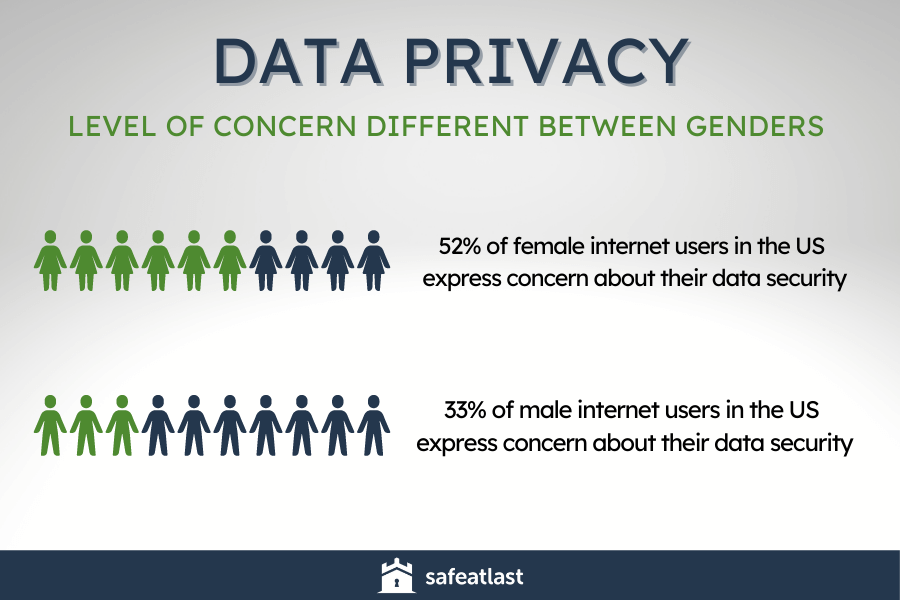
    20. 52% of female internet users in the US expressed concern about their data security.

    (Forbes)

    Women generally spend more time on the Web and use social media for personal reasons. Moreover, around 52% of women in the US are concerned about their data privacy, while their male counterparts stand at 33%.

    Internet Privacy Statistics #2

    Internet Safety Facts and Statistics

    The risks of browsing the internet can be prevented by employing online protective measures. To improve your online safety, you should familiarize yourself with more factual stats you can find below.

    21. 74% of US internet users are concerned about online privacy.

    (Statista)

    A staggering amount of digital users from the US have become concerned about their online privacy. In an updated study about digital users’ privacy, around 74% of internet users in the US expressed their worries about their internet privacy rights.

    22. 33% of US internet users partially understand their country’s law about online privacy.

    (Pew Research Center)

    If the lack of awareness about this serious topic is not remedied, it can lead to potential privacy issues in the future. As can be seen in an up-to-date review of internet privacy issues from 2019, only 33% of internet users from the US have obtained general or in-depth knowledge about their country’s laws and regulations about data privacy.

    23. 9% of US internet users think that digital privacy is not real.

    (Statista)

    While it is a growing issue that demands global attention, some individuals choose not to believe in it. In a survey about social media safety, 9% of US internet users believe that online privacy is a myth.

    24. According to privacy invasion statistics, identity theft and fraud are the most prominent internet privacy concerns in the US.

    (Statista)

    As mentioned before, identity theft and fraud are the most concerning privacy issues in the US. Obtaining general or in-depth knowledge about data privacy laws can help you protect your sensitive information from data breaches.

    25. Only 23% of US internet users trust social media ads.

    (Statista)

    Social media privacy statistics show that not a lot of internet users in the United States feel safe on social media. Although social media has become a space for everything, including advertisements, clicking on a suspicious link can pose a risk to your online safety. It seems that a great percentage of internet users in the US think in the same way, as only 23% of them put their trust in ads on social media.

    26. Privacy statistics show that only 33% of internet users frequently change their passwords.

    (Statista)

    One of the protective actions you can take for maintaining online safety is frequently changing your passwords. It is recommended that you change your passwords at least once in three months.

    However, not everyone follows this word of advice. As stated in a recent study conducted on internet users worldwide, only 33% of global online users frequently change their passwords.

    27. Online safety statistics show that 45% of internet users worldwide avoid opening emails from unknown sources.

    (Statista)

    Unknown email addresses are also considered online risks, and many internet users agree on a global scale. According to recent statistics, around 45% of online users worldwide avoid opening suspicious email messages.

    28. 41% of worldwide users disclose less personal data on the internet.

    (Statista)

    Approximately 41% of digital users worldwide decided to share less personal data on the internet. As said before, maintaining privacy can also be about sustaining control. You have to think twice before clicking on an online post and be careful about sharing your details.

    29. Cookies and internet privacy stats show that 16% of internet users worldwide don’t take any protective measures online.

    (Statista)

    Global awareness about online privacy has increased and gained momentum in recent years and is expected to continue growing. However, many users are either unaware of or not paying attention to online risks. Around 16% of digital users worldwide do not implement any protective measures for protecting their personal data.

    30. According to internet safety statistics, only 36% of internet users worldwide have an antivirus program.

    (Statista)

    Installing an antivirus program is probably one of the necessary steps in online protection. It prevents data breaching viruses from attacking your computer system where private and personal data might be stored. However, only 36% of people worldwide have an antivirus program installed on their computers.

    Conclusion

    The internet potential is vast and sometimes unknown. While it is mostly used for communication, entertainment, and other purposes, it can also be a space for privacy risks caused by online perpetrators, as stated in the recent stats of internet privacy. That is why you can use advanced and straightforward methods to protect your online experience.

    Some ways of doing so are updating your passwords as frequently as you can or perhaps consider using a password locker and manager. Double-checking the web pages you visit and the email messages you open can also help. The worldwide demand for increased data security has become a significant motivator for tech corporations to step up, which means you should contribute as well.

    People Also Ask

    How much personal data is on the internet?

    As almost everything has become digital nowadays, it might be unavoidable to share personal data online. This is usually the case when registering on an online platform.
    If we try to find out how much personal data is on the Web, we should consider the total sum of data held by all the big online storage companies like Google, Facebook, Amazon, and Microsoft. It is estimated that these companies store at least 1.2 million terabytes of data.
    However, that figure excludes other big providers like Dropbox, Barracuda, and SugarSync, so the numbers are actually much higher.

    Is privacy guaranteed on the internet?

    Like many actions in life, browsing the Web can bear potential risks. However, these risks can be prevented. Social media privacy facts show that social media users from the US have taken online protective measures very seriously.
    Examples of such are the following:
    – Updating online accounts and passwords
    – Using the best antivirus program
    – Checking the web pages they visit to see if they are verified
    – Limiting the personal information shared on the internet

    How important is privacy on the internet?

    Privacy on the Web is an essential factor to consider, especially if you want a safe experience online. An excellent antivirus program can make all the difference. If you have some privacy issues with social media, it can prevent hacking your accounts and obtaining personal data. It also enables you to digitize your daily tasks, such as shopping, without worrying about data privacy.

    Do users care about privacy?

    Privacy issues are an important concern for many users. Around 75% of people in the US care about online privacy. This percentage is expected to grow in the next few years, as digitalization takes over everything.
    However, the primary interest in this topic may vary depending on the user demographic. According to internet privacy stats, baby boomers are most concerned about online privacy. In contrast, young individuals from Generation Z are least concerned about data privacy.

    Is online privacy dead?

    US users agree that online privacy is vital in the modern age. However, various external factors might affect the level of privacy a digital consumer can attain.
    As statistics about internet privacy show, several countries have limited internet freedom, leading to less user privacy protection. On the other hand, tech companies are on the fast advancement track. Major corporations have stepped up and launched security protocols for their consumers.

    How can I get internet privacy?

    Attaining internet privacy doesn’t have to be a complicated process. For the most part, taking a few precautionary steps is all you need to ensure your data security. An example of that is the simple act of thinking twice before clicking on an unreliable link.
    Increasing your awareness by checking internet privacy statistics can also be a huge help. This in-depth article has provided a complete lowdown on risk and prevention strategies you can employ.

  • Terrifying Cybercrime Statistics – Protect Yourself in 2024

    Terrifying Cybercrime Statistics – Protect Yourself in 2024

    Today we are almost entirely dependent on hackable technology. Your phone, your computers, your car, your bank and credit card purchases, even your smart home devices and alarm systems (IoT) can be hacked into. In fact, a hacker attack takes place worldwide every 39 seconds, affecting one in three Americans each year.

    In the following article, you’ll get a chance to see some cybercrime statistics from a variety of dependable sources that will help you understand the real threat you’re facing as a business, a person, and an employee. You’ll also learn a bit about how you can protect yourself. 

    Cybercrime is almost constant, committed by professionals and often extremely well-organized groups. As you will see, it’s also increasing in scope, sophistication, and cost.

    Important Cyber Crime Facts and Statistics (Editor’s Picks)

    • At least 330 million people were victims of some type of cybercrime in 2020
    • Two out of three companies worldwide have experienced a cyber attack in the past year
    • There were 1.51 billion IoT device breaches in the first half of 2021
    • Google predicts that 20% of social accounts will be compromised sooner or later
    • A day of botnet activity for hire can cost $67
    • More than $400 million ransom was paid through cryptocurrencies in 2020
    • $262.4 billion was spent on cybersecurity in 2021, and it will grow to $459 billion in 2025

    General Cybercrime Statistics, Scope and Frequency

    1. In 2020, at least 330 million people were victims of some type of cybercrime. 

    (Norton)

    That’s in 10 countries, many of which have outdated or even no cybercrime laws. Sometimes, you won’t even notice you were a target, like in case your computer becomes a part of a bot network. In some cases, you might even have to face financial losses. 

    2. Cybercriminals generate revenues of $1.5 TRILLION annually.

    (Dr. Michael McGuire, University of Surrey)

    The people behind recent cybercrimes no longer fit the stereotypical idea of a kid in a hoodie operating from his mom’s basement, at least not entirely. Today, we are up against organized crime, a professionalized underground industry that pays off big time. 

    3. Two out of three companies worldwide have experienced a cyber attack in the past year.

    (Cybint)

    Individuals are not the only victims of cybercrime – many companies, usually small to midsized ones, have to face increasing data breach or denial of service risks. This can answer questions about how many cybercrimes are committed each year. Companies can lose a significant amount of money in lawsuits and permanently damage their clients’ trust.

    4. Credit or debit card fraud – almost 30% of all identity thefts.

    (III)

    Credit card frauds happen when a person steals your card information and then uses it to gain access to cards and bank accounts. Even as banks try hard to make some types of attacks more difficult, criminals still turn a profit, and everyone needs to stay tuned to the new developments.

    5. It takes 228 days, on average, for a company to even realize it’s been hacked.

    (Varonis)

    That’s one of the most frightening cybersecurity statistics , since criminals can mess around with your confidential data for months on end before you even notice something’s wrong, and start fixing the damage.

    6. 35.14% of computers in China are in danger of being infected by malware.

    (Kaspersky)

    China is the country with the highest rate of infected computers in the world, which does suggest to a degree that China is primarily the victim, not the perpetrator of cybercrime.

    Types of Cybercrime

    The most common types of cybercrime experienced by consumers or someone they know include: 

    7. Viruses – the number of detected malware surpassed 700 million.

    (Statista)

    This could lead to software and even hardware failure, identity or personal information theft or nothing at all, no visible damage. Even then, a Trojan could even make your device a zombie server sending out spam, consuming your network and internet resources. Therefore, make sure to protect yourself with the finest antivirus software.

    8. Stolen account password – cyber security statistics show that there are around 15 billion of them for sale on the Dark Web.

    (Newsweek)

    Your password is a part of authentication, a secret only you are authorized to know, that helps you access a system. Using upper and lowercase letters along with numbers and some symbols is one way to fight brute force attacks, but this confidential information is still often stored and easily accessible in poorly protected devices. Or if you prefer, buy the best password manager for your needs to ensure all round protection.

    9. Email or social media hacking – Google predicts that 20% of social accounts will be compromised sooner or later.

    (ZeroFox)

    Once you’ve been hacked on a social media channel, the attacker will observe communication and use this insight to access other accounts for further criminal actions. This is usually done for financial gain – asking a bank to transfer money, and/or causing emotional damage, in case of extortion.

    10. Phishing – almost seven million new scam and phishing pages were created in 2020.

    (Bolster)

    Giving out account information to the attacker pretending to be your bank or other authority. This is done via email, message (smishing) or phone support (vishing). The attacker might ask for personal information like password, or ID number, or might ask you to configure your computer to suit your needs. A very productive type of cyberattacks as companies still ignore the human factor, and sees security as a solely technical problem.

    11. $170,404 is the average amount of cash attackers demand.

    (Sophos)

    Out of 357 companies that paid ransom, 20 of them paid just $10,000, while the highest amount was $3.2 million. The United States are the most targeted country in the world when it comes to ransomware, as they are the most willing to actually pay up, thus accounting for most of the global ransomware profits.

    12. People in 86% of organizations click on phishing emails.

    (Tessian)

    When talking about the general population that cannot be trained by companies, including customers, the stats are worrying. People tend to believe these pretend links are legit, and a fake website you might be led to is dangerous to an untrained eye.

    13. 75% of malware in 2021 was delivered by email.

    (HP Wolf Security)

    One of the most important cyber crime statistics and trends today is that hacking is becoming less and less prevalent as a technical problem. And as Medium noticed, using humans as the weak link is a growing trend, and it’s becoming more and more expensive and difficult to raise awareness of employees worldwide.

    14. In 2020, people sent 791,790 complaints to the Internet Crime Complaint Center.

    (IC3)

    A good proof that social manipulation hackers use to gain access to confidential info is so successful that even the FBI got involved. That year, the adjusted costs amounted to over $4.2 billion in the USA.

    15. More than $400 million ransom was paid through cryptocurrencies in 2020.

    (Chainalysis)

    Cybercrime and Cryptocurrency have established quite a reputation for being interlinked, even though the most popular cryptocurrencies like bitcoin or monero are relevant, although their position is quite overhyped as part of the cybercrime economy.

    16. The laundered money held in Bitcoin amounts to $2.8 billion annually.

    (Comply Advantage)

    The blockchain system supporting the cryptocurrency is eroding criminals of their anonymity these days, since doing business is a matter of public record, and web cookies are quick to link money transfers to individuals.

    17. The number of DDoS attacks increased by 55% in 2020.

    (F5)

    DSoS, or distributed denial-of-service, is one of the most prevalent cybercrime trends and is exactly what it sounds like: an effort to make a certain website unavailable for hours, days, even weeks at a time, by overflowing it with traffic from hijacked computer systems.

    18. 66% of small businesses suffered a cyberattack

    (Kaspersky)

    This affects them a great deal, since many of them go out of business within the first couple of months of being hacked.These business cybercrime statistics matter a great deal when you have a small client base, and your reputation matters a great deal.

    19. A day of botnet activity for hire can cost $67.

    (ZDNet)

    The hourly rate is around $9. It takes a huge amount of traffic to crash a website, and that’s why many botnets are bought and sold sold on the underground online market, fueling cybercrime growth.

    20. By 2030, there will be almost 25.5 billion connected smart devices worldwide.

    (Statista)

    Smart doorbells, smart fridges, smart lights, watches, heating, cars, home security systems, and even machines in your hospital: their one big characteristic is that they are incredibly easy to hack, as security is rarely a priority despite the fact that they are sleek mediators to stealing important data, or enabling DDoS attacks.

    21. There were 1.51 billion IoT device breaches in the first half of 2021.

    (IoT World Today)

    Hacked IoT devices enable easy access to much larger systems. They usually don’t have an OS or antivirus protection. This makes them easy targets, and the number of attacks is on the rise. In 2020, Kaspersky had registered only 639 million such attacks.

    22. Singapore’s government health database was hacked, stealing 1.5 million records.

    (GovInsider)

    In 2018, even the Prime Minister of Singapore, Lee Hsien Loong had his data stolen. The attackers had accessed, copied, and possibly sold info containing names, identity card (IC) numbers, addresses, and dates of birth.

    23. IoT devices suffered more than 1.5 billion attacks in 2021

    (Digit)

    These cybercrime statistics are a bigger deal than anyone seems to realize, and experts believe that companies are not allocating enough resources for smart device protection. Worldwide, companies seem slow to learn the risks and security implications of this weak link.

    24. More than 24,000 mobile malware is blocked on a daily basis.

    (Kaspersky)

    This is no surprise with today’s mobile-first technology. Cybercrime follows the traffic and the money. Hackers also try to take advantage of the fact that our phones are not as protected as our computers.

    25. Hacking statistics say that 93% percent of all mobile transactions in 2019 were blocked as fraudulent.

    (Help Net Security), (Statista)

    Coming as no surprise in today’s mobile-first technology, with mobile apps generating more than 50% of total web traffic. Some of the more challenging security issues stem from the competitive market’s demand for opening up our systems for connected, online use.

    The bank cyber crime statistics are increasingly disturbing now that users’ data is available to third parties. Criminals take advantage of the convenient, single sign-in we use to view our information or pay our bills. Before this new trend, the bank systems were closed.

    26. In 2017, 6M celebrity Instagram accounts were exposed.

    (The Telegraph)

    Some of the celebrities affected were Harry Styles, Selena Gomez, Taylor Swift, and Emma Watson. The dark web was stacked with contact details and personal life.

    (The New York Times)

    One worker in the Pentagon thought it wise to click on a twitter link marketing a simple family vacation. The U.S. Department of Defense has thousands of social media accounts, used as means of communication between personnel, friends and family. This proved to be a huge liability.

    What Are Some Examples of Cyber Crimes?

    28. In 2017, Wikileaks released more than 8,761 classified CIA documents.

    (The Guardian)

    The biggest ever leak of confidential documents from the CIA, this info describes in great detail the way that the CIA breaks into phones, communication apps and other electronic devices.

    29. In 2018, 500 million guests were compromised in the attack on the Marriott hotel chain.

    (BBC)

    Leaked info from this web crime included passport info, credit card details, as well as names & phone numbers of guests who checked into the Starwood properties on or before Sept 10 the same year.

    30. In 2017, Yahoo admitted that 3 billion user accounts were hacked

    (The New York Times)

    Namely, all of them. The first time Yahoo came out with this info was in 2016, when only 500+ million breaches were accounted for, so it took a while to even realize the true scope of the breach. Global cyber crime statistics show that this is still the biggest breach in history and is not expected to be overtaken.

    31. In 2016, FriendFinder Networks Inc was attacked, leaking 339 million personal accounts.

    (CSO)

    As this is a dating and adult entertainment site, the particularly sensitive nature of the leaked information like sexual orientation and if a user was looking for extramarital affairs caused significant emotional harm. This is still one of the biggest breaches in this field.

    32. In 2015, The Ashley Madison breach leaked info on 32 million users 

    (Reuters)

    The results varied from disheartening to downright tragic. With Ashley being primarily an adultery dating site, the data breach lead to numerous divorces, even suicides. Talking about distressing cybercrime incidents, this cost a staggering $11.2 million in lawsuits. 

    33. In 2017, 2.4 million records containing personally identifiable information was stolen from Equifax.

    (FTC)

    This data analytics and technology company reported a huge data breach that affected 147 million people. The company agreed to pay settlements of around $425 million.

    34. In 2015, Anthem Inc. experienced a data breach that affected around 80 million people.

    (Reuters)

    Above, we mentioned the theft of healthcare data. One of the most well known cases leaked info containing social security numbers, medical IDs, birthdays, addcyber theftresses, names, even income data.

    Famous Cybercrime Convictions

    Arrests and convictions for cybercrime are very rare. This is because the perpetrators are hard to identify, and they often operate from countries that have no extradition agreements with targeted countries. But every once in a while, a cybercrook gets caught and convicted.

    35. Mark Vartanyan accessed personal info from 11 million computers worldwide, causing $500 million in losses.

    (Crebs On Security)

    This hacker was convicted of cyber theft and developing, maintaining and distributing malware between 2012 and 2013, and then again in 2012.

    36. Susan Atrach hacked into celebrity email accounts in 2018.

    (Mirror)

    This 21-year-old was charged for a number of crimes after having hacked into Selena Gomez’s email account, taking hold of sensitive, personal data. Her crime involved stealing computer data to conduct fraud, identity theft, obtaining money or data using illegal means and hacking into celebrity accounts.

    37. In the UK, four in ten businesses were subject to cyberattacks in the past 12 months.

    (Gov.uk)

    Moving on to cybersecurity statistics in the UK – the 2021 Cyber Security Breaches Survey these attacks cost every business £8460, per successful attack, on average. This amounts to billions of pounds, not counting the emotional damage and personal costs of buying into various types of fraud. Many small businesses close after suffering such an attack.

    38. Hackers can make up to $2 million per year.

    (Dark Reading)

    When answering the question how much money do cyber criminals earn, one must consider their level of expertise, whether they belong to an organization, and how many projects they are working on. Particularly successful cybercriminals make $167,000 every month. A middle-of-the road hacker makes up to $75,000.

    39. $262.4 billion was spent on cybersecurity in 2021, and it will grow to $459 billion in 2025.

    (Cybersecurity Ventures)

    The ever-increasing number of cyberattacks and data breaches is forcing companies of all sizes across the world to invest in security. So how much money do companies spend on cybersecurity has increased in recent times, in part because of the new regulations imposed by the General Data Protection Regulation (GDPR), a shifting buyer mindset, an increased awareness the importance of cybersecurity, and the overall evolution to a digital business strategy.

    40. The starting cyber security assessment cost for a business with at least 50 employees is around $10,000.

    (TrustNet)

    The answer to the question how much does a cyber security assessment cost requires a multifactor analysis that relies on the individual scope, size, and complexity of your business, your industry (some are high-risk, and some are not), the size of your organization, number of offices, and even details like the complexity of your company’s inner workings.

    In the case of evaluating the cost for a cybersecurity and security risk assessment, most analysts advise checking the total cost of ownership, which involves your methodology, experience, and finally, product quality and value.

    Cybercrime Statistics by Country:

    41. An estimated 47% of all computers in China are infected by malware.

    (Statista)

    According to data available, the runner-up is Turkey with 42.88% of all computers infected… followed by Taiwan, with 38.98%.

    42. In 2017, there was an average of 24,089 records breached per country.

    (Purplesec)

    India was by far the leading nation with as many as 33,000 breaches. The USA counted 28,000.

    43. Chinese cyber attacks accounted for over 35% of all cyber attacks in India in 2019.

    (Indian Defence Review)

    In 2019, India experienced 50,000 cyberattacks from China alone. Other countries that targeted India were Slovenia, Ukraine, the Czech Republic, and Mexico.

    Conclusion

    Cybercrime is on the rise and we are becoming more and more dependent on technology, from our smart devices, to databases in schools and hospitals. The biggest hope in overcoming these issues seems to lie in sophisticated security techniques, and most of all, educating the general public as well as employees about cyber security facts.

    Many companies lose millions of dollars on lawsuits caused by cyberattacks. Cybercrime has become a well thought-out, complex, and expensive form of organized crime. This is why any company with a good sense of risk assessment ought to get some sort of cybersecurity for their system. And don’t forget, educating your employees and protecting your IoT devices is a must if you don’t want to be featured in our next cybercrime statistics article.

  • 22 Hopeful Solar Energy Statistics to Excite You in 2024

    22 Hopeful Solar Energy Statistics to Excite You in 2024

    The sun has been an essential resource for humanity since the dawn of time, and Bell Laboratories made the first solar panel in 1954. Since then, solar energy statistics show solar power as one of the fastest-growing industries in the United States.

    Solar power is the conversion of sunlight into electricity and is probably one of the most significant inventions of the 21st century.

    That said, we’ve put together some fascinating statistics that will help you understand just how much renewable energy has grown over the years and what the future holds. Without further ado, let’s jump into them.

    Essential Solar Energy Facts & Stats (Editor’s Pick)

    • Solar energy is accountable for around 1.7% of the US electricity generation
    • California installed 23 GW of solar capacity in 2019
    • At 205 GW, China had the largest installed solar capacity globally in 2019
    • In 2020, more than 2,400 kWh of electricity was generated from fossil fuels
    • Since 2000, solar energy production has increased, and coal production has decreased
    • Up to 97% of solar panels are recyclable
    • Since 2016, the US solar community has quadrupled
    • A home can save up to $30,000 over its solar panel system’s lifetime

    General Solar Energy Statistics

    Have you ever wondered how much solar energy the US generates and whether it is a leading country in solar energy generation?

    In the next set of stats, you can find the answers to these questions and much more. So, if you are interested, make sure you read on.

    1. Solar energy makes up 1.7% of the US electricity generation.

    (EIA)

    According to solar energy statistics from 2019, over 4,127 billion kilowatt-hours of electricity were generated in electricity generation facilities all over the US. Out of that number, 62.6% of the electricity was from fossil fuels, 19.6% from nuclear energy, and 17.6% from renewable energy sources.

    Solar Energy Statistics

    2. By the third quarter of 2021, the US had installed 113.5 GW of solar PV capacity. 

    (SEIA)

    According to solar energy statistics, that was enough to power almost 22 million people in the United States. Moreover, in the third quarter alone, it installed around 5.4 GW. 

    For the first time in the industry’s history, residential solar installations surpassed 1 GW and over 130,000 systems in only one quarter. On top of that, utility-scale solar installations reached another third-quarter high at 3.8 GW. 

    Based on some solar energy growth projections, we can expect that the annual installation of solar panels will only increase in the future. 

    3. In 2019, California installed 23 GW of solar capacity.

    (CNBC)

    California has been the leader in installing solar energy in the United States for a few years in a row. As almost 17% of California’s electricity comes from solar energy, it is no surprise that the country is the leader with more than 23 GW of installed solar capacity. North Carolina is second with around 4.5 GW of installed solar, and the third is Arizona with 3.6 GW.

    4. Asia dominated the global solar capacity expansion in 2019, accounting for around 60% of the total. 

    (Irena)

    When it comes to generating renewable energy by country in 2019, China, Japan, Vietnam, the Republic of Korea, and India were the countries with the highest amount of new capacity. 

    However, we can’t leave behind some other countries, which also showed substantial increases, like the US, Spain, Germany, Australia, and Ukraine.

    5. In 2019, China had the largest installed solar capacity (205 GW) globally. 

    (NS Energy)

    It produced 223.8 TWh of electricity. So, this statistic shows that, when it comes to the generation of solar energy, the percentage is the highest in China. More specifically, the Huanghe Hydropower Hainan Solar Park was China’s largest single solar project (2.2 GW). 

    Furthermore, the US accounted for the second-largest installed solar capacity (76 GW) and produced 93.1 TWh of electricity.

    6. A total of 1.47 million solar roofs were identified in the United States.

    (Clentecnica)

    Researchers at Stanford University made a solar energy report in which they mapped almost every solar roof in the US. Using the satellite, they correctly identified 93% of solar rooftops across 48 states and got the number of over 1.47 million of them.

    Interestingly, before this type of solar satellite mapping, scientists made solar maps by measuring the total amount of sunlight that arrived at a given spot.

    Solar Energy Statistics #2

    Solar Power Statistics

    These statistics are essential because they can help you better understand solar energy and solar energy generation. That said, in the next set of stats, you will see just how much solar power is generated in the US and learn a thing or two on community solar.

    7. The average US solar installation is about 5 KW.

    (Solstice)

    The solar energy facts and information tell us that the average US solar home has about 20 solar panels, and all of them generate about 5 KW. However, if you want to cover 100% of your energy usage, you may need more solar panels, especially if you live in a big house or have central air conditioning.

    Solar Energy Statistics #3

    8. In 2019, 72.3 billion kWh were generated from solar sources.

    (Statista)

    The renewable energy statistics show that the US invested a lot into renewable energy sources between 2000 and 2019. In 2019, 72.3 billion kWh were generated from solar sources, 273.7 billion kWh from conventional hydroelectric power, and 300 billion kWh from wind sources.

    9. In the first quarter of 2021, 131 MW of community solar was installed. 

    (SEIA)

    Compared to the first quarter of 2020, that was a 15% decrease. Moreover, the amount was nearly 70% lower than the last quarter of 2020. 

    However, lower first-quarter numbers don’t have to be signs of a long-term trend. The solar community is on the rise, and solar energy statistics from 2020 and 2021 show precisely that.

    10. The global investment in solar energy was $141 billion in 2019.

    (Statista)

    According to the solar panels stats from 2019, the world saw many new investments in the renewable energy sector. The investments in solar energy technologies came to $141 billion. The only industry that was supported more was the wind power sector that received over $142 billion. 

    11. Solar has ranked first or second regarding electric capacity added in the last seven years.

    (SEIA)

    In the last ten years, solar has achieved a growth of about 40%. The following fact on solar energy doesn’t come as a big shock since the solar capacity has ranked first or second for seven years in a row. However, 2020 saw the most significant success, as solar produced 43% of all new electrical capacity in the US — the largest share in history.

    12. 89% of adult US citizens supported solar farms in 2019.

    (Pew Research)

    The recent energy statistics show that the US has been investing more and more in renewable energy. In 2019, it had full support from US citizens — 9 out of 10 homeowners said they would install solar panels to save money on electricity bills. However, a mere 9% opposed it, and 2% were undecided. In addition, 83% of US citizens supported wind turbine farms, and only 14% were against them.

    Solar Energy vs. Fossil Fuels Statistics

    The difference between solar energy and fossil fuels is that solar energy is a renewable energy source, while fossil fuels are nonrenewable resources. You will see more significant differences between these two energy sources in the next set of stats.

    13. Electricity generated from fossil fuels costs 5–17 cents per kWh.

    (Consumer Affairs)

    Many consumers burn fossil fuels because they think it is much cheaper and more convenient. However, going solar can be a money-saver in the long term. Solar system statistics tell us that solar renewable energy is better for the environment and the average cost is somewhere between 3 and 6 cents per kWh.

    Solar Energy Statistics #4

    14. Over 2,400 billion kWh of electricity was generated from fossil fuels in 2020. 

    (EIA)

    That equated to fossil fuels (natural gas, petroleum, coal, and other gases), making 60.6% of the total electricity generation that year. Overall, more than 4,000 billion kWh of electricity were generated in US utility-scale electricity generation facilities in 2020. 

    15. Since 2000, solar energy production has gone up, and coal production has declined.

    (Pew Research, IEA)

    Statistics on solar energy use in the US show that solar has achieved the most considerable growth compared to any other energy source. 

    On the other hand, coal had its peak in 2008 when about 1.2 billion tons were mined. However, in 2019, coal accounted for around 36.7% of the total electricity production.

    Solar Energy Facts

    Many solar power and panel facts can be found on the Web. However, we’ve picked some of the most interesting ones that will surely catch your eye. So if you want to learn more about solar energy, keep on reading.

    16. SolarStar is the largest solar farm in the US.

    (Solstice)

    We will start with one of the most interesting solar power fun facts. When SolarStar was built back in 2015, it was the world’s biggest solar farm. Located in California, it now has over 1.7 million solar panels spread out over 13 square kilometers. That said, SolarStar produces about 579 MW of solar energy and can power 255,000 homes.

    17. “Solar photovoltaic installer” is the fastest-growing job in the US.

    (CNBC)

    The Bureau of Labor Statistics analyzed over 20 jobs to see which would achieve immense growth by 2026. Although several jobs had double-digit growth, solar power stats showed that the career that came first with the 105% growth was a solar photovoltaic installer. This is just one of many facts on how the solar energy industry will continue to grow in the future.

    18. 90–97% of solar panels are recyclable.

    (Solstice)

    This is just one of many facts about why solar energy is good for the environment and climate change. According to the solar panel statistics, 90–97% of all solar panels can be recycled into new ones or sold for a great price on any commodity market. Experts on solar energy also estimate that recyclable solar materials’ value will reach $15 billion by 2050.

    Solar Energy Statistics #5

    19. The average home can save $10,000–$30,000 over its solar panel system’s lifetime.

    (EnergySage)

    Solar panels are not just great for the environment; in addition to smart home systems, solar panels can help you save some money as well. However, many factors impact the amount of savings. 

    In detail, some of the most critical ones are local electricity rates, the angle and size of the home’s roof, and direct sunlight during the day. That is to say, according to solar panel stats, Massachusetts is the state with the greatest 20-year-period savings in the US ($42,021). 

    20. The US community solar capacity has quadrupled since 2016.

    (E360)

    One of the many interesting solar power facts is that the solar community has become four times bigger in four years. In other words, the solar community generated 300 MW in 2016, while now it is generating more than 1,400 MW, which is enough to power 266,000 households.

    21. Solar panels don’t need direct sunlight to generate electricity.

    (Harrisons Energy)

    If we take a closer look at the solar panel facts, we can see that solar panels don’t need direct sunlight to generate power. The photons in the natural daylight are responsible for solar panels generating electricity, so they don’t need exposure to direct sunlight to produce energy.

    22. The first solar panel was invented in 1940.

    (Axpo)

    Although Alexandre Edmond Becquerel discovered the photovoltaic effect in 1839, one of the most attractive solar panels facts shows that it took about 100 years to invent the first solar panel. Russell S. Ohl developed the first solar panel in 1940, and Bell Laboratories designed the first commercial solar panel in 1954.

    Conclusion

    Solar energy is one of the cleanest energy sources as it doesn’t produce any pollutants. It is a renewable energy source that requires low maintenance and is easy to install.

    We can see from these facts about solar energy that more and more people and governments have turned to solar energy as they feel they can contribute more to the environment.

    That said, if solar energy is harnessed as it should be, it can satisfy all future energy needs. Hopefully, these statistics will help you realize that solar power has a vital role in the fight against climate change.

    People Also Ask

    How common is solar energy?

    According to the latest statistics, solar is the most popular renewable energy source, and it has become the favorite type of electricity. On a global scale, renewable energy sources made up 24% of electricity generation back in 2014. The latest statistics also show that solar energy sources will only grow in the future. For example, solar generation made 11% of the total US renewable energy generation back in 2017. It is estimated that it will make 48% of US renewable energy by 2050, which makes it the fastest-growing electricity source.

    Is the solar industry growing?

    The solar industry is the fastest-growing renewable energy industry in the US. For instance, the solar energy market was valued at over $52 billion in 2018 and is expected to reach over $223 billion by 2026. We should also note that solar energy use has undergone massive growth since the early 2000s and has experienced a 49% growth rate every year. Moreover, more than one million US homes have solar panels and are being powered by solar energy.

    How much solar energy is used in the US?

    Solar energy makes 1.6% of the total US electricity generation. In 2019, electricity generation facilities all over the US generated 4,118 billion kWh of electricity, while 63% of the electricity was from fossil fuels, 20% from nuclear energy, and 18% from renewable energy sources. In addition, 3.4 acres of solar panels are required to generate one gigawatt of electricity over a year.

    Which state has the highest solar capacity?

    The United States is the world leader in generating renewable energy with over 67,885.000 GWh. Additionally, in the US, California is the leader in solar energy usage, with nearly 17% of its energy coming from 23 GW of newly installed solar capacity. In second place is North Carolina with 4,308 MW, in third Arizona with 3,400 MW, and in fourth is Nevada with 2,595 MW of installed solar capacity.

    What percent of the world’s energy comes from solar power?

    The U.S. Energy Information Administration (EIA) made a report in 2015 about solar power, estimating that approximately 12% of world energy consumption came from renewable sources such as geothermal, hydropower, biomass, solar, and wind. Facts suggest that world energy consumption from renewable sources will increase to 17% by 2040.
    That said, Asia is the leading continent regarding solar energy generation. Here are the top five countries that generate the most solar energy — the United States, China, Italy, Japan, and Germany.

    How many people use solar energy?

    The US has more than 1.3 million solar installations, with over 40 GW of generation capacity. The latest statistics show that 1 MW of electricity can power 164 homes, so 40 GW is enough capacity to power 6,560,000 American households.
    However, solar remains the third most important renewable energy source in terms of worldwide installed capacity. Hydro and wind lead the way as the essential renewable energy sources in 2020, with solar energy not that far behind.

    Which country uses the most solar energy?

    As Asia is the leading continent regarding solar energy, it comes as no surprise that China is the leading country with an immense solar capacity of 130 GW more than any other country. It still holds the record for the largest operational solar project conducted in 2018. One of the most exciting facts about solar power is that Los Angeles is the leader in installed solar PV capacity.

    What are three important facts about solar energy?

    Out of many amazing facts regarding solar energy, the following three are the most important ones. The first is that more and more people are installing solar panels to reduce electricity bills. Second, solar power is clean and does not contribute to climate change. The third and most important fact is that solar energy is the future. From these solar energy statistics, we can see that the solar community in the US became four times bigger in the last four years, which is proof of the statement mentioned above.

  • Is Siri Better Than Google? – 16 Interesting Siri Statistics

    Is Siri Better Than Google? – 16 Interesting Siri Statistics

    Siri was first released back in 2011 and has truly revolutionized the way people interact with content on the web. Siri statistics show that it is still very popular, and it is not hard to see why. This smart voice assistant recognizes voice queries and comes up with the best answers and solutions.

    Millions of people use these devices nowadays, and they have many options to choose from. Besides Siri, there is also Alexa, Google Now, Cortana, Bixby, and numerous others.

    However, it is still one of the most popular smart assistants out there. Is it because it was the first of its kind, or is it because it is still the best? Let’s find out.

    Siri Stats that Prove the Future Is Already Here (Editor’s Picks)

    • More than one billion devices feature voice assistant services
    • There are  500 million devices featuring Siri
    • About 45% of people keep their smart speakers in the bedroom
    • 25% of people buy household items using voice assistants
    • 98% of smartphone users have tried Siri
    • 62% of iPhone owners use the assistant in their cars
    • Siri uses an average of 63 kB per query
    • Only 6% of people use Samsung Bixby

    Siri Statistics to Consider

    1. Latest available data shows that Siri is used on 44% of smartphones in the U.S.A.

    (Voicebot)

    Based on the results of a survey that included 1040 U.S. citizens, 44% of smartphone users prefer Siri to any other virtual helper. Google Assistant is second with 30%. Amazon Alexa holds third place with 17%. Samsung and its Bixby assistant came fourth with just 4%.

    2. There are  500 million Siri voice assistant devices.

    (Voicebot)

    Apple casually shared the information that Siri was available on half a billion devices around the globe. This seemed to be a direct stab at one of the greatest Siri competitors; despite its global dominance in other areas Google Assistant has exactly the same result.

    3. 98% of smartphone users have tried Siri but most of them don’t use it.

    (9to5mac)

    Although Apple might boast that 98% of users have tried Siri, the truth is that a lot of people don’t really use it. The high percentage can be explained by the fact that models after the iPhone 4S come with pre-installed Siri and most users are willing to try it once or twice.

    What are voice assistants used for?

    Voice assistants are incredibly versatile so their actual usefulness depends on the user’s needs. In addition to providing answers to a range of questions, these assistants can make appointments, control home devices, play media files, and perform dozens of other tasks. Voice-controlled AI can be integrated into mobile apps (as it is the case with the Siri feature) or specially designed smart speakers.

    4. According to Siri user statistics, 62% of iPhone owners use the assistant in their cars.

    (Business Insider)

    Siri is the ultimate hands-free device so users can make calls, send out texts, or do research while driving. It’s safe and efficient, and can even assist you in combination with the GPS navigation system.

    5. 97% of iPhone users just don’t feel comfortable using voice search in public.

    (9to5mac)

    As useful as this technology can be, it is still far too overt in nature for many people. In fact, only 3% of iPhone users use technology like Siri online in public, instead opting to use it in the privacy of their homes or vehicles.

    6. Siri uses an average of 63 kB per query.

    (Ars Technica)

    One of the biggest complaints users had when Siri first came out was the fact that it seemed to use up a lot of data. Ars Technica decided to test this out and calculated that each query used an average of 63 kB. Considering it’s been nearly eleven years since the assistant was released, its data use is much less of an issue now.

    7. Siri voice search statistics show 90% of Siri users use it on their smartphones.

    (Statista)

    A 2021 survey conducted in the US showed that Siri was mostly used on mobile phones (90%). People who use it also like using it in their cars (16%) and via their earphones (8%).

    Apple’s Siri has been criticized for lacking innovation and having flawed speech recognition software, but that still didn’t affect its dominance on the market. This probably has to do with the fact that Siri was the first voice-enabled virtual assistant available and many people recognize the brand as the ultimate representation of the technology.

    8. Siri stats show that it lost 7.3 million users between 2016 and May 2017.

    (9to5mac)

    Despite its success on the market, the voice assistant still managed to lose 7.3 million monthly users in just a year. That number represented roughly 15% of its total U.S. user base.

    9. Only 6% of people use Samsung Bixby and around 5% use Microsoft Cortana.

    (Statista)

    Samsung seems to be losing the race with Bixby, which came to life in 2017. The fact that Bixby users have noted numerous functionality gaps, lack of data sync, and voice recognition problems isn’t helping. Microsoft’s Cortana is in a similar position, and the company itself acknowledges its failure to create a top-notch voice assistant.

    10. Statistics about Siri show that it makes up about a quarter of all Wolfram searches.

    (VentureBeat)

    Wolfram Alpha is Siri’s weapon of choice when it comes to unearthing scientific facts or solving mathematical problems. Unlike traditional search engines like Google, Wolfram doesn’t look for the answers on the internet. Instead it trawls through its own enormous but reliable database and computes the answer.

    11. Voice search statistics say that 25% of people say they most often buy household items using voice assistants.

    (SEJ)

    Second place on the list goes to buying apparel and entertainment, including movies and music, at 21.15%. In third place, 18.94% of users buy games with the voice assistant. Users are least likely to use voice search to find local services with only 3.52%.

    12. More than 45% of users keep their smart speakers in the bedroom. 

    (Voicebot.ai)

    This shows a shift in trends, as the living room was once the most popular place to put a smart speaker. It is now in second place, with 43.2%. The analysts suggest it is because smart speakers and voice search are becoming more important for our morning and evening routines.

    This smart home guide will show you how to make the most out of your smart speakers, as well as other smart devices.

    13. Today, more than one billion devices feature voice assistant services. 

    (Voicebot.ai)

    The most common way to interact with a voice assistant is via smartphones, then cars and, finally, smart speakers. The four biggest providers of voice assistants are Apple Siri, Google Assistant, Amazon Alexa, and Microsoft Cortana.

    14. Google Assistant read through 2865 romance novels to improve its linguistic abilities.

    (The Verge)

    Apparently, one of the best ways for AI technology to improve its communication skills is by reading a truckload of romance novels online. Google Assistant went through nearly 3000 raunchy novels to bring its conversation game to the next level.

    Siri Statistics: Key Takeaways

    This technology is taking over the world, and there is no doubt search by voice will take a leading role in the future. Why? Because in times when speed and convenience are the most important factors, the AI tech improves and smart assistants are offering faster and better results. The market is a battleground for IT giants with incredible resources at their disposal.

    Voice search statistics suggest younger generations will be more inclined towards this technology, starting with millennials, who are already quite interested in the concept.

    One of the main reasons why Siri is still one of the most popular virtual assistants out there is the fact that it has been on the market for so long. People recognize the brand and trust its reputation above all. For many users, Siri is the very definition of a smart assistant, and the Siri usage statistics prove it.

    However, some studies suggest users are dissatisfied with the lack of innovation and overall improvement of the software. If Apple wants to stay in the lead, the company will have to show its users that it – and more specifically Siri – is ready to listen.

    Overall, this technology is still fairly new and has a long way to go. That said, healthy competition in the industry is pushing voice assistants to improve rapidly.  Hopefully the major players won’t let us down.

    People Also Ask

    What percentage of searches are voice?

    58% of the US online adult population has used voice search at least once, while more than 33% of them use it at least once a month. Moreover, almost half of the voice search users (47.2%) expect to increase their voice search frequency. The numbers for smart speaker owners are even higher—about 89% of them use voice search regularly, and almost two-thirds of them intend to increase usage.

    Who is smarter, Google or Siri?

    A company called Loup Ventures tested all the major smart speakers by asking them to answer 800 questions. Google Assistant managed to get 87.9% of the answers correct, while Siri came in second with 74.6%. The two smart assistants function differently when it comes to sources. While Google goes through the information available online, Siri uses Wolfram to answer questions. It is software that computes the answer based on scientific, reliable databases.

    Is Alexa better than Siri?

    The two smart assistants are a bit different. Amazon Alexa uses Bing’s search engine for her search queries, while Siri relies on Wolfram, specialized software that goes through reliable scientific sources.
    Although it’s a small difference, Siri seems to be slightly smarter than Alexa based on research by Loup Ventures. Alexa answered 72.5% of the 800 questions it was asked. Siri statistics show that it managed to answer 74.6% of them correctly.

  • 20 Fascinating California Real Estate Statistics

    20 Fascinating California Real Estate Statistics

    California, known for its sunny and hot weather, is among the greatest real estate markets in the US. California real estate statistics show a growing demand for accommodation, particularly in the metropolitan areas of Los Angeles, San Francisco, and San Diego. Also, houses in California are among the costliest personal properties in the world. 

    Apart from the weather and breathtaking sceneries, California is in great demand due to its booming economy. Even the coronavirus pandemic couldn’t halt the house sales. After the decrease in the first half of 2020, the sales surged again in August. Several factors made Golden State’s real estate attractive again.

    Top California Home Sales Statistics and Facts (Editor’s Choice)

    • Property sales across the six-county Southern California region increased by 43.5% between May and June 2020
    • There are 13,044,266 houses and apartments in California
    • The average market rent is $2,333 per month
    • 43.7% of homes on the market were built between 1970 and 1999
    • 473,500 homes were sold in California in 2019
    • The median value of condos and single-family houses amounts to $635,055
    • The sale of million-dollar real estate increased by 18.1% in June 2020

    General California Real Estate Statistics

    2020 was excruciating for the Californian property market. Namely, it encountered the greatest decline after the Great Recession in 2008. Luckily, the real estate market managed to overcome the challenges in June with the biggest increase in month-to-month sales in the past 40 years. Plus, the average price of home units set another record.

    1. In California, 1,700 more houses were sold in 2020 than in 2019. 

    (First Tuesday Journal)

    The California housing market witnessed a meager 0.4% increase in home sales from 2019 to 2020, reaching 439,200 sold houses. The coronavirus pandemic has taken its toll on the economy both in the US and other countries worldwide.

    The unexpected recession forced many businesses to close, and a devastating number of employees ended up jobless. Real estate’s fate was no different. The economic volatility coupled with job losses resulted in a low sales volume. More precisely, 42% fewer homes were sold in 2020 than in 2005.

    2. 437,500 houses were sold in 2019. 

     (First Tuesday Journal)

    California home sale statistics show that 437,500 homes were sold in 2019 in the state of California. However, in comparison with the sales in 2018, these figures showed a 1% decrease. In other words, 4,400 fewer homes were sold in 2019 than in 2018. Compared to 2005 statistics, that’s a massive drop in sales volume. 

    3. 465,400 home units were sold in August 2020.

    (California Association of Realtors), (California Association of Realtors)

    According to real estate trends in California, home sales were on a rising trajectory between 2019 and 2020. More precisely, there was a 6.3% increase in sales from July 2019 and a 14.6% increase from August 2019, reaching 465,400 houses sold by August 2020. The median price of homes also went up by 6.1% between August 2019 and August 2020. However, the California real estate sales started dropping, reaching a record low in 2022. Namely, the year-to date-sales in July reached just 295,460, which is 31.1% less than the same month a year before.

    4. SoCal real estate market prices grew by 12.9% in August 2020.

    (Norada Real Estate Investments)

    Several months ago, the average price of a home unit in Southern California hit $640,000. That marked almost a 13% increase from August 2019. California real estate sales from July and August 2019 indicated a drop of 3.9% and 5.2%, respectively, for single-family homes in LA County. The average price grew by 7.9%, only to hit $677,260. Orange County experienced the greatest surge in sales—13.7% from the year before. The average price increased by 14.8% from 2019, reaching $930,000. 

    5. The median value of condos and single-family houses amounts to $635,055.

    (Zillow)

    Currently, single-family homes and condos are valued at a median of $635,055, marking a 10.9% increase in value during the past year. This price is adjusted according to seasons and involves only the middle price tier of houses. According to California housing market predictions, a 3% increase in home prices is expected. 

    6. The sale of million-dollar real estate increased by 18.1% in June 2020.

    (PR Newswire)

    Home units valued below $500,00 comprised 48% of overall sales in California as of May 2020. However, such homes made up only 44% of total sales in June 2020. Conversely, the sale of properties estimated at a million dollars rose by 18.1%, as opposed to 15.6% in May.

    7. The median home value in California is $574,957. 

    (Neighborhood Scout)

    The prices in California generally indicate a rising trajectory. Currently, the positive direction of the real estate market demonstrates that the average value of a home unit amounts to slightly over $570,000. In percentages and value, home prices go as follows:

    • Up to $59,223 — 2.8%
    • $59,224–$118,496 — 2.4%
    • $118,497–$237,000 — 7.6%
    • $237,001–$355,415 — 12% 
    • $355,416–$473,900 — 14.7%
    • $473,901–$592,258 — 14.2%
    • $592,259–$888,619 — 22.8%
    • $888,620–$1,184,775 — 10.8%
    • Over $1,184,775 — 12.7% 

    8. Property sales across the six-county Southern California region increased by 43.5% between May and June 2020. 

    (Los Angeles Times)

    According to home sales statistics, property sales in the six-county Southern California region increased by almost 44% from May to June 2020. It was the biggest increase in home sales in one month since 1988. 

    Still, the record sales were 15.2% down from the year before. In April and May, the Southern California home sales dropped by 31.5% and 45% year-over-year, respectively. 

    9. The median price of home units in California rose to $555,500 in June 2020.

    (Los Angeles Times)

    The real estate median price increased by 2.9% in Southern California. Home sale statistics reveal that such a price of estates in the six-county region amounted to more than half a million dollars in June 2020. But, bear in mind that not all properties were sold at that price. The median reflects the point at which 50% of houses were priced for more and 50% for less than that amount.

    10. The median price year-over-year in 45 counties in California increased by 10%. 

    (Manage Casa)

    As California real estate trends show, the median home price increased by 10% in 45 out of 51 counties tracked by the California Association of Realtors. However, the number of active listings dropped by 51.1% in March from the year before, marking a decline in listings of more than 50% for three months in a row. 

    11. July sales increased by 24.7% from the previous month. 

    (Pacific Sotheby’s International Realty)

    In July 2020, the California housing market graph in the past 50 years saw the strongest monthly gain. Namely, the growth of real estate sales by almost 25% that occurred that month was the highest since 2006. As for the National Association of Realtors, such a surge in sales reflects the seasonally adjusted annual rate of a massive 5.86 million. 

    12. The mortgage rate in California currently stands at around 3%. 

    (Interest)

    As California real estate data show, mortgage and refinance rates are below the national average. It currently stands at 3.02% for a 30-year fixed rate and 2.28% for a 15-year fixed rate. Even though houses in many areas across the state are very expensive, low interest rates will help buyers save money on mortgage expenses and potentially allow more people to buy properties. 

    13. The average market rent is $2,333 per month. 

    (Neighborhood Scout)

    California real estate statistics show an increase in rent prices as well. Currently, renters need to pay around $2,300 a month to rent a house. But, the homeownership rate reveals that there are more owners than renters—53.7% vs. 46.3%, respectively. Rental statistics show that the remaining 8% are vacant properties, resulting in a big imbalance between the supply and demand in the real estate market.

    When Will House Prices Drop in California?

    Without a doubt, 2020 was intriguing for the Californian housing market. The prices were rising, and there was a clear indication that it would be yet another successful year for real estate in California. Then the pandemic happened and threatened to harm the market. Luckily, it fought back and showed extraordinary resilience. Based on the current situation and projections, property price trends show they won’t drop anytime soon. 

    14. The home unit prices should rise by 3% by the end of April 2021 in Southern California. 

    (OCR)

    According to forecasts, a 1.3% drop in prices will occur in 41 US states. But that isn’t the case with the Los Angeles housing market forecast 2020-2021. Namely, Southern California is among those states that aren’t expecting the decline. Quite the contrary, the prices are bound to grow by 3% in LA County by April 2021. Orange County will see an increase of 5%, whereas the Inland Empire expects a rise of 6%.

    15. The Bay Area home sales prices increased by a whopping 128% in inflation-adjusted dollars between 1997 and 2018. 

    (Vital Signs)

    Throughout California median home price history recorded since 1997, the demand for houses in the Bay Area has been quite strong. Given the region’s thriving economy, limited supply of land and vacant real estate, and overall popularity, it’s not surprising that the Bay Area’s home prices are continuing to grow. 

    16. The average home price reached $706,900 in August 2020.

    (HBI) 

    As far as projections go, the California housing market crash is unlikely to happen soon. The decline in sales during the lockdown is now nearly forgotten, and the surge in the June-September period helped the market to rebound. In fact, a record-high average price of $706,900 was recorded in August 2020. That was a 14.5% increase from the same month in the previous year.

    17. There are 13,044,266 houses and apartments in California.

    (Neighborhood Scout) 

    Property stats show that there are more than 13 million homes and apartments in California. In terms of types, 57.7% are single-family homes, while 23.5% are apartment complexes. Small apartment buildings comprise 7.9% of the overall number, whereas townhomes make up 7%. 3.7% are mobile homes, whereas other types comprise 0.1%.

    18. 33.4% of homes have three bedrooms.

    (Neighborhood Scout)

    One-third or 33.4% of US homes have three bedrooms, 27.6% have two bedrooms, while 17% have four bedrooms. 13.5% of homes are with only one bedroom, whereas 4.3% are with five bedrooms. 4.2% have no bedrooms. The average price of building a three-bedroom house is $180,000 to $240,000, depending on the location, size, and style.

    19. The average home price in San Francisco Bay jumped by 18.7% in August 2020. 

    (Homebuying Institute)

    San Francisco Bay Area housing market predictions for 2020 were certainly about the price increase. However, the already expensive Bay Area witnessed the largest home price jump of almost 19% over the year. Besides, it stood out regarding the number of property sales, which, in turn, added to the price increase. 

    Other areas that saw an increase in prices include the Central Coast region (16.4%), Southern California (12.9% YOY), and the Central Valley region (12.2%).

    20. 43.5% of homes on the market in California were built between 1970 and 1999. 

    (Neighborhood Scout)

    California home sales data show that plenty of homes were built and sold between 1970 and 1999. Namely, 43.5% of homes were built during that period. The second most productive period was between 1940 and 1969 when 32.7% of houses were built. Only 9.1% of houses built in 1939 and prior are still standing, whereas 14.6% of houses were built after 2000. 

    The Bottom Line: The Overall Health of California Real Estate Market

    The first six months of 2020 were volatile for the real estate market in California. The year began solidly, with rising sales and profit. Then the coronavirus pandemic took place and threatened to crush the entire market. Economic volatility, job losses, and the global lockdown nearly stopped home sales and purchases.

    Somewhere around June, the housing market rekindled. According to California home sales statistics, there was a record in purchases and prices. Even the rent prices jumped considerably. The following months were even more productive for real estate agents, enabling them to make a hefty profit. Without a doubt, the most sought-after region was Southern California, with an increase in sales of over 40% in just a few months. In July only, the region documented an adjusted annual rate of over nearly 6 million, which hasn’t been seen in over half a century. 

    People Also Ask

    Is the housing market dropping in California?

    Presently, the housing market in California is going through an immense increase in sales and, therefore, in prices too. The figures have been skyrocketing ever since May or June, with the highest growth noticed in Southern California, specifically in the San Francisco Bay Area and LA County. The prices might drop by 1.3% by April 2021 in all areas except for SoCal. This region expects an increase in prices by 3%, 5%, and 6% in LA County, Orange County, and the Inland Empire, respectively.

    When will the housing market crash in California?

    Due to the temporary health and economic issues bothering America, the question of a market crash is relatively frequent and expected. But, based on the growth in sales, the Californian real estate market isn’t likely to crash soon. The five primary factors that will prevent such a situation include low mortgage rates, the disbalance between supply and demand, i.e., the lack of vacancies, the buyers’ demand, the overall market’s strength, and the ability to adapt.

    Is real estate a good investment in California?

    Regardless of somewhat higher prices, California has always been among stunning locations for real estate investments. The primary reason is its strong economy, maybe the strongest across the entire US. California provides an array of job opportunities that result in employment growth. In fact, the unemployment rate is at its lowest in the last 50 years. Job prospects are expected to attract more people to relocate to California. In turn, the growing economy is bound to result in higher housing demand in many fantastic Californian cities.

    Why is California real estate so expensive?

    The high demand for accommodation and the lack of home units affected the price range in the housing market. It’s the classic supply and demand factor—a rising number of people seek to live there, but there aren’t quite enough homes. Simply put, California hasn’t built enough houses. As for the estimations, the state should build 180,000 new home units every year to prevent prices from changing.

    What is the cheapest place to live in California?

    Southern California is undoubtedly among the priciest places to live in Golden State. Los Angeles, San Francisco, San Diego, and San Jose are among the most attractive cities. Even though it’s among the most expensive states, California still has affordable locations to offer.
    The five cheapest cities include:
    – Ventura, with an average household income of $66,485 and a median home price of $428,600
    – Camarillo, with a median household income of $87,120 and a median accommodation price of $456,500
    – Simi Valley, where a median income amounts to $89,595, whereas the home value is $438,700
    – Oxnard, in which a household earns $62,349 on average and need to pay $332,600 for an average home
    – Vacaville, as the cheapest, Vacaville sells an average home for $275,100, and its citizens earn $74,207 on average.

    Where is the best place to buy a house in California?

    Although Los Angeles, San Francisco, and San Jose are among the most attractive Californian cities, they aren’t listed as the best cities for buying a house, mainly because of the high prices.
    The most attractive place to buy a house is determined according to four factors: livability (including factors such as facilities, education, healthcare, and employment), average home unit price, value predictions (what you’ll get for your money), and buyer-seller index (a balance between buyers and sellers). According to California real estate statistics, Hawthorne, home to Tesla, SpaceX, and The Boring Company, is the best place to buy a house.

  • The Latest Fire Safety Statistics – Stay Safe in 2024

    The Latest Fire Safety Statistics – Stay Safe in 2024

    Did you know that most Americans aren’t familiar with even the most basic fire safety tips and are incapable of dealing with a potential fire in their home or workplace?

    In order to remedy this, we’ve created an extensive list of statistics, facts, and tips that will help people prevent fires—one of the most common household mishaps in the US. By engaging in fire prevention, you’ll be able to properly deal with a fire before it gets out of control and avoid injuries, property damage, or loss of life.

    With fire safety education being so neglected, not only in the US but across the world, even the most basic information can be helpful. Starting with prevention, we’ll move on to the devices that save lives once a fire breaks out, and finally, we’ll cover the fire statistics that will show you the importance of investing your time in learning more about this topic.

    Key Fire Safety Facts

    • In 2020, there were 3,500 civilian deaths due to a fire in the US
    • On average, 300 children under 14 die in house fires each year
    • 17% of fatal residential fires are caused by carelessness
    • Children start around 20,000 fires each year by playing with fire
    • 17% of home fire deaths occur due to a nonfunctional smoke alarm
    • 25% of smoke alarm failures with a deadly outcome occur due to a dead battery
    • US fire departments responded to 356,500 home fires in 2020
    • Around 7,500 structure fires in restaurants are reported every year

    Fire Prevention

    The most important part of educating the public on fire and safety should always be fire prevention. That’s why, first and foremost, we’re starting with a list of some basic prevention measures. By familiarizing yourself with the following, you’ll know what every household and workplace should adopt in order to be protected.

    Home Fire Prevention Tips

    No Smoking Indoors

    Smoking is a habit most people aren’t proud of. However, those who can’t seem to kick the habit should keep it outside of their home and workplace, or any other closed space, as it’s a major fire hazard. Numerous deaths and injuries are reported every year due to people lighting a cigarette near a gas source or falling asleep with one in their hands. So what is the top cause of a house fire? Smoking takes the second spot, being responsible for 14.2% of fatal residential building fires in 2016.

    Keep an Eye on the Food That’s Cooking

    According to 2019 statistics, cooking fires were responsible for 550 deaths that year. Those preparing food should never leave the stove unattended, especially when cooking in shallow pans with lots of oil. This is a commonly ignored rule of household fire prevention.

    Position the Heat Source the Right Way

    Making sure that your heat source is situated such that it won’t contact any potentially combustible materials is another major factor in fire prevention. Electric space heaters cause around a third of all winter house fires, and they are to blame in 80% of the house fires with a deadly outcome that occur during the winter, according to recent house fire statistics. Even more caution is needed when heating the space with gas-fired space heaters—they require additional safety measures, such as proper room ventilation.

    Properly Maintain Appliances and Electrical Wiring

    Having all your wiring checked by a professional is recommended for everyone moving to a new place, as faulty wiring easily starts a fire. It is estimated that around 9.6% of fatal building fires are a consequence of an electrical malfunction. Appliances, such as washers and dryers, also require proper professional maintenance, on a yearly basis at least.

    Workplace Fire Prevention Tips

    Supervise and Clean All Work Areas

    Adequate supervision is necessary in some workplaces, such as restaurants, in order to properly prevent a fire. Any potential mistakes that can lead to a fire need to be corrected quickly. Additionally, the workspace needs to be properly cleaned in order to prevent any combustible materials from accumulating.

    Avoid Blocking Access to Fire Equipment

    One of the bases of proper fire safety in the workplace is allowing unobstructed access to firefighting equipment, such as fire extinguishers, at all times. Piling things in front of these necessary safety features is a big no-no, and doing so should be avoided and watched out for at all costs.

    Maintain All Workplace Machinery Regularly

    This is another one of the important basic fire safety rules. To protect your workplace, regular and proper maintenance of all the machinery that’s constantly in use is absolutely mandatory. Not doing so risks the machinery malfunctioning and employees getting injured in numerous ways, even apart from fire. Electrical maintenance and its importance can’t be stressed enough, for both home and work settings.

    Provide Proper Fire Prevention Training

    Employees at most workplaces are required to go through some sort of fire prevention course or at least a training session. In fact, making this practice an annual requirement has been proven to effectively cut the risk of fire, as well as the number of fire-related deaths and injuries in the workplace, significantly. However, some companies don’t take this requirement seriously and just cruise through it. Make sure yours isn’t one of them.

    Devices and Systems That Deal with Fire

    What is a fire safety system? Why should everyone have one?

    In some cases, due to negligence or device malfunctions, no amount of preemptive measures can prevent a fire from breaking out. In these instances, two basic types of devices—which are also the two most common types of fire safety systems—are worth investing in. We’ve provided some statistics and basic information on them.

    Smoke Alarms

    The most basic of all fire safety methods, a smoke alarm is a must-have for every residential and commercial space. Even though most of us consider them useless and find their only purpose to be their unpleasant wailing when something on the stove starts smoking too much, they’re an invaluable tool in preventing fire-related injuries and death. Here are some smoke alarm statistics and home safety tips related to them:

    1. The risk of dying in a house fire is cut in half for those in homes with working smoke alarms.

    Being warned of a fire early significantly increases your survival chances. This is why smoke alarms are considered a necessity, especially considering how working smoke alarms decrease the risk of dying in a home fire by 50%.

    2. 40% of home fire deaths occur in a home with no smoke alarm.

    Home fire statistics show that 40% of all deaths that occur in a home fire happen when no smoke detector is present. How little we value our safety is best shown by the pricing of some smoke alarms, which go for as little as $9 on Amazon.

    3. 17% of home fire deaths occur due to a nonfunctional smoke alarm.

    In 17% of deaths that occur in home fires, a smoke alert system was present, but it wasn’t operational. Checking if your smoke detector works is a small task that needs to be repeated weekly, fire prevention agencies warn. Even the simplest devices have a Test button on the back that can be set for a weekly check-up.

    4. 25% of smoke alarm failures with a deadly outcome occur due to a dead battery.

    Estimates show that a quarter of all smoke alarm failures that happened in home fires with a deadly outcome had batteries to blame. Missing, disconnected, or dead batteries are the reason those buttons on the back exist. No matter how sensitive to bad cooking your alarm may be, never disconnect its batteries. This is the most basic of all home fire safety tips.

    5. Interconnected smoke alarms throughout the home further improve home safety.

    Having more than one smoke alarm increases your safety, especially for large houses. Interconnected alarms that sound simultaneously when they detect a fire are a godsend when it comes to fires that break out during the night.

    Fire Sprinklers

    Sprinklers are regarded as a fire safety method reserved for commercial buildings, but they can be a life-saving investment for your home, too. Here are some fire prevention and protection facts and statistics that will debunk all the misconceptions related to home fire sprinklers:

    6. Fire sprinklers reduce the risk of death in a home fire by 80%.

    With fire sprinklers installed in your home, the chances of a deadly fire are reduced by 80%. This makes them the most effective fire safety measure available.

    7. The risk of property loss is reduced by 70% in homes with sprinklers.

    Homes that have a fire sprinkler system in place are 70% less likely to see any fire-caused property loss than their neighbors without one, house fire statistics for 2018 and 2019 show.

    8. A fire sprinkler installation typically costs 1–2% of a home’s total construction cost.

    Having a home fire sprinkler system is not a massive luxury. According to recent prices, it typically costs 1–2% of a home’s total construction cost to have this valuable safety system in your home.

    9. Fire sprinklers activate on an individual basis.

    One of the common misconceptions about sprinklers is that they ruin the entire house/building once they’re activated. Fire education teaches us the opposite of what the movies show; only the sprinkler closest to the fire is activated, while the rest of the home/building remains safe and dry.

    10. Fire sprinklers release less water than fire hoses.

    When a sprinkler is activated, approximately 341 gallons of water is released. A typical intervention by firefighters uses 2,935 gallons of water. This stands to show that sprinklers cause much less water damage to the property, making it another statistic favoring their use.

    Fire Statistics

    Now that we’ve gone through the fire prevention basics and recommended the more important devices to have in your home and workplace, we’ve finally arrived at the part that’s meant to scare you into caring about the safety of family and coworkers. Fires are much more common and devastating than people realize.

    For those who think that a house fire is something that can’t and won’t happen to them, here are some statistics that show otherwise:

    How Many Fires Are There in the US?

    11. A fire department in the US responds to a fire every 24 seconds.

    Even though the National Fire Protection Association points out that the number of fires is significantly lower now than it was 50 years ago, fires are still a common ordeal. According to them, firefighters in the US respond to a fire every 24 seconds.

    12. US fire departments responded to 356,500 home fires in 2020

    Wondering how many homes catch fire per year? The number for 2020 is 356,500. The total number of fires on structures the same year was 490,500.

    13. On average, US fire departments respond to 37,910 industrial or manufacturing fires each year.

    71% of these fires occurred outside, and another 20% took place inside the structures. Only 9% involved vehicles.The manufacturing sector is most prone to fires, and 65% of all combined industry and manufacturing fires happen there.

    14. NFPA research shows that around 7,500 structure fires in restaurants are reported every year.

    Eating and drinking establishments are not exempt from fires. Workplace fire statistics show that almost 7,500 fires were reported each year in bars and restaurants across the US. Between 2017 and 2021, there were around 200 fires annually just in NYC.

    15. 3,230 fires in educational properties were reported each year, between 2014 and 2018.

    Each year, there are around 3,300 fires requiring the fire department to respond, occurring on a property owned by an educational establishment. This shows that teaching kids about fire safety should be a major point of their early education.

    Deaths and Injuries in Home Fires in the US

    16. There were 3,500 civilian deaths due to a fire reported in the US during 2020.

    In 2020, there were 3,500 fire-related deaths in the US. Compared to the same data from 2019, it is a 5.5% decrease in fires with a deadly outcome. Out of 3,500 deaths in 2020, 62 were on-duty firefighters. 

    17. There were 15,200 reported injuries caused by a fire in 2020.

    Statistics provided by the U.S. Fire Administration show that 1,700 of them were in vehicles, while the rest were in residential and non-residential structures.

    18. 17% of fatal residential fires are caused by carelessness.

    In addition to the majority of fatal home fires being caused by carelessness, 14% were caused by smoking. Around 10% of fires with fatalities are caused by electrical malfunctions and 9.8% are started intentionally.

    19. 7% of residential fires that result in injury are caused by cooking.

    The number of house fires per year that resulted in injury in recent years has remained similar. Additionally, an electrical malfunction was to blame for 6.8% of home fire injuries, while smoking caused 6.7% of them.

    20. Men are more likely to die or get injured in a house fire.

    Statistics show that residential fires have a gender bias. According to home fire death statistics, 60.3% of residential fire casualties are male. Men are also more likely to get injured in a fire, with a participation rate of 59.4% in all house fires.

    The US Fire Administration’s data tells us that the elderly have the highest fire death rates. 37.3 per million people of those 85 or older die from a home fire every year, according to fire deaths data from 2018.

    22. People aged 30–34 have the highest fire injury rate.

    When it comes to home fire injuries, those between the ages of 30 and 34 are statistically more likely to be hurt during a fire. Their fire injury rate is 59 per million people.

    23. On average, 300 children under 14 die in house fires each year.

    A report on child fire safety shows that, on average, 300 children aged 14 or younger die in house fires and around 1030 get injured each year.

    24. 140 firefighters lost their lives while on duty in 2020.

    In total, there were 140 on-duty firefighter deaths in 2020, and 78 of them were Covid-related. Out of 62 non-Covid deaths, 27 were volunteer firefighters, 23 were career firefighters, eight were contractors, two were federal employees and two were members of the military.

    25. 60,825 firefighters were injured in a fire during 2019.

    Even though this is an increase of four percent compared to the year before, it is still the third-lowest injury total since 1981. An estimated 23,825 injuries happened during fire fighting and around 14,150 injuries occurred during non-fire emergencies.

    Child Fire Safety Statistics

    26. Children start around 20,000 fires each year by playing with fire.

    This number exceeds the total of yearly residential fires in the UK—which you can learn more about further down the list.

    27. 43% of the children were under the age of 6.

    With 43% of the kids starting a home fire being in this age group, teaching fire safety for children as early as possible needs to become a priority. For comparison, those aged between 13 and 17 were responsible for just 9% of the home fires started by kids.

    28. Of the home fires started by children, 83% were started by boys.

    Once again, the numbers show that fires have a gender bias. It seems boys tend to be drawn to fire, as shown by the piece of fire safety statistics claiming that 83% of all home fires started by children are started by males.

    29. 80 deaths per year were caused by home fires that children started.

    In case you thought that your child playing with matches can’t do any harm, think again. An average of 80 deaths in home fires started by children were reported between 2007 and 2011. The numbers for more recent years are estimated to be similar.

    30. $235 million in property damage is caused every year by kids starting fires.

    Essentially a lack of kids fire safety causes approximately $235 million in property damage every year. Fire isn’t something you play with, and this needs to be ingrained in their curious minds from an early age.

    31. 52% of these fires were started with a lighter.

    Figures show that the majority of little pyromaniacs use a lighter as their means of starting a fire. Be sure to explain the potential consequences of playing with a lighter to them, or drive down to your local fire department—they’ll be more than glad to help educate your kids on the dangers of playing with fire. Once again, preventing house fires starts with an early education on the topic.

    32. 50% of these fires start in a bedroom.

    Once they get a hold of a lighter, their new favorite toy, children run straight into the bedroom to play with it. Typically, bedding, which is commonly made of combustible materials, catches fire first. Educate and keep an eye on your kids if you’re still wondering how to prevent house fires.

    33. 24% of child-initiated fires are started in July.

    Showing that our children aren’t complete maniacs is the fact that most fires started by them occur during July, mostly as a consequence of misusing fireworks around the July 4th celebrations.

    34. Only 26% of families have actually practiced a home fire escape plan with their child.

    Regardless of whether they’re the culprit, children need to know how to get out of a burning house. When it comes to fires and children, it’s estimated that just over a quarter of all families in the US have a fire escape plan that they’ve practiced with their children.

    35. Children are not being taught about wildfires.

    According to Save the Children, wildfires represent a huge threat to the children and adults in the parts of the country that are prone to them. Those living in these areas need to brush up on their knowledge and teach their kids, at the very least, the survival basics.

    Wildfires in the US

    36. There were 71,499 wildfires in 2017.

    During 2017, 71,499 wildfires were reported across the US. United States fire statistics related to California’s largest fires show that the second largest wildfire in the state’s history was started in 2017. The Thomas Fire started in December, and it took 281,893 acres of land, 1,063 structures, and two lives. According to the results of the investigation, the fire was started by improperly managed power lines.

    37. There were 58,083 wildfires in 2018.

    2018 saw far fewer wildfires than 2017. A total of 8.8 million acres of land were affected by the 58,083 wildfires started over the year. According to recent fire statistics, the largest fire in the history of California was started in July of 2018. The Mendocino Complex Fire burned through 459,123 acres of land and 280 structures. One life was lost in the fire. This fire is still under investigation.

    38. 50,477 wildfires have been reported in 2019.

    As of March 8, there have been 2,411 reported wildfires across the US. Once again, a significant year-over-year cut is noticeable, as the same period in 2018 had 7,828 wildfires. Fire safety measures that were introduced to national and state parks across the US appear to have had a significant positive effect, with just 49,976 acres burned, compared to 204,631 acres in the same period of last year.

    39. The Peshtigo Fire caused the most deaths in all US history.

    The Peshtigo Fire, which took place in 1871, took the largest number of lives in the history of the US. The fire started burning in Wisconsin. During the period, people had no clue about fire safety. By the time the last flames were extinguished, the fire had taken approximately 1.2 million acres of land. However, what makes this wildfire so devastating is the fact that it took somewhere between 1,500 and 2,500 lives.

    40. The Great Fire of 1910 shaped today’s wildfire prevention standards.

    The Great Fire of 1910 burned through Idaho and Montana and took around 3 million acres of land. It’s also the main reason there’s a fire safety guide for wildfire prevention in place today. After it subsided, the US Forest Service was fully shaped and cemented as a key agency in forest fire prevention and de-escalation.

    Even though they’ve made great efforts throughout the years to minimize wildfires by educating the population, this type of fire is still a threat.

    41. California is the most wildfire-prone state.

    When it comes to the number of households at high or extreme risk from wildfires, California takes the unfortunate first spot on the list, with over 2 million households belonging to this category. Fire department statistics by state add Texas, Colorado, Arizona, and Idaho as the top five most at-risk states.

    42. The Camp Fire caused the most deaths in California’s history.

    The Camp Fire, whose first flames started in November of 2018, was the most devastating fire in the history of California. 153,336 acres of land, 18,804 structures, and, most devastatingly, 85 lives were lost, Camp Fire statistics show.

    43. California had the most acres burned in 2018.

    During 2018, California appears to have been the state that was most affected by wildfires. The total land surface that was affected amounted to 1,823,153 acres in a total of 8,054 fires.

    Nevada was the second most affected state, with 1,001,966 acres of land burned in just 649 wildfires.

    44. Delaware and DC had no wildfire-burned land in 2018.

    This question of How many wildfires happen a year? has already been answered above, but for Delaware and the District of Columbia, the answer appears to be zero, and these two states share the title of the safest place in America from wildfires.

    In 2018, only 14 acres of land were burned in one of the 32 wildfires started in Oregon, making it the third safest.

    45. In 2017, wildfires caused a massive $20 billion in damages.

    Compared to just $2 billion lost due to wildfires in 2016, 2017 was a decimating year. Wildfire losses were tenfold, fire prevention organizations point out. According to the statistics, wildfires in California were responsible for the majority of this total, with the damages in the state being estimated at around $18 billion.

    How Many Home Fires Are There in the UK?

    In order to accommodate a wider audience and spread fire prevention awareness to the Old Continent, here are some statistics on home fires from the UK:

    46. 39,600 fires were reported last year in the UK.

    The UK has maintained a streak of less than 40,000 home fires per year for half a decade. Even though the number seems impressive, their house fire prevention education can still use some improvement.

    47. 88% of the reported fires were accidental.

    Experts estimate that the majority of fires that occur are preventable. This statement applies to any country in the world. According to data, 88% of the fires that were started in the UK last year were accidental, which probably means they were preventable.

    48. There was no smoke alarm in 31% of the home fires that resulted in a death.

    The British seem to be more fond of smoke alarms than Americans. One of the most basic fire safety rules for the home was skipped over by only 31% of the residences that caught fire and, sadly, led to a fatality in the UK.

    49. On average, the smoke alarm is not operational in 19% of the fires resulting in a death.

    However, the British are not paying as much attention as Americans do to the status of their smoke alarms. With 19% of deadly home fires in the UK happening in a house with a smoke alarm that wasn’t functional, they could take better care of their alarms and improve their national fire prevention figures.

    50. The use of smoke alarms in the UK rose to 88% back in 2011.

    Surveys conducted in 1988 showed that just 8% of UK residents had a smoke alarm in their home. In 2011, that number had, fortunately, significantly improved. With 88% of the population reporting that an operational smoke alarm was present in their home, several of the top causes of residential fires, such as cooking incidents, have been avoided.

    Workplace Fires in the UK

    51. 22,200 workplace fires were reported in 2015.

    The UK had a fairly large rate of workplace fires during 2014/2015. During this period, 22,200 fires in the workplace were reported. What’s the picture like nowadays?

    52. In 2017, the number of reported workplace fires went down to 15,815.

    The most recent data available, from 2016/2017, shows that the number of yearly workplace fires in the UK has dropped significantly. World fire statistics for 2018 show the same number: 15,815 total workplace fires for the United Kingdom.

    53. Most workplace fires in the UK occurred in retail distribution workplaces.

    With 3,000 workplace fires last year happening in retail distribution, this seems to be the least safe industry in the UK, at least when it comes to fire. 2,500 fires occurred in industrial premises, while 2,200 were started in restaurants, pubs, and bars. How do you keep safe from a fire? Possibly by avoiding employment in one of these industries.

    54. An alarm failed to sound in 3,700 workplace fires.

    An alarm malfunction was reported in almost a fifth of all workplace fires in the UK. We are, once again, reminded how important proper maintenance of fire safety devices and systems is.

    55. 17 deaths caused by a fire in the workplace were reported.

    17 fatalities in workplaces that were affected by a fire were reported last year in the UK. One out of three workplace fire deaths had smoking-based causes, such as lighters and cigarettes. With this kind of data in mind, the question, Why is fire safety important? is a bit redundant.

    Conclusion

    Out of all five basic elements that Ancient China considered the bases of the universe, fire might be the most frightening and dangerous to humans. We hope that this list and its statistics helped you gain a little more insight on the danger it can represent to us, our loved ones, and our environment. Maybe you’ve even realized that a smoke alarm is a wise investment.
    And if this list of fire safety tips hasn’t made an impact, there’s only one more that we can offer: stop, drop, and roll.