Author: Damjan Milenkovic

  • 30+ Alarming Cyber Attack Statistics & Numbers

    30+ Alarming Cyber Attack Statistics & Numbers

    One of the scariest cyber attack statistics is that almost half of a million pieces of malware are registered every day. The chances are that one of them has your name on it.

    So, what can we do to improve our safety?

    Knowing your enemy is a good starting point and these important statistics will help you do that.

    You will see how many attacks are caused by exploiting weak spots in your system and how many rely on tricking you with more old-fashioned tactics.

    Vital Cyber Attack Stats (Editor’s Choice)

    • There are around 6 billion internet users
    • On average, there are 26 smart devices per human being on Earth
    • 20% of users have done nothing to protect themselves from cybercrime
    • In the past 12 months, almost 330 million fell victim to cybercrime across 10 countries
    • For every cybercriminal that gets caught, 10,000 or more go free
    • 85% of all cyber-espionage attacks are state-affiliated
    • On average, there were two data breaches per day in healthcare in 2021
    • Small businesses represent 58% of all data breaches

    General Cyber Attack Statistics

    1. Hackers attack our devices every 39 seconds.

    (James Clark School of Engineering)

    A recent study by the A. James Clark School of Engineering at the University of Maryland informed us of this alarming data. This is one of the first attempts at quantifying the nearly constant rate of online attacks.

    2. On average, each computer is attacked 2,244 times a day.

    (James Clark School of Engineering)

    This amounts to more than 819,000 annually. Luckily, even with a large number of cyber attacks per year, most of them are unsuccessful. Michel Cukier, Clark School assistant professor of mechanical engineering and his two assistants came up with this figure. They learned that most attacks involved relatively unsophisticated “dictionary scripts,” or a brute force attempt at logging in with common usernames and passwords.

    3. There are around 6 billion internet users.

    (Cybersecurity Ventures)

    This is about 75% of the total world population. With an increasing number of vulnerable individuals, the number of attacks is likely to increase as well. What’s more, by 2030, the number of internet users is estimated to grow to over 7.5 billion. This will, no doubt, have a great impact on cyber crime statistics worldwide.

    4. In 2020, there were roughly 200 billion connected devices.

    (The Washington Times)

    That’s an average of 26 smart devices per human being on Earth. The more interconnected we are, the more vulnerable we become to attacks, perhaps in areas we haven’t even thought of yet. 

    5. At 36%, the United States ranked first in hosting botnet control servers.

    (McAfee)

    Botnet network is a group of devices owned by regular people utterly unaware that the hackers installed stealthy malware on their devices. They then control a specific part of the device and use it as they wish while keeping it under the owner’s radar. The cyber attack statistics by country show that more than a third of global botnet servers are in the US, which is significantly higher than Germany with 14%, and Russia and The Netherlands with 5% each.

    6. Only 18% of the cybersecurity laws brought forward in the US were passed, the 2019 report shows.

    (National Conference of State Legislatures)

    Despite severe losses due to cyber attacks, only 52 cybersecurity laws were enacted in 2018 out of 265 introduced. This lack of cybersecurity awareness will cause more trouble in the future, and it certainly helps keep the cybercrime business alive.

    7. According to the Russian government cyber attack statistics, the authorities stopped around 25 million cyber attacks during 2018’s FIFA World Cup.

    (Infosecurity)

    The Russian government apparently saw this coming, and it strengthened the country’s cybersecurity services before the World Cup. This confirms that being over-prepared sometimes works when countering potential threats.

    8. A data leak in the Oklahoma government exposed seven years’ worth of FBI investigations.

    (Forbes)

    These recent attacks are an excellent example of why every company and organization should invest more in protecting archived data. According to US government cyber attack statistics, the oldest stolen data in this breach originated from 1986, and the most recent had been modified in 2016.

    (Europol)

    Money muling refers to the transfer of illegally obtained funds between accounts on behalf of others. Most often, the stolen money often comes from phishing, where an attacker sends emails while masquerading as a legitimate business. The second most common source is e-commerce fraud, where a cybercriminal uses stolen online bank or credit card information.

    10. For every cybercriminal that gets caught, 10,000 or more go free.

    (CSO)

    One of the most disturbing facts about cyber attacks is that criminals rarely get caught. If they live in countries with weak or non-existent cybercrime laws like Algeria, cybercriminals can enjoy a passive income and know that they won’t be punished.

    Even if a criminal is somehow prosecuted in a court of law, for every person that’s caught, 100 get off scot-free or with a warning. The efforts to battle cybercrime must be global. As long as there is a safe haven for cybercriminals anywhere in the world, they will continue to operate.

    Cyber Attacks Statistics 2021

    11. 20% of users have done nothing to protect themselves from cybercrime.

    (Norton)

    Whether they’re not aware or they simply can’t be bothered, some percentage of internet users still do not take any steps to protect themselves from cybercrime. At the same time, about half of the internet users believe that it is very likely that a hacker attack on their computer (56%) or a smartphone (49%) is just a matter of time.

    In general, there is a feeling that people don’t take the facts about the rise in cyber attacks in past years too seriously. For instance, 31% of Americans admit that they’ve become addicted to being online and 63% of them use personal information for passwords.

    12. Over 12 months, almost 330 million fell victim to cybercrime across 10 countries. 

    (Norton)

    If you think you’re not at risk, Norton’s 2021 cyber attack research will make you think twice. In the United States alone, nearly 108 million adults were victims of cybercrime. However, the highest rate is 120 million individuals in India.

    13. 533 million Facebook users’ account information and personal data have been leaked in April 2021.

    (Business Insider)

    The stolen data was posted on one hacking forum, and corporate cyber attack statistics show that it included full names, emails, addresses, and other sensitive information of 533 million Facebook users. However, the company officials claim that the data is not new and that the data was scraped before 2019 when the new patch solved security issues that enabled hackers to get the info. 

    14. McAfee counted 668 threats/minute on average in 2021.

    (McAfee)

    McAfee’s statistics show that there is a 3% increase in attacks on its clients in the first quarter of 2021. The company’s cyber attack statistics in the US by industry show that the most significant increases are reported in technology (54%), education (46%), and finance/insurance sectors (41%).

    Some sectors were much safer, as they recorded a drop in cyber attacks. For instance, wholesale and retail had a 76% drop, while public administration recorded a 39% decline.

    15. Over 2.3 million new malware threats for Android were discovered during Q1 of 2021.

    (McAfee)

    As scary as that number seems, it’s dwarfed by the overall number of threats detected —over 100 million. Our devices are susceptible to so many threats. Some of them are computer viruses, Trojans, worms, logic bombs, spyware, crypto-mining malware. The scary part is that cyber attacks trends analysis show that there are millions more in development.

    16. 65% of cybersecurity professionals say that their company experienced spear phishing in 2021.

    (Cybersecurity Insiders)

    This kind of phishing method is a sort of high-effort cybercrime compared to malware or ransomware. The attacker needs to research their victim to fool them with a fake email that looks like the real deal.

    51% of cybersecurity pros say that, according to their statistics, attacks have increased in the last 12 months. The researchers’ statistics of big business and cyber attack correlation show that 39% of large companies now experience spear-phishing attempts on a weekly basis.

    17. Microsoft’s Azure reported a 25% increase in DDoS attacks in 2021.

    (Microsoft)

    The average daily number of attacks was 1392, which is a significant increase compared to 2020 results. These attacks are typically short, with 74% being under 30 minutes and 87% being one hour or less. The company’s statistics show that only 2% lasted more than 10 hours.

    These attacks are increasingly used as smokescreens for ransomware attacks, data theft, IP theft, and an overall desire to deplete a company’s resources.

    Business Cyber Security Facts 2020

    18. Small businesses represent around 58% of all data breaches.

    (Verizon), (CNBC)

    According to the latest data, small businesses are the number one mark for hackers. What’s disturbing is that their owners are surprisingly very confident about their ability to handle cyber attacks (59%), even though only 28% of them have plans of action in case they happen.

    The average loss per attack is around $188,000. One of the reasons for such small business cyber attack statistics is that the majority of these companies have minimal visibility into their employees’ password practices. It also doesn’t help that some of them can’t afford to have dedicated IT personnel.

    However, there’s always a solution that allows small businesses to invest in a dedicated password manager to safeguard the personnel’s data.

    19. 73% of internet security professionals believe that the number of attacks through emails is increasing.

    (Computer Weekly)

    Additionally, 80% of organizations have faced some form of this type of attack in the past year. The increase in attacks that target human beings as weak links instead of the devices they use is due to the strategy’s undeniable success.

    Cyber attack statistics by year show that just a small portion of malware is run via a hacker attack that exploits a technical flaw in a system. Social engineering is more resistant to anti-virus and anti-malware software. It is not dependent neither on a specific operating system or any other particular type of device.

    20. 85% of all cyber-espionage attacks are state-affiliated.

    (Verizon)

    The second place goes to nation-state cyber-espionage (8%). Other attacks come from organized crime (4%) and former employees (2%).

    Surprisingly, in this age of fierce competition in every sector, where you would expect companies to go above and beyond to find out their competitors’ secrets, market rivals are responsible for only 1% of espionage cyber attacks. That’s two times less than angry former employees.

    Cyber Attack Cost Statistics

    21. The annual revenue for stolen trade secrets and IP theft is $500 billion.

    (Bromium)

    This comes from two sources, namely, economic espionage revenue ($200 billion), and the cost of pirated music and films for the US ($300 billion). As we can see from the data breach that hit Sony, Netflix, and HBO, an attack can cost a company, not only their confidential data and future viewership but also their jobs and reputations.

    22. Energy utilities will spend $3.2 billion by 2026 for protecting their systems from cyber attacks.

    (Smart Energy),( Forbes)

    The first successful critical infrastructure cyber attack recorded in the statistics happened in Ukraine in 2015. This suspected state-sponsored attack on the electric grid left 230,000 people in the dark for hours on end. This only fueled fear in other countries.

    Digitalization and the internet of things have certainly increased the connectivity of the developed world’s infrastructure.

    23. Cybercrime could cost companies up to $5.2 trillion over the next three years.

    (Accenture)

    The companies’ hesitancy to put up defenses against cybercrime could cost them dearly. The economic cost is probably one of the most obtrusive results of having an insecure network with insecure smart devices.

    The financial network cyber attack statistics show that the companies are facing a $5.2 trillion projected loss due to cybercrime. This is 2.8% of revenue loss over the next three years. Industries relying heavily on technology face the most risk at over $753 billion.

    24. Only 38% of global organizations are adequately prepared to handle a sophisticated cyber attack.

    (Fraud Watch International), (Microsoft)

    Although 54% of organizations worldwide have experienced one or more significant cyber attacks in the past year, there is still a lower percentage of prepared organizations. A Frost & Sullivan study commissioned by Microsoft revealed in their cybercrime statistics that Asia Pacific companies can lose as much as $1.745 trillion to cybercrime.

    25. According to the cyber attack statistics, the annual revenue for hire-a-hacker services reached $1.6 billion.

    (Bromium)

    Additionally, the yearly revenue for DDoS attack/botnet for hire is $13 million, and malware-for-hire is around $11 million. Over the years, cybercrime has become a complex, regulated online criminal industry. One can now purchase several zombified computers and malware tools within seconds.

    You don’t even have to be actively engaged in cybercrime to make money on it now. Thanks to the IoT growth, criminal activities committed from one’s own bedroom can easily go unpunished, especially if the criminal is located in a country with little to no cybercrime-related laws.

    26. 82% believe that new cyber attacks will bring an increased risk of money and data theft.

    (World Economic Forum)

    Another 80% also expect an increase in operation disruptions, cyber attack stats show. Results like these can hardly be called surprising if you consider the ways connected devices are becoming more and more integrated into our everyday lives.

    As many as two-thirds of respondents believe the number of fake news and identity theft cases will increase in the coming years. These views show distrust among the public of their personal safety, not to mention their government’s honesty.

    Find out how to deter identity theft.

    27. The total number of coin miner malware files grew by 117% in Q1 of 2021.

    (McAfee)

    The coin mining malware is considered the only cyber attack that can damage your hardware as well as your software. This attack can tax CPUs, shorten a device’s lifespan, run down your batteries, and even cause physical damage.

    28. On average, there were two data breaches per day in healthcare in 2021.

    (HIPAA)

    In its 2021 journal, HIPAA reported that hackers attacked the healthcare system 706 times in the period from mid-2020 to mid-2021. One of the most worrying cyber attacks facts is that they have resulted in 44,369,781 individuals having their personal information exposed or compromised.

    29. The world is turning into an enormous cyberwarfare battlefield, with more than 500 documented geopolitical cyber attacks since 2009.

    (Global Times), (PrivacyAffairs)

    Out of 500 documented large-scale attacks, 79 originated from Russia, 79 from China, and 31 from Iran. The reports state that the US is responsible for just 12 national-level attacks. Still, the Chinese cyber attack statistics tell a different story. A security company has discovered more than 2700 advanced attacks against China in the past few years.

    30. More than 90% of the global airline industry was affected in a single 2021 data breach.

    (Guardian)

    The data breach statistics show that airline companies are one of the most endangered. One of the largest airline company data breaches in 2021 was when a sophisticated attack was conducted against SITA. This IT systems operator serves around 90% of the global aviation industry.

    According to the sources, hundreds of thousands of airline passengers around the world had their data exposed.

    However, the company claims that the data is limited to just names, membership, and tier status. When it comes to the company’s financial sector, the cyber attack statistics show that the hackers couldn’t get information such as credit card numbers, emails, passwords.

    31. On average, there are more than 450,000 new malicious programs registered every day.

    (AV-TEST)

    The AV-TEST Institute from Germany, one of the authorities on cybercrime, has registered around 1.26 billion malicious and potentially unwanted programs by September of 2021.

    Furthermore, the experts from the institute have also detected approximately 123 million new malicious programs in the first eight months of 2021.

    With such a high number of threats, it’s paramount that we all improve our safety. But, just knowing how many cyber attacks per day were there in 2020 and 2021 isn’t enough. We must improve our safety by taking the necessary precautions and getting specialized software and support.

    32. MacOS malware boomed in Q3 of 2020 by 420%, but it came down to normal levels in 2021.

    (McAfee) (Help Net Security)

    The 2021 data show a 70% drop in EvilQuest infections, the main contributor to the increase we saw in 2020. The malware statistics show that it was first spotted in June that year, and has infected many computers, encrypting data and requesting a ransom.

    Conclusion

    Cybercrime is on the rise and is becoming more targeted and sophisticated. This means that we should be more careful too.

    It’s a good idea to update your OS regularly, train your employees on the potential dangers of social engineering, and avoid downloading unfamiliar apps from unknown sources if you want to lower the risk of a cyber attack.

    People Also Ask

    What was the first cyber attack?

    The first-ever cybercrime happened In 1979 when a 16-year-old Kevin Mitnick hacked into Ark. it was the computer at the Digital Equipment Corporation. In 1986, German hacker Marcus Hess hacked ARPANET. Thought that he gained access to 400 military computers, some of them in the Pentagon. He intended to sell the data to the KGB.
    As a result, 1987 was the birth year of commercial antiviruses, when NOD Antivirus and McAfee were created. The first DDoS was recorded in 1988, and the first ransomware attack happened in 1989. The culprits were Robert Morris and Joseph Popp, respectively.

    How many cyber attacks happen per day?

    Research conducted by the A. James Clark School of Engineering at the University of Maryland showed that our computers are attacked 2244 times a day, once every 39 seconds. Luckily, the vast majority of them are unsuccessful.
    Most attacks involve relatively simple “dictionary scripts” or a brute force attempt at logging in with popular usernames and passwords. The trends, however, show that the attacks are becoming more sophisticated.

    How many cyber attacks happened in 2020?

    It’s impossible to count the overall number of cyberattacks in 2020 because every digital device is under attack every 39 seconds.
    However, the number of data breaches is one of the ways we can measure current safety conditions. There were 3,932 breaches in 2020, and the total number of records compromised exceeded 37 billion. As data breaches usually take months to be discovered, there is no doubt that the number will be even higher.

    How many cyber attacks occur each year?

    Sophos Security estimates that more than 30,000 company websites are hacked every day, which comes to roughly 11 million per year.
    If we consider that private users are not included in these statistics and that hackers need just one day to place 300,000 pieces of malware into circulation, we can assume that the total number of cyberattacks per year is much greater.

    What is the most dangerous cyber attack?

    The most dangerous (and most common at the same time) are phishing and malware attacks. They are followed by DDoS and brute force attacks.
    Keeping safe from these attacks is very important, as 60% of small companies go out of business within six months of a successful cyber-attack.
    The basic precautions are keeping your passwords hard to guess, changing them often, being careful with your correspondence, and having good antivirus software that covers different kinds of attacks.

    Where do cyber attacks come from?

    The most significant sources of cyberattacks are China and Russia – almost 35% of global attacks originate from these two countries. North Korea and Iran share 16% of global attacks, and the USA is in fifth place, with 3%. There were 108 documented global cyber attacks.
    Of course, we should keep in mind that, due to secrecy, the general public doesn’t hear about all of the attacks. Therefore, we can assume that the numbers are higher.

    Which country has the most cyber attacks?

    With 80% of internet users that have experienced cybercrime at least once, India takes first place on the list. It is followed by the United States with 61% and France with 60% of internet users. Japan and Germany are at the bottom of the list, with 42% and 47% respectively. To put things in perspective, the global average is 56%.
    The latest cyber attack statistics also show that the most common types of cybercrime internet users experienced are malicious software or unauthorized access to social media accounts and emails.

  • 20 Advantageous Property Price Trends for 2024

    20 Advantageous Property Price Trends for 2024

    Property price trends have changed massively lately, especially in the wake of a worldwide coronavirus outbreak.

    The pandemic, among everything else, brought some surprising changes to the real estate market. Until recently, to buy a house, you needed an excellent credit score and mortgage approval. Now, the market is overflowing with properties, banks are generously giving out loans, and all you need is to find the right house.

    To ease your search, we have gathered the vital property price trends and the most exciting experts’ predictions for 2022.

    For those of you more interested in house flipping or home improvement, keep reading to find out which practices yield the best results.

    Informative House Price Trends (Editor’s Picks)

    • The US real estate market gained $2.5 trillion in 2020
    • The average house price for the last quarter of 2020 was $346,800
    • 30% of home buyers paid above the initial asking price.
    • California accounts for over a fifth of the total US housing value
    • All houses in the New York metro area are worth over $3 trillion combined
    • Almost 6% of all sold houses in 2020 were flips
    • Move-in-ready home is the preferred choice for 80% of the buyers
    • Smart home upgrades will make 29% of people more inclined to buy the house

    General US Housing Market Trends

    Before we get to the more specific trends, we have to cover the basics. Let’s take a look into the US housing market value, sale predictions and prices, and more.

    1. The US housing market gained $2.5 trillion in value in 2020.

    (Zillow)

    Value gain in 2020 was the highest one recorded in the last decade and a half. Around $2.2 trillion was due to sales of existing homes, while $274 billion came from new constructions.

    2. Experts predict existing-home sales to reach 7 million in 2022.

    (Zillow)

    Housing market forecast 2022 predicts a 22% increase in sales. Thanks to the low mortgage rates and rising demand in the first half of the year, there’s a good chance 2022 will be a record-breaking year.

    3. The average price for a house in the last quarter of 2020 was $358,700.

    (FRED)

    For comparison, in the last quarter of 2019, the average house price in the US was $327,100, while in 2018 — $322,800. 

    4. 15% of home buyers had to pay above the asking price to get the house they wanted.

    (Statista)

    In 2019, 27% of the Millennial buyers and 31% of the elderly, aged between 74 and 94 years, paid more than the asking price to outbid for the house they wanted.

    5. Land prices increased by 4% in 2020.

    (NAR)

    Property price trends show higher demand for land properties since the beginning of the pandemic, especially for residential, industrial, and ranch land.

    6. Commercial property sales declined by 5% in the second quarter of 2020.

    (NAR)

    Trends show decreased sales and prices for most commercial properties — offices, retail centers, and malls.

    7. The median home prices more than doubled in the last 20 years.

    (DQYDJ)

    A house price graph of the last 20 years shows the median home price in January 2001 was around $140,200 in inflation-adjusted numbers — the actual one was $208,600. Fast forward to 2010, and home prices were slightly lower — the median value was $217,400.

    House Price Trends in the Different States

    We gathered the most exciting housing info on the average house price by state for everyone to take their real estate knowledge to the next level.

    8. Over a fifth of the US housing value is in California.

    (Zillow)

    Housing market trends by zip code show that the most expensive houses are in California. Not only that, but four of the ten most valuable metro areas are there, too — Los Angeles, San Jose, San Diego, and San Francisco.

    9. Houses in California are worth $7.8 trillion, all combined.

    (Zillow)

    The average house cost in California, the largest, and not necessarily the safest state in the US, is around $668,300.

    10. With $64 billion, North Dakota has the smallest share of the housing market.

    (Zillow)

    The housing value of Wyoming is around $70 billion, while South Dakota is worth $72 billion. The three states are the least-populous, which directly affects their share of the housing market.

    11. The housing stock in Alaska was the only one that went down in 2020.

    (Zillow)

    Alaska was the only state with no average home value increase per year and even lost value by 1.8% — about $1.5 billion. 

    12. The value of the housing stock in Idaho has increased by 149% in the last ten years.

    (Zillow)

    The real estate forecast for the next 5 years for Idaho expects the stock to continue rising, mainly in the Boise metro area, where it has tripled its value. Nevada, Utah, Arizona, Washington, and Colorado also showed a significant increase.

    13. Houses in the New York metro area are worth over $3 trillion in total.

    (Zillow)

    New York still has the highest housing value for a metro area in the US. Los Angeles comes in second with $2.8 trillion, followed by San Francisco with $1.7 trillion.

    Home Buying Trends — House Flipping

    Have you heard of house flipping? It’s a process of buying a property, redoing it, and selling it for a significant profit. It presents an opportunity for those who like renovating and are on the lookout for a new project.

    14. In 2020, almost 6% of sold houses were flips.

    (Million Acres)

    House flipping isn’t a new trend, and its popularity has remained stable in the last three years, housing price trends show.

    15. The average gross profit from flips in 2020 was around $66,300.

    (Million Acres)

    The first quarter of 2020 was one of the least profitable times to flip a house, with a total of $62,000 profit. Similarly, in 2019, housing price data shows that the gain was around $63,000, and in 2018 — $65,000. 

    16. With a gross ROI of 92.6%, Pennsylvania is the most profitable flipping market.

    (Million Acres)

    House flipping in Pennsylvania had the most return on investment, followed by Ohio and Connecticut.

    Home Appreciation Rates & Improvement Stats

    External factors are not the only thing boosting rates — certain internal improvement features can make the house more attractive for potential buyers. 

    The following stats reveal what is worth investing in and what can be skipped. 

    17. 80% of people prefer buying a move-in-ready home.

    (Coldwell Banker Real Estate LLC)

    A survey on property value trends showed that most people are unwilling to do extensive work on the house they are about to buy. 

    Additionally, 67% of the homebuyers are willing to sacrifice the size of the home to find a move-in-ready one within their budget.

    18. 29% of the people list ‘smart home technology’ as a primary reason when choosing a house.

    (Coldwell Banker Real Estate LLC)

    Smart home modifications are proving attractive to more and more people. While it’s a significant investment, it’s also a way of improving both your lifestyle and home value. 

    Other potential buyers’ attractions, according to home value trends, are granite countertops — 37%, and a designated home office space — 34%.

    19. 63% of people prefer buying a home with a master suite.

    (Coldwell Banker Real Estate LLC)

    A master bedroom with a private bathroom is a lovely, desired addition to a home. In that line of thought, 36% of potential buyers prefer to have double sinks in the master bathroom.

    20. 51% of potential buyers are more likely to buy a house with a fenced backyard.

    (Coldwell Banker Real Estate LLC)

    On average, homeowners spend around $1800 on fence installation, real estate price trends indicate. 

    Another feature you might want to consider is hardwood floors. In fact, 46% of the people claimed they are more likely to buy a house due to that characteristic. On the other hand, carpeting would be the preferred choice for 23% of the people.

    Final Thoughts on Property Price Trends

    We made sure to include everything you need to know and more about property prices. Hopefully, our stats on the housing market and home flips and improvements will help you make the right choice, regardless of whether you are selling or buying.

    Above all, when deciding on a house to purchase, make sure to look at the area prices, the recent changes in the market rates, and the amenities the property has. Consulting an agent or website can make the process of finding the best option in a much more straightforward manner.

    People Also Ask

    Where are housing prices headed?

    A rapid price rise was the expected trend due to low mortgage rates, higher demand, and lower supply. However, experts predict a slow drop in house prices by the end of the year.

    Should I buy a home in 2022?

    While mortgage rates are hitting a record low, house prices are on the rise, and the demand is higher. The answer depends on where you are looking to buy, your savings, and your income. Experts confirm that now is a great time to make an offer.

    How much does it cost to build a 1000 sq ft home?

    It usually costs between $100,000 and $200,000 to build a 1000 sq ft. If you add another 500 sq ft, the cost will be between $150,000 and $300,000.

    Is there a housing crash coming?

    Experts believe that a housing crash isn’t probable at this moment. Rising prices are not the only indicator of a housing crash, as there are over ten warning signs to watch for.

    What is the best month to buy a house?

    Generally, November is the time to get the best value for your money. On the other hand, spring brings more houses to the market. So, in April, you are likely to have more options to choose from.

    Is it better to rent or own a home?

    That depends on your preferences, as well as where you are from. Most people believe that owning a house is a much better option than renting. However, considering the sale prices and the price-to-rent ratio, currently, it appears better to rent.

    What is the cheapest type of house to build?

    If you want a cheaper house, you will need to build something smaller with more affordable materials. Property price trends show that one-story houses, shipping container houses, and especially ranches are excellent money-saving options.
    Moreover, you could choose cheaper materials like reclaimed wood, concrete sheets, and used brick. Plywood, bamboo, and corrugated metal are also functional, affordable options.

  • 40+ Horrific & Chilling Kidnapping Statistics [2024]

    40+ Horrific & Chilling Kidnapping Statistics [2024]

    Parents’ worst nightmare is their child not coming back from school. Unfortunately, kidnapping statistics show that this nightmare turned into reality for many families, as they suffered such a worse-than-death fate not to see their beloved kid ever again.

    The sole thought of the possibility of their child being abducted keeps most parents up at night. Every time your child is late from school, doesn’t answer the phone, or a stranger looks at them funny, your heart skips a beat. After all, how easy would it be to snatch a child away from the safety of their parents?

    And it’s not just children either. Young women looking for work opportunities, disgruntled teenagers, or men who owe money to the wrong people have fallen victim to kidnappers.

    Top Kidnapping Stats and Facts (Editor’s Pick)

    • More than 340,000 kids went missing in 2020.
    • Around 5,000 children are kidnapped every year.
    • In 2020, only 0.11% of missing children cases were the result of stranger abductions. 
    • 12+ years old children are the kidnapping victims in around 80% of all cases that include minors
    • Girls from 12 to 17 years of age are the most typical victims of abduction
    • Human trafficking is a $150 billion-worth industry
    • 99% of sex trafficking victims are females
    • Human trafficking wasn’t a federal crime in the US until 2000
    • Every year, 600,000 people go missing in the US
    • 43% of global kidnappings for ransom occurred in Asia

    General Abduction Statistics

    Kidnapping is undoubtedly among the most atrocious crimes. It means seizing a person and keeping them in captivity. Abduction is an issue that impacts all countries globally, regardless of their level of development.

    The stats and facts on kidnapping are disheartening. Has it ever occurred to you that abducted people in the great majority of cases end up killed shortly after the abduction? Did you know that unemployment, poverty, and bad political status may trigger offenders to commit such a horrible crime? However, with government participation, such offenses could be diminished. 

    1. 600,000 people go missing every year in the US. 

    (National Missing and Unidentified Persons System)

    According to the NamUs missing persons statistics, hundreds of thousands of minors and adults go missing each year. In most cases, the disappearances are not attributed to kidnapping, and a person is found alive and well.

    However, tens of thousands never come back, and the authorities are often unable to determine what happened. Especially for elderly people, and that’s why it’s advisable to arm your elders with the best GPS tracking products for seniors.

    Kidnappings are most commonly motivated by money. However, in other cases, kidnapers are inspired by politics, religion, custody disputes, human trafficking, or even premeditated murder.   

    2. 4,400 unidentified bodies are found each year in the US. 

    (National Missing and Unidentified Persons System)

    According to the National Institute of Justice, around 1,000 of those bodies remain unidentified after one year. Statistics on kidnapping and missing persons show that there’s a whole host of bodies that remain anonymous for an extended period.

    In such cases, time is a bitter enemy. The longer a body remains unidentified, the more difficult it is to recover any actual information about the person’s identity.   

    3. 543,018 people went missing in 2020. More than 340,000 were kids. 

    (FBI)

    Annual child abduction statistics show that kids are the most frequent target for kidnappers. While most of the children who went missing in 2020 were later found alive and well, the numbers show an alarming fact — kidnappers tend to go after those who are most vulnerable. 

    4. Human trafficking wasn’t a federal crime in the US until 2000.

    (Business Insider)

    Only when the Victims of Trafficking and Violence Protection Act of 2000 was signed into law by then-President Bill Clinton did human trafficking become a federal crime. Afterward, Bush, Obama, and Trump administrations have reauthorized the law.

    Stats on kidnapping remind that, in addition to US citizens, this law also protects undocumented immigrants who are victims of severe forms of trafficking.

    However, anyone seeking protection under this law is required to become a part of the prosecution against the trafficker.

    This further implies they have to cooperate with law enforcement agencies or even testify at court. But in most kidnapping cases, victims are often too frightened to take action against perpetrators. 

    5. Afghanistan, Algeria, and Burma were the three worst countries for human trafficking in 2020. 

    (US Department of State)

    Human trafficking, frequently referred to as modern slavery, is a profitable industry in Afghanistan, Algeria, and Burma. Statistics about kidnapping show that the US is still a hub for human trafficking.

    The National Center for Missing and Exploited Children reported a whoping 98.66% increase in online enticement cases in the first nine months of 2020 compared to the same period the year before—1.6 million in total.

    Having knowledge of the most dangerous cities in the US may aid in decreasing these crime rates, as locations play a huge role when it comes to kidnapping.

    6. According to estimates, between 18,000 and 20,000 victims are trafficked into the US every single year.

    (Business Insider)

    The United States kidnapping statistics aren’t clear on how many people are trafficked into the country every year — the number is impossible to determine.

    A lot of cases go unreported, and a lot of victims fall through the cracks. It doesn’t help that many victims are undocumented immigrants, which means government agencies simply have no record of them.

    Trafficking is covert and organized. Obtaining any kind of data about this illicit activity is difficult and requires a lot of resources.

    7. Human trafficking is a $150 billion industry worldwide. 

    (Polaris)

    Exploiting people is a very profitable business. FBI statistics disclose that, out of those $150 billion, it is estimated that $99 billion is earned from sexual exploitation.

    While prostitution is often called a victimless crime, a lot of the time, this simply isn’t the case.

    Victims of human trafficking, including underage girls and boys, are often forced to work in brothels, massage parlors, escort services, and pornography through manipulation, debt bondage, or other coercion types.

    All this happens within US borders. Rather than worrying only about Mexican kidnapping statistics and human trafficking in Colombia, Americans need to be aware of human trafficking victims at home. The great majority of such victims in the US are American citizens who legally reside in the country. 

    If they want to fight the human trafficking business successfully, authorities need to grasp how traffickers employ legal services and channels for their misdeeds. The private sector was among the first to start fighting against this hideous crime.

    Child Kidnapping Statistics

    Kidnapping definition

    Kidnapping means taking someone against their will and holding them captive, usually for purposes of ransom.
    Kidnapping is also frequently done by family members. Child kidnapping stats show that non-custodial parents and relatives often take children, especially in households where two parents are divorced, estranged, or separated. Missing kids are usually found and brought back home safely.

    Child abduction might be classified into three categories according to the perpetrator’s identity: family, acquaintance, and stranger kidnapping. Family abductions are carried out by parents. 

    Acquaintance abduction is done mainly by juvenile offenders, and victims are typically women and teenagers.

    The last, stranger kidnapping is carried out outdoors and is linked with sexual assaults or robberies. What do you think is the most frequent?

    8. Over 460,000 children go missing each year. Around 5,000 of those children are kidnapped. 

    (FBI) 

    For kidnappers, kids are the easiest target. They are susceptible and defenseless. Most can be lured away by the mere promise of candy or a toy.

    The FBI missing persons page shows many faces of small children who are missing and presumed kidnapped. 

    This is why it’s so important for your child to be familiar with the “stranger danger” phase. If children are made aware of the potential dangers that surround them, they are more likely to call for help, run away, or simply refuse to comply with a request.

    Another good thing to do is equip your child with a GPS tracker for kids in case, god forbid, your kid goes missing for longer.

    9. In 2020, only 0.11% of missing children cases were the result of stranger abductions. 

    (FBI) 

    In 2020, this represented about 276 cases. Movies and television might be to blame for instilling the notion that all kidnappings are perpetrated by men in dusty coats and with deranged looks in their eyes.

    However, missing children statistics show us that reality is quite different. Few abductions are done by non-family members, which still doesn’t necessarily mean that complete strangers perpetrate them.

    Kidnappers tend to target children they’ve met before, and they observe them before making a move.

    10. In 2020, 1% of missing children cases were the result of family abductions. 

    (FBI)

    In 2020, there were about 2,593 cases of family abductions. Once again, it’s not the movie villain strangers we have to worry about. In practice, most child kidnapping cases are linked to family members.

    Children from low-income households and children with divorced, estranged, or separated parents are at greater risk of being kidnapped.

    The police are sometimes slow to respond because such kidnappings are reported as family disputes. That’s why the best security cameras can help provide ample proof about these types of wrongdoings.

    However, simply because a parent or a relative took the child doesn’t mean that they’re safe. Abusive ex-spouses, drug-addicted parents, or resentful family members can end up putting the child in great danger.

    11. Kids aged 12 and above are kidnapping victims in around 80% of all cases involving minors.

    (Patch)

    Teens are the most common victims of kidnapping, according to child abduction statistics. In most cases, police officials take into account teen behavior before considering abduction. To be fair, this is usually the reason teenagers disappear.

    Running away from home or staying over at a friend’s house without letting their parents know are common reasons behind brief disappearances. If a child under 12 goes missing, the police usually react quicker.

    12. Girls aged 12–17 are the most common victims of abduction. 

    (Patch)

    One of the more recent cases involves 13-year-old Jayme Closs. In October 2018, Jake Thomas Patterson abducted Jayme from her home in Wisconsin after killing her parents. She escaped after 88 days, but countless more girls never escaped their kidnappers.

    Teenage abduction statistics reveal that young girls are the most common victims, whereas the most typical perpetrators are middle-aged men, usually without a job.

    Which leads us to believe that it might be a good option to consider buying pepper spray and teaching your daughter how to use it to avoid these types of scenarios.

    13. In 2011, this was the stereotypical profile of a perpetrator in stranger abductions: male, aged 18–35, unemployed, drug or alcohol problems. 

    (US Department of Justice) 

    To discover what a typical perpetrator looks like, we should pay attention to child abductions by strangers statistics.

    About 70% of the kidnappers are unemployed, while about 50% are fudging with drugs or alcohol.

    The great majority of them are male, aged between 18 and 35. The race wasn’t a crucial factor here as all perpetrators were generally white or black in equal proportions. 

    14. In 2011, three out of five victims of stranger kidnappings were sexually assaulted, abused, or exploited.

    (US Department of Justice)

    While child kidnapping statistics show us that a lot of stereotypical kidnappings end up hurting the victim, most perpetrators are not violent at first contact. About 70% of victims are lured in through deception or non-threatening pretexts.

    The worst thing that could happen is if this type of crime occurs within the victims home. Acquiring the best door locks can aid in securing a home so that no unauthorized individual can enter.

    15. In 1997, only 57% of children abducted by strangers made it home alive. In 2011, it was 92%. 

    (US Department of Justice)

    Police methods have come a very long way since 1997. While stranger kidnapping statistics are always grim, significant progress has been made to find children and return them home safely.

    Still, nearly 20% of non-family kidnapping victims reported to the National Center for Missing and Exploited Children are found dead. 

    But as law enforcement agencies are advancing in locating abduction victims, only 1 out of 10,000 missing kids isn’t found alive. In addition to a more detailed missing children list, the police are now quicker to respond to threats and have learned how to deal with kidnappers.

    The fact that cellphone usage is so widespread and the availability of useful tools such as GPS tracking devices makes it a lot easier to keep children safe.

    16. 60% of child sex trafficking victims have a history with social services or foster care.

     (National Foster Youth Institute)

    Without a good family to keep them safe, many children in foster care end up being victims of sex trafficking. As human trafficking statistics suggest, traffickers tend to send one girl into a foster home to lure other girls into leaving it. The girls are then taken away and trafficked into prostitution. 

    17. Nearly 90% of missing children cases do not involve abductions. The children are either lost, ran away, or failed to contact their parents.

    (Polly Klaas Foundation)

    We’re not here to raise panic. While the stats are scary, not all missing children cases involve abductions. Missing kids are found eventually, and the reasons for their absence were relatively harmless.

    The majority of children were lost, decided to run away from home, or simply forgot to let their family know where they were going.  

    18. About half of the children who are abducted by strangers manage to get back home safely.

    (Polly Klaas Foundation)

    Stranger abductions are the things you hear about on TV. Missing children’s pictures are slapped across every screen and milk carton, and these scary cases are every parent’s worst nightmare.

    However, as the stats showed before, most children who go missing haven’t been kidnapped. A non-custodial parent or relative usually takes those who have been abducted. There are very few cases of stranger abductions, but only about half of children who are abducted by a stranger return home safe. 

    19. As of September 2019, 967 children have been rescued thanks to AMBER Alert. 

    (US Department of Justice)

    According to state kidnapping statistics, the AMBER Alert remains one of the most helpful tools in locating lost or abducted children.

    AMBER stands for America’s Missing: Broadcast Emergency Response and was named after Amber Hagerman, a 9-year old girl who disappeared in Arlington, Texas, in 1996. Amber disappeared on October 1 while she was riding her bike and was found dead in a creek four days later with laceration wounds on her neck. 

    Adult and Child Kidnapping Statistics Worldwide

    Unfortunately, not all countries are equally safe. As opposed to Western and developed countries, the majority of Asian, African, and Latin American countries have an immensely high abduction rate. If you’re visiting those places as a tourist, it’s highly advisable to stay away from risky and notorious locations for kidnapping.

    20. There were 18,363 kidnappings in Pakistan in 2017.

    (Knoema) (United Nations Office on Drugs and Crime)

    In 2017, Pakistan topped the list of countries with the highest number of kidnappings. There, kidnapping victims are sometimes blamed more than perpetrators. The following example proves that kidnapping statistics in the world are just as grim as those in the US.

    Namely, in December 2019, a woman called Dua Mangi was abducted from an affluent neighborhood in Karachi, and her disappearance caused a storm on social media.

    But rather than condemning the kidnappers, the BBC reported that a lot of the comments were more focused on Mangi’s outfit. Apparently, a sleeveless top is reason enough for someone to get kidnapped justifiably. Fortunately, the young woman soon returned home.

    21. There were 5,455 kidnappings in South Africa in 2017. 

    (Knoema, United Nations Office on Drugs and Crime)

    South Africa took second place with 5,455 kidnappings. In 2019, the kidnappings seemed to be on the rise as eNCA reported that their number had increased by 139% in the last decade. 

    22. There were 4,625 kidnappings in Germany in 2017. 

    (Knoema, United Nations Office on Drugs and Crime)

    Germany’s kidnapping statistics spiked in the last few years. In 2017, the country ranked third concerning the number of kidnappings worldwide.

    Ever since the migrant crisis, Germany has fought with rising abduction rates because immigrants are easy targets for kidnappers and human traffickers.

    23. In 2017, 43% of all global kidnappings for ransom happened in Asia. 

    (NYA International)

    Asia has struggled with high kidnapping rates for many years. In 2017, nearly half of the global kidnappings for ransom took place on this continent.

    Aside from Pakistan, Afghanistan’s kidnapping statistics also show that this country was another hotspot for this criminal industry, particularly if we consider the country’s development level and the general status of women in it. 

    India also had many incidents, with the local female population being the most common target of abductions.

    The Philippines are another problem area with very high abduction rates. The Philippines’ kidnapping statistics show that the country continues to be plagued by a considerable number of abductions. Due to poor development and bad economic status, most Asian countries have a rather high kidnapping rate.

    24. Over 6,235 kidnappings for ransom have been reported in Mexico between 2012 and 2017. 

    (NYA International)

    Mexico’s kidnapping statistics show that abductions continue to be a prevailing concern in the country.

    Thousands of Mexicans are kidnapped each year, and kidnappings for ransom are on the rise. It has become a very profitable business and one that dominates organized crime activities in this country.

    According to Mexican drug cartel kidnapping statistics, cartels often carry abductions because criminal organizations such as these have the necessary means to pull this off frequently.

    Throughout the nineties, criminal groups were focused on high-profile victims. But the publicity and the level of police involvement meant that the risks outweigh the rewards.

    In the last decade, the groups have focused on low and middle-class citizens as an easier way of obtaining money.

    25. Columbia’s kidnapping for ransom rate decreased by 94% between 2000 and 2017.

    (NYA International)

    Columbia’s kidnapping statistics are positive. The country that has always been a kidnapping hotspot has reduced its kidnappings by a whopping 94%.

    Guerillas used kidnapping as a way to finance their war effort and exert pressure on the government.

    Since the beginning of peace negotiations between the FARC guerillas and Bogota’s government, the number of incidents has decreased gradually. Thus, Latin America’s kidnapping statistics also show slight progress in other parts of the region.

    26. In 2017, Nigeria had the highest number of kidnappings for ransom in Africa. 

    (NYA International)

    General poverty, corruption, and increased organized crime make Nigeria a very dangerous place for both locals and foreign nationals. Besides, Boko Haram, the paramilitary organization in several African countries, makes the whole bad situation even worse.

    Therefore, kidnapping in Nigeria statistics shows that the country still struggles to keep abduction for ransom under control. 

    27. In Australia, around 20,000 children go missing each year.

    (International Centre for Missing & Exploited Children)

    Abduction has become such a widespread crime that even developed countries aren’t safe anymore.

    Though it’s somewhat isolated, Australia also fudges with the grievous issue. While the figures on how many of the cases were abductions aren’t clear, kidnapping statistics about Australia reveal a moderately high number of missing persons for the population of that size.

    At the beginning of the 20th century, Australia also had a high incidence rate of kidnapped mixed-race children of Aboriginal women and white men.

    Most of them were taken from their families by Australia’s federal and state governments to assimilate them into the white society. 

    28. In Canada, around 45,288 children go missing each year. 

    (International Centre for Missing & Exploited Children)

    Kidnapping statistics about Canada show that there is a high rate of missing children in this country. In 2018, 8,185 girls and 10,868 boys went missing without a trace, and the authorities aren’t sure what happened to them. 

    29. In the UK, around 112,853 children go missing each year.

    (International Centre for Missing & Exploited Children) (Statista)

    This is a very high number of missing persons. Kidnapping statistics about the UK show that the last few years have seen a significant increase in child abductions, with 1,268 cases recorded in 2018/19.

    Finding precise abduction stats about the UK is difficult because of the country’s policies about crime. For example, child abduction is not categorized under kidnapping but the “violence against the person” section.  

    30. In China, around 70,000 children are kidnapped every year.

    (Foreign Policy)

    China’s kidnapping statistics show an exceptionally high number of abductions. Although data shows that the number goes up to 70,000, the Chinese government reports that the average is only 10,000 cases per year.

    Political kidnappings have a history that dates back to the Xia Dynasty (2070 BCE–1600 BCE), but modern problems are centered around newborns and small children. Some children are sold into adoption overseas because adoption agencies in China receive sizable donations from parents. Sometimes these donations go up to $5,000.

    31. In 2015, Mexico, Haiti, Brazil, the Philippines, India, Columbia, and Venezuela were seven countries where you were most likely to get kidnapped. 

    (Thrillist)

    According to world kidnapping stats, these seven countries have the highest risk of abduction. Haiti kidnapping statistics are much lower than they were in the mid 2000s, but tourists still get kidnapped fairly often, as the country still faces problems with organized crime and abductions for ransom.

    In India, child abductions are a huge problem, and in Venezuela, middle-class and upper-class citizens and foreign nationals get snatched frequently.

    Venezuela is considered one of the most dangerous countries in Latin America. Meanwhile, kidnapping in Brazil statistics shows that wealthy businessmen and their family members are the most commonly targeted groups. 

    Human Trafficking Stats and Facts

    Human trafficking definition

    Human trafficking means trading a person away for commercial gain or exploitation. Human trafficking often starts with a kidnapping, and targets are mostly young women and girls. The most common form of human trafficking is sex trafficking.

    32. There are 40.3 million victims of human trafficking around the world, according to the International Labor Organization. 

    (International Labour Organization)

    Out of those 40.3 million, 24.9 million are trapped in forced labor, and 15.4 million are forced into marriage. Human trafficking is a global problem. It happens in Uganda, Mexico, Russia, Japan, Canada, and most certainly happens in the US. 

    33. Globally, 25% of human trafficking victims are children. 

    (International Labour Organization)

    Out of all people getting kidnapped, 25% of them are children. Children are easier to traffic than adults because they are more susceptible to manipulation and brainwashing. Children from foster families are at greater risk of being stolen and trafficked. 

    34. Globally, 75% of human trafficking victims are women and girls. 

    (International Labour Organization) 

    Women are disproportionately more affected by human trafficking than men. Most of the victims are young women or little girls from poorer countries. 

    35. 99% of sex trafficking victims around the world are female. 

    (International Labour Organization)

    International female abduction statistics show that the vast majority of sex trafficking victims are women and girls. In the sectors that don’t involve sex work, 58% of victims are also female.

    However, this doesn’t mean that men are unaffected. There is also very little data on trans and intersex victims.

    For these reasons, law enforcement agents advise the use of the best stun guns and TASERS for personal protection.

    36. Among the 23,500 runaway children reported to the National Center for Missing & Exploited Children in 2018, one out of seven was probably a sex trafficking victim.

    (National Center for Missing and Exploited Children)

    Runaways that don’t get found quickly are at enormous risk of falling victim to sex traffickers. According to FBI kidnapping statistics, the majority of prostituted women have been runaways. Some experts believe that most adolescents who run away are likely to be approached and forced to participate in prostitution or another form of commercial sexual exploitation within 48 hours of running away. 

    37. Over 49,000 human trafficking cases have been reported to the National Human Trafficking Hotline in the last 10 years. 

    (Polaris)

    Adult kidnapping in the US is becoming a cause of growing concern because it often results in human trafficking.

    As a nation, we’re currently attempting to resolve this problem because the US is still one of the countries with the highest number of victims, along with Mexico and the Philippines.

    The National Human Trafficking Hotline is one of the steps in the right direction — it connects victims and survivors of trafficking with social services and agents that can help them.  

    38. The National Human Trafficking Hotline receives approximately 150 calls daily. 

    (Polaris)

    This only serves to underscore the severity of US kidnapping statistics. Adult, child, and teen exploitation cases are on the rise in this 150 billion dollar industry.

    Luckily, both people and businesses are becoming more aware of the crime severity. They are now more likely to report human trafficking cases than they were a decade ago. 

    39. 10,949 cases of human trafficking were reported to the National Human Trafficking Hotline in 2018.

    (Polaris)

    According to kidnapping statistics in California, this state reported 1,656 human trafficking cases to the National Human Trafficking Hotline — the highest number in the country. Texas was second with 1,000 cases, and Florida was third with 767 cases.

    40. With 7,859 cases reported in 2018, sex trafficking is the most frequent.

    (Polaris)

    Sexual slavery and prostitution are the most common types of human trafficking in the US, with most victims trapped in situations where they have no escape.

    Many are threatened, manipulated, and forced to perform sexual services, making it difficult to get away and start over. Many victims who do get away end up right back where they started because they simply have nowhere to go.

    41. Illicit massage/spa businesses are the most common venue for sex trafficking, with 861 cases reported through the National Human Trafficking Hotline in 2018.

    (Polaris)

    Massage and spa businesses that are just a cover for prostitution rings are common across the US. Kidnapping statistics by year disclose that, in 2012, there were 374 reported cases, while 2018 saw 861 cases. Sadly, this difference in numbers indicates that the crime rate showed consistent growth over time.     

    42. In 2018, there were 7,126 reported cases of female trafficking, compared to 1,137 male trafficking cases.

    (Polaris)

    Women are more affected by trafficking in most countries, and the US is no exception. Human trafficking in the United States statistics uncover that, in 2012, there were 2,571 reported cases, and in 2018 there were 7,126 cases.

    This doesn’t necessarily mean that more people are being trafficked. It could simply mean that national awareness about this issue is growing with each passing year and that people are more likely to report it. 

    43. In 2018, the National Human Trafficking Hotline recorded 78 cases of human trafficking where the victims were sexual minorities. 

    (Polaris)

    Human sex trafficking statistics for sexual minorities are difficult to find. Most research data is based on the gender binary standard, and cases involving trans, intersex, and otherwise gender non-conforming people are often underreported.

    The data pool for gender non-conforming victims is still small, and these types of cases must continue to be reported so the authorities can devise more anti-trafficking strategies.

     44. The second most common type of human trafficking is labor trafficking, with 1,249 cases reported through the National Human Trafficking Hotline in 2018.

    (Polaris)

    Kidnapping stats show that labor trafficking is another form of human slavery that people are frequently subjected to.

    The most common industry for labor trafficking is domestic work, with 214 cases reported through the National Human Trafficking Hotline in 2018. The second most common venue for labor trafficking involves the traveling sales industry.

    45. There were 5,070 cases of adult human trafficking and 2,378 cases of child human trafficking reported through the National Human Trafficking Hotline in 2018.

    (Polaris)

    Child trafficking statistics are disheartening. Over 2,000 cases were reported in 2018, and child trafficking has been present in every single state in the US.

    Anyone can be trafficked, regardless of their gender, sexual orientation, age, race, or nationality.

    According to national crime stats, children will often be forced into labor trafficking because parents cannot support the family alone, and harmful social norms can put children at greater risk of becoming victims.

    46. In 2018, the National Human Trafficking Hotline found 1,499 reported cases where the victim was a US citizen or a lawful permanent resident.

    (Polaris)

    Not only immigrants get trafficked. In 2018, most of the reported cases involved US citizens or lawful permanent residents.

    Kidnapping rates in the US show that our citizens are at great risk of modern slavery. In comparison, there were 1,237 cases involving the trafficking of foreign nationals. For a lot of cases, no demographic data is provided to the National Human Trafficking Hotline.

    47. The number one way people contacted the National Human Trafficking Hotline in 2018 was via the internet.

    (Polaris)

    Kidnapping in America and human trafficking can be reduced by making help easily accessible to victims. The rise of the internet and online services means that assistance is more widely available.

    The Bottom Line of Abduction Statistics: We’ve Still Got a Long Way to Go

    America has made great strides in containing the human trafficking industry and helping kidnapping victims.

    However, we’re nowhere near done. Kidnapping for ransom and trafficking are profitable industries that are kept alive through corruption and neglect.

    To continue helping those that need us most and to keep our children safe, we cannot keep turning our heads. Once we stop being passive observers and start acting, we can make a difference and gradually change human trafficking and kidnapping statistics.

    If you are a human trafficking victim or know someone who could be a victim of human trafficking, please contact the National Human Trafficking Hotline.

    Phone Line: 1 (888) 373-7888

    Textline: Text “BeFree” (233733)

    Online chat: Link

    People Also Ask

    What percentage of kidnappings are by strangers?

    Despite what is commonly believed, when a child is missing, family members are usually the ones who have committed child abduction.
    Out of all missing children cases in 2015, only 0.1% were perpetrated by actual strangers. In many stranger abductions, missing kids are found and brought back home, but a small number of them remain missing. The great majority, over 95%, managed to run away.

    What state has the most kidnappings?

    The number of abductions may vary from year to year. A recent report has revealed that Alaska has the greatest number of missing people (almost 41.8 individuals per 100.000 residents). Washington follows Alaska with 643 missing cases (8.7 individuals per 100.000 residents).
    Other states that face a high number of unresolved cases are:
    – Maryland (119)
    – Illinois (130)
    – Pennsylvania (133)
    – Arizona (142)
    – Ohio (167)
    – New York (211)
    – Virginia (364)
    – Texas (373)
    Considering the overall number of missing people, California has the most, counting 2,133 individuals who are missing.

    What is the number one state for human trafficking?

    California has been consistently recording the highest rate of human trafficking activity since 2012. In 2019, there were 1,507 cases reported to the National Human Trafficking Hotline.
    Out of that number, 1,118 were sex trafficking cases, while 158 were related to labor trafficking. Moreover, 69 were both sex and labor trafficking cases.
    The majority were related to illegal massage and spa centers located in hotels or motels. In terms of victims, 1,290 were females, 149 males, and 10 gender minorities.

    What are the odds of a child being kidnapped?

    The chances of a child getting kidnapped aren’t as high as people may think. They are 1 in 300,000.
    However, abduction can increase if a child is of non-white ethnicity, a girl, or lives in a foster home.
    The media often cover the disappearances of white children. Unfortunately, this is not the case with other races or ethnicities.
    There are many missing black girls that the public never finds out about. This leads to the conclusion that stats on kidnapping in the US are rather bleak for a lot of non-white families.

    What country has the most kidnappings?

    It changes from year to year. In 2017, it was Pakistan, with 18,363 kidnappings. Kidnapping in Mexico stats show that abductions in this country are also on the rise.
    Other countries with a high risk of abduction include:
    – Haiti
    – Brazil
    – India
    – The Philippines
    – Colombia
    – Venezuela
    However, according to the abduction rate per 100,000 people, New Zealand holds the surprising first position with 9.5 missing persons per 100,000.
    The second is Pakistan with an identical ratio, followed by Luxembourg and Germany with a rate of 6.0 and 5.5, respectively, according to the latest kidnapping statistics.

  • 18 Online Banking Statistics You Need to Know in 2024

    18 Online Banking Statistics You Need to Know in 2024

    Few innovations in the financial world have been as revolutionarily convenient as online banking. What typically entails waiting in long lines now can be done from the comfort of your home. So, it’s no surprise that online banking is now a vast part of the banking industry.

    We’ve put together some of the most interesting online banking statistics to show you just how much the service has grown since the 1990s.

    The stats cover topics ranging from the industry’s market value to the latest mobile banking trends. You can also find other fascinating insights, such as adoption rates and data protection.

    Essential Internet Banking Statistics (Editor’s Choice)

    • The average American bank user has around five bank accounts
    • In 2020, the global market size for wearable payment devices reached $10.35 billion
    • Banking Trojans attacked 625,364 PC users in 2020
    • At least once a month, 73% of people globally use online banking
    • 38.4% of smartphone users make in-store payments at least twice a year 
    • By 2023, more than 80 million people will use neobanks in Europe

    Online Banking Statistics

    1. The average bank user in the US has 5.3 bank accounts.

    (PaymentsJournal)

    People tend to choose different banks for the various benefits of their services, resulting in more than a single bank account per person. According to the online banking usage statistics from 2019, the average client has over five accounts across all types of financial establishments. 

    Among the reasons for opening an account in a specific bank, 49% of people say it’s due to feeling comfortable there, 26% already have an issued card from that establishment, and it’s where 14% keep their investments.

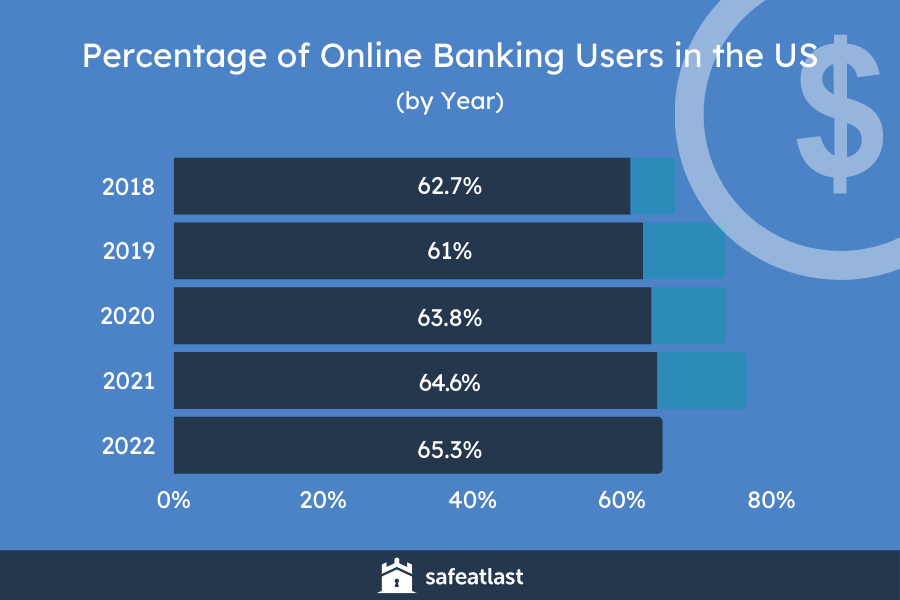
    2. In 2021, 64.6% of US citizens used online banking.

    (Statista)

    Online banking statistics show more and more people in the US are embracing digital banking.

    While in 2018, 61% of people used digital banking, in 2020, the number grew to 63.8%. Estimations show that by 2022, the share will probably rise to 65.3%.

    Online Banking Statistics

    3. The volume of digital payments in the first half of 2020 increased by 21%.

    (Sijoitusrahastot)

    Online banking statistics from 2020 show digital payments got a significant volume bump in 2020. Digital banking’s transaction volume also grew by 10%.

    4. The global market size for wearable payment devices was $10.35 billion in 2020.

    (Grand View Research)

    Some of the wearable tech pieces can be used as payment tools. Such devices turned out to be one of the biggest trends in mobile banking.

    Experts predict the market value of wearable payment tech to grow at a compound annual rate of 29.8% between 2021 and 2028.

    5. 625,364 PC users were attacked with banking Trojans in 2020.

    (Kaspersky)

    That represented a decrease from the 773,943 attacked users in 2019. Online banking facts and stats reveal that the most frequent victims of this financial malware in 2020 were Germany, Russia, and Kazakhstan users. 

    In particular, around 22% of the users were attacked by Zbot, the most common banking malware. Moreover, CliptoShuffler attacked about 15%, and Emotet — approximately 14% of the PC users.

    Online Banking vs. Traditional Banking Statistics

    6. 80% of people prefer online banking over visiting a brick-and-mortar establishment.

    (Consumer Affairs)

    The online banking usage statistics from 2020 show us that only 20% of US citizens are more inclined to visit a bank in person than use their smartphone or computer.

    7. 95% are confident that the bank can protect their data.

    (Consumer Affairs)

    According to the digital banking statistics from 2019, most people are positive that banks can protect their data. The statistics also show that 66% of people feel satisfied with their bank and its digital services.

    8. Only 12% of people older than 54 use mobile payment services.

    (Consumer Affairs)

    The mobile payment usage statistics show that 30% of people use mobile payment services at least once a week. However, approximately 12% of people over the age of 54 do the same.

    9. 56% of people have been redirected to the physical establishment while doing their banking online.

    (Lightico)

    The COVID-19 pandemic made a lot of people feel wary about visiting physical bank locations. But, unfortunately, over half of the US internet banking users couldn’t solve their problems without going there.

    Another 48% share they had to print, sign, and email bank-related papers when using the online banking services.

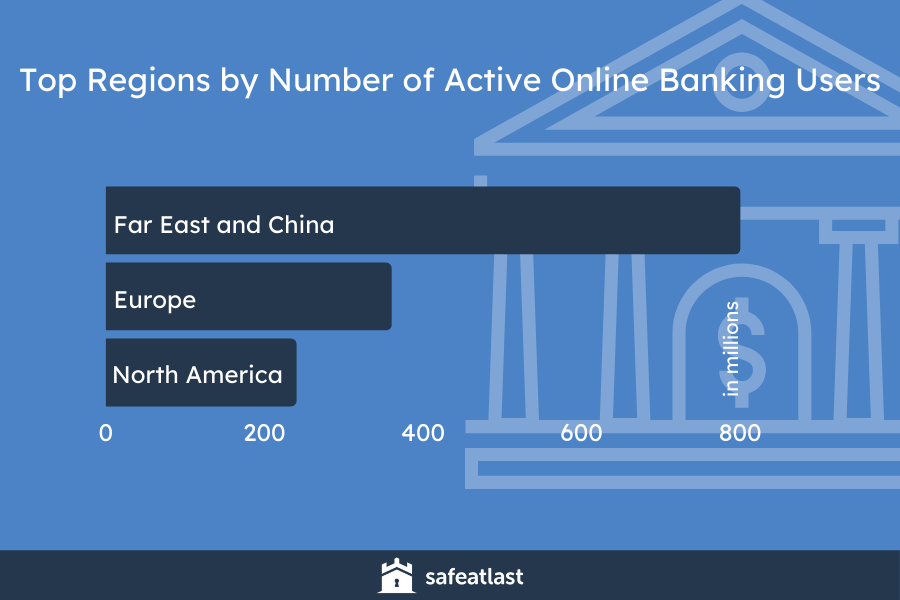
    10. Far East and China represented more than 800 million active online banking users in 2020.

    (Statista)

    So, they accounted for the largest part of the users. Europe came second, with around 360 million active online baking users, and North America took the third place, with about 240 million users. 

    In 2020, almost 2 billion people globally actively used online banking, This trend is projected to rise. In fact, by 2024, there will probably be 2.4 billion people who actively use online banking. Moreover, 2020–2024, the Asian market is forecasted to reach almost a billion. 

    Online Banking Statistics 2

    Mobile Banking vs. Online Banking Statistics

    11. 76% of US survey respondents use a mobile banking app.

    (Forbes)

    On the other hand, a fifth of the respondents claim they don’t use an app for banking. When asked about the reason why, the ones that use the mobile banking apps mentioned several things. 

    For instance, around 35% of respondents claim mobile check deposit is the feature they find most useful. About 33% like the feature of viewing statements and account balances. Another feature mentioned by the respondents (31%) is transferring funds between accounts. 

    12. 73% of people worldwide use online banking at least once per month.

    (Deloitte)

    According to mobile banking statistics, money transfers and balance inquiries are two of the most common uses for mobile banking apps.

    On the other hand, 59% of people find the online banking method more secure for complicated processes. That means inquiring about products, transferring money internationally, or updating account information. 

    13. 62% of consumers have a better awareness of their financial situation thanks to mobile banking.

    (Statista)

    Compared to visiting an actual bank, online banking is the quicker and simpler choice.

    The new mobile banking trends show people have an increased awareness of their financial situation. Over 60% of consumers said they’ve become better at keeping tabs on their accounts due to this service.

    14. As of June 2021, Nubank reached the 25-million-user benchmark.

    (Statista)

    Nubank is one of the leading app-based virtual banking companies in the world. It has an impressive number of users worldwide.

    Comparing its figures with global online banking statistics makes Nubank’s foothold apparent. On the other hand, Revolut (UK) and Chime (US), two other major companies, provide for 13 and 8 million consumers, respectively.

    15. 38.4% of smartphone users make an in-store mobile payment at least once every six months.

    (Emarketer)

    Mobile payment statistics estimate over a third of all smartphone users in 2020 made at least one in-store payment using a mobile app every six months.

    The projected use for the 2021-2022 period increased from 39.9% to 41.1% of the people and it will grow from 41.1% to 42.2% between 2022 and 2023.

    The majority of adoption comes from the Asia-Pacific region, mainly in China.

    16. The deployment of chatbots will save the banking industry $7.3 billion by 2023.

    (Juniper Research)

    Chatbots are one of the biggest trends in mobile banking. They save companies tons of money as they replace paid staff and due to their constant availability.

    Juniper Research has significantly raised its initial prediction of $209 million saved on customer service.

    17. There will be over 85 million neobank users in Europe by 2023.

    (Kearney)

    A neobank is a bank that offers only digital services. This concept comes with many perks that have thus far contributed to the online banking growth we see today. 

    The lack of overhead costs results in lower fees for customers. The users can manage their banking obligations with just a few clicks instead of visiting a bank in person.

    Stats on online banking trends show that the number of neobanks has grown to over 15 million since 2011. In addition, the number of neobank customers in Europe is expected to reach 85 million by 2023.

    18. Mobile browsers and apps account for 71% of fraud transactions.

    (Specialist Banking)

    The presence of fraud transactions on banking apps and browsers is one of the more worrying mobile banking technology trends. The most recent research shows that the rate of such scams is on the rise.

    Conclusion

    The banking landscape constantly shifts and adapts as new technological innovations enter the scene. This has always been the case, from credit cards to ATMs.

    Online banking is not much different in that regard. The extent of the change it brought has been — and continues to be — profound.

    All the above online banking statistics show positive industry growth and widespread adoption. 

    We can’t precisely predict whether this service will make traditional brick-and-mortar banks obsolete. At current rates, however, it most certainly is turning into the default banking option worldwide.

    People Also Ask

    How has electronic banking changed banking services?

    Electronic banking has a profound impact and continues to change the financial landscape. For one, it allows people to do their banking with just a few clicks of a button.
    That makes financial affairs both quicker and more convenient, especially in the COVID-19 pandemic settings.
    Banks that implement online capabilities tend to have lower fees due to the lack of overhead costs.

    When did online banking start?

    While there were similar concepts as far back as the 1980s, the first online bank became available to the public in 1995. At that time, however, only a tiny fraction of people were online.
    The Security First Network Bank opened on October 18, 1995. It was the first bank to offer many of the features we associate with online banking today. In the years to follow, numerous online banks took cues from SFNB’s structure and innovations.

    Are banking apps secure?

    Generally, mobile apps are secure for your financial needs. In fact, mobile apps tend to be safer than online banking in some respects. Mobile devices have additional hardware security features that make mobile banking a more secure process than banking online.

    How many people bank online?

    According to online banking statistics, over 160 million people in the US use online banking regularly. However, experts have predicted this number will rise by 2022 — around 65% of the US population will be using digital banking.
    Even more people are using online banking tools occasionally. Namely, around 73% of people with bank accounts use online banking at least once a month.

  • 28 Shocking Gun Crime Statistics

    28 Shocking Gun Crime Statistics

    Gun violence is a prominent issue in the US, especially given its unique relationship with firearms. The citizens’ right to bear arms is an integral part of the culture, but widespread gun ownership increases crime rates.

    We will show you a list of insightful gun crime statistics to give you an objective look at the topic. You’ll learn about current crime rates and deaths data and other practical information related to the subject.

    Let’s take a look at the most recent stats on gun crime.

    Essential Gun Violence Statistics (Editor’s Choice)

    • There are over 100 deaths daily due to gun violence in the US
    • Children witnessed, suffered, or were killed in 611 mass shootings in 2020
    • 40 active shooter incidents happened in 2020
    • Almost 60 people died in the Las Vegas Strip massacre
    • In the US, 44% of adults keep a gun in their household
    • There are more than 830,000 registered weapons in Texas
    • 57% of people support the implementation of stricter gun control laws
    • There were 34 school shootings in the US in 2021

    Gun Violence Stats

    1. Gun violence results in more than 100 deaths a day in the US.

    (Everytown Research)

    On top of that, more than 200 people are shot or wounded. On average, the annual number of gun deaths by intent is almost 39,000. Believe it or not, US gun death statistics confirm that suicide is responsible for over 60% of gun deaths. 

    2. In 2020, children attended, suffered, or were killed in 611 mass shootings. 

    (Children’s Defense Fund)

    That was an increase of 194 more mass shootings involving children compared to 2019. Heartbreakingly, gun death statistics note that guns ended the lives of more children and teenagers than pneumonia, asthma, cancer, opioids, and HIV/AIDS combined. 

    In fact, for every child killed by a gun, another five suffered gunshot wounds. 

    3. Firearms accounted for 73.7% of murder cases in 2019.

    (FBI)

    Out of all the categories of homicide weapons the FBI tracks, firearms are by far the most common tool used. 

    FBI’s stats show knives or other cutting instruments made up 10.6% of all murder cases. So-called personal weapons — hands, feet, etc. —  account for 4.3%.

    4. United States gun death statistics reveal guns killed almost 20,000 people in 2020.

    (The Washington Post)

    Moreover, another 24,000 people were killed by suicide involving a gun. Gun violence has become increasingly common in the United States. Additionally, 2020 was the deadliest gun violence year in the last 20 years. 

    5. 486 people died in unintentional gun accidents in 2019.

    (EFSGV)

    According to the US gun homicide rate, less than 2% of all gun-related deaths are caused unintentionally. In 90% of these cases, the victim was male.

    In addition, over half of the accidental gun deaths per year are casualties under the age of 35. 

    6. In 2019, over 180,000 aggravated assaults included a firearm.

    (Statista)

    There were over 650,000 aggravated assaults in 2019. Most of them — 200,826 — fell in the broad classification of “other weapons.” On the other hand, 186,078 cases involved a firearm, as the statistics on gun violence show us. 

    Personal weapons and cutting instruments (like knives) are the other prominent tools in aggravated assaults — 169,384 and 117,854, respectively.

    Most Common Assault Tools

    7. Firearms accounted for 73.66% of homicides in 2019.

    (Statista)

    US gun violence statistics reveal that there has been a rise in homicides committed with such means. 

    According to the gun violence statistics, the lowest percentage of gun-related homicides in the last 15 years was 2014 — 63.55%. In 2016, the number rose to 67.72%, and in 2019 —  to over 73%. 

    8. Most gun deaths in the US are suicides.

    (Statista)

    According to the most recent data, there are 24,432 suicides by firearm annually. Meanwhile, the number of gunshot deaths per year reported in homicide cases is 13,958 —  almost two times less than the number of suicides.

    The data reveals that men over the age of 45 commit 85% of gun suicides. 

    Statistics on Mass Shootings

    9. 83 mass shootings in the US were carried out with legally obtained weapons in the last 39 years.

    (Statista)

    When it comes to mass shootings, the perpetrators usually use weapons bought through legal means. 

    US mass shooting statistics reveal 16 instances with illegally obtained weapons or firearms between 1982 and May 2021, and one with both legal and illegal. 

    The authorities couldn’t determine the legality of the weapons used in 17 mass shootings in that period. 

    10. The Las Vegas Strip massacre caused 58 deaths.

    (Statista)

    The Las Vegas Strip massacre of 2017 was the worst mass shooting in US history — 58 fatalities and 546 injured.

    Mass shooting statistics by year show that the 2016 Orlando nightclub massacre is the second-most lethal, resulting in 49 deaths and 53 injured.

    11. There were 40 active shooter incidents in 2020.

    (FBI)

    They occurred in 19 states. Believe it or not, the number of the incidents is 33% higher compared to 2019 and 100% higher than in 2016. Apart from the shooters, who were mostly male, 38 people lost their lives, and 126 ended up wounded.  

    12. The most recent mass shooting with over 20 casualties happened in 2019.

    (Gun Violence Archive)

    The annual death rates from mass shootings show us that the last incident with over 20 casualties was in 2019 in El Paso, Texas. The incident resulted in 23 deaths and 23 injured.

    13. White perpetrators were responsible for 66 of the mass shootings in the last 39 years.

    (Statista)

    According to gun crime statistics by race, out of the 124 mass shootings between 1982 and May 2021, white people committed over half of them. 

    On the other hand, Black people committed 21 mass shootings, Latinos were responsible for ten, and Asians — for eight. The race of the shooter was not determined in the rest of the cases.

    14. 405 people have died in mass shootings since June 2021.

    (Gun Violence Archive)

    Shooting statistics reveal that the deadliest incidents included five victims each. The first one occured in June, and the youngest victim was 19 years old. 

    The other mass shooting happened in July and the youngest victim was a male teenager. Lastly, in November, one of the five victims was a one-year old child. 

    Gun Ownership vs. Homicide Rate

    15. In 2019, the US had the lowest number of imported firearms.

    (Statista)

    According to 2019 gun control statistics, the US imported fewer than 400,000 weapons. This is a tremendous decrease compared to previous years. For example, in 2018, the imported firearms were over four million.

    16. 44% of US adults have a gun in their household.

    (Gallup)

    Evidence suggests guns are widely available in the US, as 32% admit they own a gun — 45% of men and 19% of women.

    Further research indicates that the majority of gun owners, 45%, live in the country’s rural areas. These weapons are totally legal to own though, as per the second amendment, and lots of gun owners also purchase gun cleaning kits for their weaponry.

    17. 38% of white people in the US own a gun.

    (Gallup)

    White people are the most likely to own a firearm, over a third of the group. In comparison, only 18% of non-white people admit ownership.

    United States gun violence statistics also show that white people are the most common perpetrators of such crimes.

    Additionally to owning a firearm, many Americans also have a gun safe in their household.

    18. Over 700,000 more guns were sold in March 2020, in comparison to previous years.

    (Brookings)

    President Trump declared a state of national emergency on March 13, 2020, resulting in a surge of people buying guns.

    Throughout the first quarter of 2020, people bought an average of fewer than 100,000 guns a day. But following the president’s declaration, this number skyrocketed to over 120,000 daily.

    According to gun control stats, March 16 was a time of peak gun sales, with 176,000 firearms sold that day alone. The upward trend quickly died off, returning to average values in April.

    Gun Violence by State

    19. Texas has over 830,000 registered weapons.

    (Statista, Giffords)

    Texas has the most registered weapons by a significant number compared to other states. Florida takes second place with a little under 500,000. Virginia, the state with the third-highest gun registration rate, has nearly 400,000 weapons.

    Texas, however, is in the 28th place in gun deaths by state, with 12.3 people dying from gunshots per 100,000. This translates to 3,455 deaths per year or a person dying due to a firearm wound every 3 hours.

    Top 3 States With Registered Weapons

    20. 85.87% of homicides in Missouri include guns.

    (Statista)

    Missouri is in the lead among the states with the most gun violence. South Carolina is not that far behind at 85.62%, followed by Illinois at 83.92%. 

    21. California had 22 mass shootings up to May 2021.

    (Statista)

    California has a much higher rate of mass shootings than other states. It also has one of the most stringent gun laws in the country. 

    The gun homicide rate by state reveals that Florida suffered 12 mass shootings in the last 39 years, followed by Texas with 11.

    22. Mississippi’s mortality rate by firearm is 22.9 per 100,000 people.

    (Statista)

    Mississippi has the highest gun-related mortality rate in the US. Alabama is second, with 21.8. 

    Gun death rates by state show Rhode Island has the lowest mortality rate of 3.3. Massachusetts, Hawaii, and New York also have admirably low rates — 3.5, 4, and 4.1, respectively.

    Strict Gun Laws vs. Crime Rate Statistics

    23. 57% of US citizens feel gun laws should be more rigorous.

    (Statista)

    The US has varying levels of gun restrictions across the states. For instance, California has the most restrictive gun policies, while Arizona and Alaska are on the other end of the spectrum, with the fewest restrictions.

    When it comes to introducing more gun laws, statistics show us that most of the population supports the idea. 34%, however, think that the laws are good as they are, while 9% believe they should be less severe.

    24. 45% of voters strongly support gun control laws.

    (Statista)

    Statistics on gun violence seem to have moved almost half of the US voters to strongly support control laws, while 15% strongly oppose it. 

    In terms of political affiliations — 75% of Democrats support gun control laws, whereas only 16% of Republicans feel the same way, and 37% oppose it.

    Worldwide Gun Violence Stats

    25. The US has the highest firearm death rate among the largest economies in the world.

    (Statista)

    According to the latest data, 3.149 people per 100,000 die in firearm incidents yearly. For comparison, Germany is second with a rate of 0.1.

    Further analysis of gun violence statistics by country shows the other countries have even lower rates.  For instance, the UK’s rate is 0.048.

    26. The US witnessed 34 school shootings in 2021. 

    (Education Week)

    Believe it or not, 24 occurred after the beginning of Augist. The deadliest one was in November, when a student injured seven people and killed four. In detail, 68 people were killed or injured, among which three members of the school staff or adults were killed. 

    In comparison, the 2020 numbers are lower, probably because of the pandemic and the remote learning. 

    27. Norway has a mass shooting death rate of 1.888.

    (World Population Review)

    With a median rate of 1.888 deaths per capita, Norway ranks first among countries with the most mass shootings. Norway, however, has among the lowest rates of violent crime in the world.

    The other countries in the top five list are Serbia (0.381), France (0,347), Macedonia (0.337), and Albania (0.206). While they experience very few shootings overall, their mortality rate is much higher.

    As mass shooting statistics by country show the US is 12th in the world in deaths per capita.

    28. El Salvador had a 72.5 firearm death rate per 100,000 people annually.

    (Statista)

    El Salvador has the highest gun death rate in the world. According to the most recent data, over 4600 people died in El Salvador in a year as a result of gun violence. 

    According to gun crime statistics, Venezuela is second with a rate of 64.3.

    Conclusion

    No matter your stance on gun control, we can all agree that the number of gun-related crimes in the US is a cause for alarm, especially given the frequency of such crimes.

    Gun crime statistics, however, show that such problems happen everywhere in the world. The solution is not simple and would require stricter rules and additional changes in the gun culture. 

    The stats we gathered illustrate the depth of the problem — death rates, mass shooting frequencies, and gun availability and distribution.

    People Also Ask

    How many guns are in the US?

    However fantastical it might sound, there are more guns in the US than people. Specifically, the country’s population is 330 million, and there are over 400 million guns.
    That means there are 1.2 firearms for every US citizen. It’s among the countries with the most firearms per person. The abundance of weapons is an essential factor in the prevalence of gun crime in the US.

    How many people are killed by guns each year in the United States?

    According to the most recent statistics, there are almost 40,000 gun-related deaths in the US annually. However, this number includes both murders, suicides, and other related deaths tracked by the CDC.
    When it comes to state-by-state stats, Missouri has the highest gun death rate of 85.87%. Other states with exceptionally high rates are South Carolina (85.62%), Illinois (83.92%), Maryland (83.48%), and Delaware (83.33%).

    What percent of gun deaths are suicides?

    Over half of all gun deaths in the US are due to suicide. Namely, around 60%, while 37% are due to homicide.

    Does gun control reduce crime statistics?

    The US has the most guns of all the countries, but some states also have strict gun laws. Some states with strict gun laws, like California, have high gun crime statistics for various reasons.
    However, the FBI’s stats show that gun control is an effective method for curbing violent crimes. Mainly because reduced weapons distribution correlates with less gun crime.

  • 30+ Crime Rate Statistics You Should Know in 2024

    30+ Crime Rate Statistics You Should Know in 2024

    The US has a high crime rate, especially compared to other countries. It’s due to various reasons, ranging from enacted policies to impoverished neighborhoods. We’ve put together some alarming crime rate statistics to show you the current rate and tendencies.

    We’ll cover different kinds of criminal activities and compare the situation with other places around the world.

    This data will help you better understand how bad criminal rates are in the US and how to protect yourself from potential danger.

    Terrifying US Crime Statistics (Editor’s Pick)

    • White males are eight times less likely to become homicide victims than black males 
    • 73.7% of murder cases involve firearms
    • Detroit’s violent crime rate is 19.5 per 1,000 people
    • The violent crime arrest rate was 147.9 per 100,000 population in 2020 
    • Over 267,000 robbery cases occurred in 2019
    • Auto thefts are 74.5% of all vehicle thefts
    • Louisiana has a homicide rate of 12.4 per 100,000
    • Property crime victims lost over $15 billion in 2019

    Staggering Stats on US Crime Rate

    1. 51% of US citizens consider crime to be a severe national problem.

    (Statista)

    According to 2020 crime rate statistics, over half of the population felt that crime was a serious problem in the US.

    Research shows a slight improvement in the situation over the last five years. In 2016, 60% believed the crime rates were getting out of hand — marking the highest level of dissatisfaction this century.

    Only 10% of people, however, say that crime is a big issue in their local area.

    2. Auto thefts constitute 74.5% of all vehicle thefts.

    (FBI)

    According to the FBI’s US crime statistics, passenger cars are by far the most common type of stolen vehicles.

    The rates in the Northeast and Midwest regions are higher than the average — 86.1% and 83.5%, respectively. Cars make up 70.1% in the South and 73.4% in the West, but bus and truck thefts are more prominent. 

    Trucks represent 19.2% of all stolen vehicles in the South and 18.3% in the West. For the Northeast and Midwest, it’s 3.8% and 8.6%, accordingly. 

    3. A property crime occurs every 4.4 seconds.

    (FBI)

    The most recent crime statistics in the USA show a burglary takes place every 25.7 seconds, and a motor or vehicle theft happens every 42.2 seconds.

    Larceny is the most frequent of these misdeeds — every 6.1 seconds.

    4. In 2019, law enforcement agencies made over 10 million arrests.

    (FBI)

    There were 10.1 million arrests across all law enforcement agencies, according to the FBI crime statistics. This figure excludes arrests for traffic violations.

    Arrests for property offenses were the most numerous — 343.3 per 100,000 people. Of these, 263 were for larceny-theft, 52.3 for burglary, 25.1 for vehicle theft, and 2.8 — arson.

    5. There were over 267,000 robbery cases in 2019.

    (Statista)

    The available data shows a general decrease in crime rates over the last 50 years concerning robberies. 

    In 2019, there were nearly 268,000 robberies committed. It is the lowest robbery crime rate in the USA since the 1990s.

    Crime Statistics by State

    6. The District of Columbia had the highest violent crime rate in the US in 2019.

    (Statista)

    The District of Columbia had the highest crime rates for violent offenses — 1049 violent crimes per 100,000 residents.

    Alaska was second, reporting a violent crime rate of 867.1. New Mexico followed with 832.2 violent crimes per 100,000 citizens.

    US Districts with High Crime Rates

    7. Maine had the lowest reported violent crime rate in America in 2019.

    (Statista, Data Commons)

    Maine has a crime rate of 115.2 violent offenses per 100,000 citizens — the lowest crime rate in the US.

    Among the reasons for that are the high median age of Maine’s residents (44.7) and its low population density.

    Two other states with low violent crime rates in the US are New Hampshire (152.5) and Connecticut (183.6). 

    8. Louisiana’s homicide rate is 12.4 per 100,000 people.

    (World Population Review)

    Louisiana’s homicide rate of 12.4 per 100,000 residents is considerably higher than other states. 

    The murder rate is the highest of all states for decades in terms of violent crime rates.

    9. Detroit has a crime rate of 1965.33.

    (Statista)

    Detroit ranks as the most dangerous city in the US. The town has had soaring poverty rates, heavy drug use, and gang activity for years now. 

    Recent crime rate statistics by city show Detroit’s to be 1,965.33 per 100,000 citizens. 

    St. Louis and Memphis follow closely. St. Louis’ rate is 1,927.32, and Memphis’ 1,901.42.

    10. The sexual assault rate in Alaska is four times higher than the national rate. 

    (World Population Review)

    United States crime rates show Alaska has the highest number of sexual assaults — 161.6 cases per 100,000 residents. 

    Alaska’s violent crime stats are overall high — 21% of all offenses.

    Crime Rate in the USA: Some Intriguing National Averages

    11. The arrest rate for violent crimes in 2020 was 147.9 per 100,000 citizens.

    (FBI)

    In four years, that was the first time the number of violent crimes had increased compared to the year before. More specifically, the FBI’s crime statistics show that the violent crime rate in 2020 increased by 5.2% in comparison to 2019. 

    There were over 1,200,000 violent crimes in 2020. 

    12. There were five reported cases of murder and manslaughter per 100,000 residents in 2019.

    (Statista, ResearchGate)

    Violent crime rates plummeted in the latter half of the 90s, and we now enjoy the lowest activity in recorded history.

    The recent US crime rates by year show a decrease in the number of murder and manslaughter cases. The crime rate was only five cases per 100,000 people in 2019.

    13. Murder and manslaughter have a 61.4% clearance rate.

    (Statista, Pew Research Center)

    Crime statistics in the United States show that murder and manslaughter have the highest clearance rate of 61.4%. Aggravated assault is second with 52.3%, while rape has a below-average rate of 32.9%.

    14. The US property crime rate in 2020 was 1,958.2 offenses per 100,000 inhabitants.

    (Parsons PD)

    Compared to the previous year, property crimes lowered by 7.8%. In fact, that was the 18th year in a row with a decrease in these offenses. 

    In 2020, there were about 6,452,038 property crimes in the US. That led to property crime victims losing about $17.5 billion.

    Violent Crime Statistics

    15. In the US, a murder happens every 32.5 minutes.

    (FBI)

    The FBI’s official crime statistics disclose that every 32.5 minutes, a murder occurs. 

    Murders, however, happen much more rarely than most other common crimes. To compare, every 26.2 seconds, a violent crime takes place. 

    In addition, every 1.9 minutes, a robbery occurs, a rape — every 3.8 minutes, and aggravated assault — every 39.2 seconds.

    Frequency of Crime Rates

    16. There were over 21,500 non-negligent manslaughter and murder cases in the US in 2020.

    (Statista)

    Crime rates in the US show that in 2019, over 16,500 cases of these offenses were reported, meaning that there was a substantial increase in only a year. 

    As for the murder victims’ gender in 2020, more of them were male than female. On top of that, Black victims accounted for a considerable part of the total number of victims. 

    17. The US aggravated assault rate in 2020 was 279.7 cases per 100,000 of the population.

    (Statista)

    Unlike other types of crime, assault cases have been on the rise in the last few years. For instance, US crime rate statistics note that this rate was 250.4 cases per 100,000 of the population in 2019. 

    In addition, the state with the highest number of aggravated assaults (113,646) in 2020 was California. 

    18. In 2019, there were over 98,000 rape cases.

    (Statista)

    Instances of forcible rape have risen sharply over the last eight years.

    The crime statistics in the US show 98,213 reported rape cases in 2019. 

    It shows a significant rise with the figure of 2013 — 82,000 cases.

    19. California had the most homicides in 2019 — 1,690.

    (Statista)

    Of all the states, California took the lead in the number of homicides for 2019. 

    The US crime statistics by year put Texas second, with 1,409 instances recorded for 2019. Florida follows with 1,122 murders.

    Meanwhile, the three states with the fewest homicides were South Dakota (17), Wyoming (13), and Vermont (11).

    Other Curious National Crime Statistics

    20. Provo-Orem, Utah, is the safest metro area in the US, with 0.9 violent crimes per 1,000 residents.

    (Safewise)

    While metropolitan areas tend to house more criminal activity on average, this doesn’t apply to all. Promo-Orem, Utah is the safest of them all, as research has shown.

    According to the data, this province has 13.6 property crimes per 1,000 inhabitants. When compared to average national crime rate stats (3.7 violent crimes and 22 property crimes), Provo-Orem turns out to be among the most peaceful places in the US.

    21. Detroit has a violent crime rate of 19.5 per 1,000 population.

    (Neighborhood Scout)

    Detroit proves to be the most dangerous city in the US regardless of its recent decrease in violent crimes. 

    There were 13,088 instances in 2020, 3% fewer than the year before. That’s still high compared to the nationwide crime rate statistics in America.

    22. There were nearly seven million property crimes in 2019.

    (Statista)

    United States crime rate statistics show property crimes have been slowing down at a near-constant annual rate of around 5%. 

    2019 rates noted significant progress when contrasted with the 1991’s — a little short of 13 million cases.

    23. In 2019, property crime was nearly five times more common than violent offenses.

    (Statista)

    Despite dropping year by year, property crimes are still the vast majority of all crimes committed in the United States. In 2019, 6,925,677 property crimes took place, as opposed to 1,203,808 violent.

    The national crime rate statistics show the most prominent offenses among property crimes to be larceny and burglary. Larceny accounted for a little over five million cases and burglary — around 1.1 million.

    24. Victims of property crimes lost over $15 billion in 2019.

    (FBI)

    Property crime results in heavy financial losses overall. The victims suffered economic losses of approximately $15.8 billion in 2019, as per the FBI’s crime rates statistics. 

    This sum excludes damages due to arson, mainly because of “variations in the level of participation by the reporting agencies.”, making the data on arson unreliable. But on the brighter side, arrests for property crimes are also fairly common.

    Crime Rate Demographics

    25. Black male homicide victims are roughly eight times more than white.

    (BJS)

    The most recent crime rate statistics by race show that around 32.5 Black males per 100,000 were victims of homicide in a year. For comparison, the same crime rate for white males is 3.9%.

    The Black crime rate statistics from the last decade show that the homicide victim rate has fluctuated around 30.

    26. The data for 2019 shows nearly five million arrests of white people.

    (FBI)

    FBI’s most recent data reveals a total of 6,816,975 arrests in 2019. The crime rate percentage by race indicates that the white perpetrators accounted for 4,729,290 and Black — for 1,815,144. That translates into 69.4% and 26.6%, respectively.

    Both white and Black criminals are arrested predominantly for property offenses — 517,502 and 231,087 instances for 2019.

    27. In 2019, over 5 million males were arrested.

    (FBI)

    Males account for the vast majority of arrests in the US. In 2019, law enforcement arrested 5,012,260 men, compared to 1,905,292 women.

    According to FBI crime rate statistics, males dominate most of the categories. For example, they constitute 96.6% of rape cases, 93.2% of sex offenses, and 90.4% of gun crimes.

    In some cases, the arrest rate is even between the genders. For instance, 49.8% of the embezzlement arrests are male, and 50.2 — female.

    Prostitution is the only category with predominantly women arrested — 63%.

    Strict Gun Laws vs. Crime Rate Statistics

    28. Firearms account for 73.7% of murder cases.

    (FBI, Office of Justice Programs)

    Most people who committed murder used firearms in 2019. Unknown weapons comprised 11.4% of all cases.

    Gun laws and crime rates statistics show that permit requirements and may issue regulations reduce firearm-related homicide rates.

    29. Over 10,000 homicides were committed with a firearm annually in the last five years.

    (Statista)

    Data from 2019 reveals that approximately 10,258 homicides by firearm occurred that year. The crime rate statistics for previous years show us that the rate stayed above 10,000 since 2016.

    30. Every day, guns kill over 100 people in the US.

    (Everytown Research)

    Over 200 people end up shot or wounded. Furthermore, suicide account for almost 66% of gun deaths. Having a firearm safe at home with varying locks and passwords may actually sway an individual in reaching for the gun when he or she can’t quickly access it.

    According to many agencies that are advocating for gun control, crime rates statistics of this nature show the issue has gone out of hand.

    Every year, the number of gun deaths by intent is, on average, 38,856. 

    Crime Rate Statistics by Country

    31. The murder rate in El Salvador is 82.84 per 100,000 people.

    (World Population Review)

    In terms of murder rates, El Salvador is the most dangerous country in the world.

    For comparison, world crime rates statistics show the second-highest rate in the world is in Jamaica — 47.

    32. The UK’s crime rate is 96.4 per 1,000 people.

    (Statista)

    The crime rate stats for the United Kingdom have been rising since 2013. 

    Northern Ireland and Scotland have significantly lower rates by comparison — 59 and 45.1, respectively, for 2020. Meanwhile, England and Wales have a rate of 102.8.

    33. South Africa’s rape rate is 132.4 per 100,000 citizens.

    (World Population Review)

    South Africa has by far the highest rate of rape cases of all countries. 

    Botswana is second with a rate of 92.2, according to statistics on crime rate. Lesotho follows with 82.7 per 100,000 people.

    Conclusion

    This post outlined some insightful info about crime rates in the US and other countries. It revealed both good and bad trends, helping you get an objective view of the current state of the issue.

    While crime is an incredibly complicated topic, these crime rate statistics showed which are the most often committed offenses, as well as the dangerous and the safest states and cities. Also, they can help you determine whether you are likely to fall victim to any crime.

    People Also Ask

    Who has the lowest crime rate in the world?

    One of the safest and crime-free countries is Finland, with a homicide rate of 1.42 per 100,000 people. The rape rate of 15.2 is considerably low compared to other countries.
    On the other hand, the world’s lowest homicide rate is Japan’s —only 0.28 per 100,000 citizens.

    What is the most dangerous city in the United States?

    Detroit is the most dangerous city in the US, with 1965.33 crimes per 100,000 citizens.
    St. Louis follows closely with a crime rate of 1927.32. Memphis ranks third with 1901.42 reported crimes.

    Why is Detroit so dangerous?

    Detroit stands as the city with the highest crime rate due to high gang activity and drug distribution.
    Although there’s been improvement in the crime rates over the recent years, Detroit still has a significant problem with poverty and shootings. Poor living conditions drive a lot of people toward a life of crime.

    What is the most dangerous state?

    Louisiana has the highest homicide and firearm death rates in the US — 12.4 and 18.5.per 100,000 people, respectively.
    When it comes to rape, however, the most dangerous state is Alaska, with 161.6 cases per 100,000 residents. This sexual assault rate is four times higher than the national average.
    Also, 21% of all crimes in Alaska are violent offenses.

    What is the best state to live in the USA?

    If you are looking for the safest state — Maine has the lowest crime rate of 115.2 per 100,000 citizens.
    The other two states with admirably low crime rate statistics are New Hampshire and Connecticut, with 152.5 and 183.6, respectively.