Author: Damjan Milenkovic

  • Malware vs Ransomware — Understanding the Difference

    Malware vs Ransomware — Understanding the Difference

    Cyber attacks are taking their toll, so many people are advised to pay more attention to cybersecurity. As technology improves, so do cybercriminals. 

    What differences can we find while comparing malware vs ransomware? How can they damage your computer? They can impair the system processes, delete your files, steal your information, and cost you money.

    These two are often used interchangeably, which is a misconception. In fact, malware is most often used as an umbrella term that comprises ransomware and other malicious software, such as spyware and viruses. Let’s dive deeper and discover their differences.

    Malware Definition

    Malware is the general term for all programs designed to harm, disrupt, or hack devices. What’s more, they can do so without authorized access. These programs act as inside agents, hiding in emails, attachments, and programs. Clicking on suspicious links and downloading untrusted files gives them access and control of your system. While you can remove some of them with antivirus software, others are more persistent and require more intricate approaches.

    Types of Malware

    Malware stands for all types of malicious programs and codes. If you didn’t know, malicious code is the code embedded in a web script or a software system with the intent of causing security breaches, network overload, data theft, system damage, and other undesired effects. Let’s not forget that the US has the highest number of breaches worldwide. 

    Knowing the difference between malware vs virus and other harmful programs might help you prevent these attacks from happening, so let’s move on to their typology. 

    Different malware types are designed to accomplish different objectives, such as hacking sensitive data, harming the computer, or disrupting its processes. While they all put your computer’s safety at risk, some are more dangerous than others. The malware types include:

    • worms
    • bugs
    • viruses
    • Trojans
    • spyware
    • spammers
    • scareware
    • rootkits
    • ransomware
    • crypto-jacking

    Malware Examples

    Here is a list of some of the most common malware types:

    • Ransomware example — RobinHood
      It blocks all city activities, like property transfers, government email, and tax collection.
    • Trojan example — Emotet
      This is a hard-to-fight banking Trojan that is persistent and involves spreader modules.
    • Spyware example — DarkHotel
      It targets government and business leaders that use hotel Wi-Fi and gets access to their systems. The malware Wi-Fi victim is typically an influential person.
    • Adware example — Fireball
      It makes browsers change their default search engines and traces web activity. 
    • Rootkit example — Zacinlo
      It infects systems when users download a fake VPN application. It is meant to trick behavioral analysis software. 
    • Worm example — Stuxnet
      It interferes with industrial controllers managing the uranium enrichment process. It is believed that this worm was developed to set back Iran’s nuclear program.

    Ransomware Definition

    Generally speaking, ransomware is a subcategory of malware that targets individuals or organizations. It encrypts their data and keeps it hostage while demanding a ransom. Statistics show that organizations pay an average ransom of $233,217

    Once the payment is made, the hacker sends a decryption key which restores access to the hacked data. Hackers often set a deadline and demand payments in cryptocurrency, usually bitcoin. 

    So don’t wait for such an attack to happen; make sure you are always equipped with the best ransomware protection

    Types of Ransomware 

    Cybercriminals use several kinds of ransomware vectors to access a system. Understanding these vectors can help you protect your device from ransomware attacks. Here are the three most prevalent ones:

    • Email phishing: Cybercriminals send employees emails that seem to come from trusted sources through social engineering tactics. The emails ask for the employee’s credentials or to download malware onto the system. 
    • Remote desktop protocol (RDP): Microsoft has designed this protocol to allow users to connect and remotely execute system commands. RDP security is tightly dependent on strong passwords. 
    • Software vulnerabilities: Unpatched software endangers security, leaving the door open for a malware attack. 

    Ransomware Examples

    There are several ransomware variants that cybercriminals use to target a business. Some of the most common ones are:

    • Locky: It spreads through emails with an infected Microsoft Word file. 
    • GandCrab: It uses social engineering tactics and targets vulnerabilities in the Microsoft Windows operating system. 
    • CryptoLocker: It gets employees to download ransomware and infect networks. 
    • Petya: It infects the master boot record to encrypt hard drive files and deliver a payload. It targets Windows-based systems. 
    • Reveton: Often referred to as the “Police Trojan,” it tricks users into thinking they have committed a crime and that the police have locked their computer. 

    Malware vs Ransomware — A Detailed Overview

    MalwareRansomware
    Varietyworms, bugs, viruses, Trojans, spyware, spammers, scareware, rootkits, ransomware, crypto-jackingemail phishing, remote desktop protocol, software vulnerabilities
    Delivery Methodemails, links, suspicious websites, USB, app installationsmalicious attachments through phishing emails
    ImpactIt can reduce system performance and control resources and data, but it doesn’t typically destroy a business.It is often severe, causing many businesses to close their operations.
    Ease of RemovalModerate, as antivirus software can usually remove it.Exceptionally difficult, as victims have to pay the ransom or restore from known backup

    Malware vs Ransomware vs Virus 

    While malware is a general term that describes any type of malicious software, it also encompasses ransomware and viruses. 

    Depending on the type, malware can cause different kinds of damage to a device. It can control and steal data, use the computer’s resources, or destroy the system. It spreads through software installation, emails, and web surfing. In the first half of 2021, as much as 75% of all malware was delivered by email.

    When comparing malware vs viruses, we can say that the latter represent malicious codes attached to specific documents. They may reformat a hard drive, degrade the performance of a device, and corrupt data. Viruses spread when people exchange or download files or visit harmful websites. However, they can also be harmless in some instances.

    On the other hand, ransomware locks the system and blocks data access until a ransom is paid. It spreads through attachments within phishing emails. 

    Spyware vs Malware vs Ransomware vs Threatware

    Spyware is silent malware that creeps through your passwords, files, and other sensitive data and extracts your information and uses it for malicious purposes. It can be harmless if an employer uses it to monitor their employees’ activities. However, cybercriminals can also use spyware to steal passwords and log into social media accounts or emails, posting or sending damaging information.

    Threatware meaning doesn’t differ from malware: both are umbrella terms for programs that can steal data and harm devices, such as worms, bugs, viruses, Trojans, and spyware. 

    Ransomware is a type of malware that encrypts or locks down your computer, demanding a ransom in exchange. These attacks may also lock down your entire network system. Moreover, ransomware is loud — it often displays warning signs or a timer indicating when your computer will crash.

    Ransomware vs Malware vs Phishing

    Malware represents a severe threat to businesses. Its varieties are complex and, therefore, hard to notice and remove. The main difference between them and phishing is that the latter is the delivery method. 

    A phishing attack is a social engineering technique in which an attacker sends an email to make victims reveal corporate or personal information. Furthermore, the attackers usually act as legitimate sources to persuade their targets. 

    Typically, ransomware or other malware attacks involve a victim clicking a link or downloading an email attachment, allowing the unwanted software to enter the device.

    Malware vs Virus vs Worm vs Trojan

    While malware serves as an all-encompassing term for worms, viruses, and Trojans, these last three are far from similar.

    For example, a worm can replicate and spread from one computer to another. On the other hand, a user or software has to send a virus from one device to another so that it can spread. Finally, rather than replicate, the Trojan’s goal is to capture some crucial data about a computer network or system. 

    So what is the main difference between a virus and a Trojan? Each type of malware has different objectives. While Trojans aim to steal information, viruses have the purpose of modifying it. As opposed to these two, worms aim to use the system’s resources. 

    Trojans and worms can also be controlled remotely, which isn’t the case with viruses. Moreover, the three have different spreading rates: worms multiply faster than viruses, while Trojans have the slowest spreading rate. 

    Virus vs Malware vs Worm 

    As we mentioned, malware is an umbrella term covering all harmful software, including viruses and worms. On the other hand, viruses can spread between computers while hiding inside files. Then, they can delete and change them, or even reformat the hard drive. For a virus to be activated, a person has to trigger it with an external action, which isn’t the case with a worm. 

    When looking at virus vs worm differences, unlike the former, the worm can run and spread itself on other devices without people opening files or clicking links. Therefore, if your network covers many connected computers, a worm may be more dangerous than a virus. 

    However, since computers in an organization’s network interact more with the Internet than they do with each other, viruses can be as dangerous as worms. For instance, if several users visit one site and download a virus to their computers, all of those computers get infected. 

    Virus vs Malware vs Spyware

    Since malware is a general term covering all malicious software, it also covers viruses and spyware. Viruses are programs that attach themselves to your software or data. In fact, for a virus to be activated, a person has to trigger it with an external action.

    On the other hand, spyware attempts to access your computer without your knowledge to monitor your activities. Although we can’t talk about malware vs spyware as the former covers the latter, we can definitely mention the difference between viruses and spyware. 

    While the primary goal of viruses is to alter the information, spyware aims to observe the device’s activity. Moreover, viruses tend to be more harmful than spyware because they can control resources and data, destroy systems, cause errors, and slow down device performance. In contrast, spyware gives profit to a third party by collecting the user’s data without their knowledge. It’s also important to mention that a virus replicates itself, while spyware doesn’t.

    Malware vs Ransomware — Final Words

    Malware encompasses all malicious software, and ransomware or viruses are only some of its subcategories. The key to staying safe from these and other malware types is equipping your device with an antivirus or a virtual private network, such as Avast VPN. Unfortunately, two in ten Internet users don’t protect themselves from cybercrime, according to statistics. 

    Whether we talk about malware vs viruses or other kinds of harmful software, cybersecurity awareness is of utmost importance for a healthy business. Users should keep in mind that even the strongest protection can’t save them from unintentionally leaving the doors open for attacks. Even in the event of an email coming from a familiar sender, always confirm whether it was really that person who sent the message. 

    People Also Ask

    What is malware?

    Malware is the general term for all the programs designed to disrupt, harm, or hack devices. Most often, they do so without authorized access. In addition, these programs act as inside agents and make you download a program, email, or an attachment, which enables them to gain control of your system. Most common malware types include worms, bugs, viruses, Trojans, spyware, spammers, scareware, rootkits, ransomware, and crypto-jacking.

    What is ransomware?

    Ransomware is a type of malware targeting individuals or organizations. More specifically, it encrypts their data, keeping it hostage and demanding the victims pay a ransom. After it is paid, the hacker sends a decryption key, restoring access to the hacked data. More often than not, hackers set a deadline and demand to be paid in cryptocurrency. The three most dangerous ransomware vectors are email phishing, remote desktop protocol (RDP), and software vulnerabilities.

    What’s worse, malware or ransomware?

    Ransomware is a subcategory of malware that is not easy to eradicate. Its impact is usually long-lasting and severe, leading to shutdowns in business operations. Other kinds of malware generally don’t target and destroy businesses. They are also easier to get rid of than ransomware since the regular antivirus software can do it. Removing ransomware most often requires the victims to pay the ransom or restore their data from backup. 

    What is the difference between viruses and malware?

    A piece of malware is a program that gains access to computer systems, usually to benefit a third party without the user’s permission. Since malware covers all harmful software, it also includes viruses. The most common viruses are malicious codes attached to executable documents that often modify or delete data. While some benign variants do exist, it is crucial to take action whenever you notice suspicious activity on your device.

    Can malware cause ransomware?

    Ransomware is a type of malware that prevents you from accessing your system, computer files, or networks and demanding you pay ransom in return. These attacks may lead to costly disruptions to operations and the loss of vital data. 

    Moreover, you can unintentionally download ransomware by following a link, clicking an ad, opening an email attachment, or visiting a malware-infected website. When the code is loaded, it blocks access to the computer or files. When comparing malware vs ransomware attacks, the biggest difference is that other kinds of malware can harm your device or damage the data within, while ransomware can prevent you from accessing both.

  • Enticing Website Load Time Statistics to Prioritize Page Speed in 2024

    Enticing Website Load Time Statistics to Prioritize Page Speed in 2024

    If you’re a website owner, our website load time statistics will make you place the page speed as your top priority! That’s because today you will learn how page speed affects:

    • Customer engagement
    • Conversion rates
    • Bounce time
    • Google search ranking
    • Your revenue

    Furthermore, we’ll go over the basics about the page load time as well as the averages for different types of web pages.

    As a result, you’ll know whether you should work on the average page load time for your website to achieve the highest possible engagement!

    Top Stats & Facts (Editor’s Picks)

    • Customer engagement can grow with only 0.1-second site speed improvement
    • Websites performing faster on mobile devices provide 75% more revenue
    • In 2019, the average page load time was 15 seconds
    • When taking more than 5 seconds to load, 37% of users leave a page
    • More than two-thirds of visitors claim that page speed impacts their willingness to buy
    • If page load time increases from 1 to 5 seconds, the chances of bounce increase by 90%
    • The desktop page load time should be less than 3 seconds
    • The mobile page load time should be less than 5 seconds

    Page Speed Insights

    Here are some essential insights on page speed as well as the recommended load time for websites. You will also learn the importance of working on your websites’ speed and how visitors respond to it.

    1. Customer engagement can increase with just 0.1 second site speed improvement.

    (Think with Google)

    An eBay case study shown in the popular “Milliseconds Make Millions” study analyzed the correlation between site speed and customer engagement. They concluded that just a slight improvement in the website loading speed leads to an 0.5% increase in the Add to Cart count. That’s a result of faster load time which makes customers view more pages and transact more.

    2. Websites that perform faster on mobile devices bring 75% more revenue.

    (Huckabuy)

    Compared to the slow-performing websites, the faster websites bring 327% more revenue on mobile phones. When it comes to desktops, fast rendering sites gain 212% more revenue.

    3. Google recommended page load time is under 2 seconds.

    (Blue Corona, YouTube)

    Ideally, the page load time should be anywhere between 1 and 3 seconds. However, Google aims at half a second. John Mueller, a Webmaster Trends Analyst at Google, claims that website speed is definitely a ranking factor in Google search.

    4. Web pages that loaded in 2.4 seconds had a conversion rate of 1.9%.

    (Huckabuy)

    The conversion rate refers to the number of visitors divided by the number of actual sales. We are giving you data from research on website load time statistics that have shown faster pages leading to a higher conversion rate. In case the website needs 3.3 seconds to load, the conversion rate is 0.4% lower.

    5. Websites with 5.7+ seconds of load time have a conversion rate of only 0.6%.

    (Huckabuy)

    At 4.2 seconds, the conversion rate is 0.4% higher. Moreover, websites with 3.3 seconds of load time have a rate of 1.5%.

    The Average Page Load Time 2019

    If you want to know whether the marketers worked on the page load time in recent years, we need to compare the numbers from 2019 and 2020. So, in this section, you will get the info on the website load time from previous years.

    6. The average page load time in 2019 was 15 seconds.

    (Unbounce)

    A few years ago, 34% of websites had a load time of 11 to 20 seconds. In around 46% of sites, users had to wait for 6 to 10 seconds for a page to load fully. In addition, website speed statistics show that about 13% of websites had a 4 to 5 seconds load time.

    7. In 2019, 57% of people would consider leaving a page that takes longer to load.

    (Unbounce)

    More than half of internet users will contemplate leaving a particular page if it takes them more than 3 seconds to see it. That leads to the conclusion that increasing the website speed can increase traffic.

    8. Around 37% of users leave a page that takes more than 5 seconds to load.

    (Unbounce)

    Thus, it comes as no surprise that the top-ranking websites on Google had the shortest time it takes for the page to load. It sat on less than 3 seconds in 2019.

    9. 70% of visitors claim that page speed affects their willingness to buy.

    (Unbounce)

    That is why Google urges site owners to work on their page speed. However, the Unbounce research uncovered that the majority of marketers don’t believe that website speed is a priority.

    10. About 30% of phone users would wait 4 to 6 seconds before closing a page.

    (Neil Patel)

    Another research from 2019 shows that only 16% of mobile users would wait from 11 to 15 seconds for a page to load fully. That’s concerning as the average page loading time is much higher – around 20 seconds. However, on the upside, only 3% would be willing to wait less than 1 second before closing a website.

    11. Around 30% of Android users are more patient than IOS owners when it comes to website speed.

    (Unbounce)

    Around 64% of Android and 36% of IOS users would wait up to 3 seconds for a page to load. What’s more, 61% of Android owners were willing to wait up to 13 seconds. However, the number sat at only 36% for IOS users.

    12. Website load speed for the healthcare industry was around 5.4 seconds.

    (Blue Corona)

    The Healthcare industry had the fastest website page loading time in 2019. With 5.5 seconds, media and entertainment came right after healthcare. The finance industry also had a quicker load time—5.9 seconds.

    13. The technology industry’s average page load was around 6.3 seconds in 2019.

    (Blue Corona)

    Out of all industries examined by Unbounce, technology had the worst load time. For example, the automotive and retail industries’ load time was 6.3 seconds, while travel sat at 6 seconds.

    Website Speed Statistics 2020

    Let’s take a look at some newer speed statistics. You’ll find out the average load time for 2020 on various devices and how that waiting time affects visitors’ engagement level.

    14. If page load time goes from 1 to 5 seconds, the probability of bounce increases by 90%.

    (Think with Google)

    In case users have to wait up to 3 seconds for your page to load, the possibility of them bouncing is around 32%. Furthermore, if websites take a long time to load, as long as up to 10 seconds, that results in a 123% higher chance of a bounce.

    15. Sites that take longer than 8.7 seconds to load on a desktop are among the worst-performing websites.

    (Littledata)

    Unlike them, the best 20% of websites need less than 3 seconds to load fully. So if your site takes less than 2.4 seconds, you are in the top 10%.

    16. The average time for the desktop page to load in 2020 was 4.5 seconds.

    (Littledata)

    According to the statistics presented in this article, one can realize that the average page load time benchmark is not ideal. On the other hand, mobile pages need around 5 seconds to load fully. 

    17. 10% of websites take only 2.7 seconds to load on mobile devices.

    (Littledata)

    Furthermore, less than 3.4 seconds wait time is also great. Users wait only 3 seconds for their page on 20% of sites. For mobile devices, anything longer than 7.4 seconds is considered unsatisfactory performance. About 20% of websites have a problem with this kind of wait time.

    Web Page Load Times Standards, Acceptable Speed for Achieving the Best Engagement 

    We already mentioned the correlation between the website speed and the visitors’ engagement. So, in this section, you will read about the ideal load time for desktop and mobile devices. In addition, you will find out whether there should be any difference between the speed of regular and ecommerce websites.

    18. The desktop page load time should be under 3 seconds.

    (Sprout24)

    Experts agreed that to boost engagement, the page load time should be 3 seconds or less, according to website load time statistics. Moreover, the server response time shouldn’t be over 2 seconds. Ideally, the domain lookup time is supposed to be from 0.15 to 1 second.

    19. The mobile page load time should be under 5 seconds.

    (Sprout24)

    Based on the statistics shown above, we know that mobile phones are a bit slower than desktops. That is why the standards for their speed are lower.

    20. The load time of ecommerce websites should be lower than 2 seconds.

    (Semrush, Portent) 

    In the first 5 seconds, the page load time abandonment rate increases by an average of 4.4% for every second of delay. Furthermore, in the first 9 seconds, the rates follow an average of 2.1% with each second potential customers have to wait. A conversion rate follows the abandonment rate. As the main purpose of this kind of website is selling goods or services, you must keep conversion rates as high as possible.

    Website Speed Statistics, the Bottom Line

    There you have it—all the info you need to comprehend the importance of website load time for your business! Besides the newer stats, we gathered the ones from 2019 and 2020 to give you the full picture. Moreover, we incorporated the page speed standards that you should aim for while you’re working on speeding up your website.

    In case you deem your site as too slow, you shouldn’t worry. You have various options online for speeding up your pages, such as compression, reducing redirects, improving server response time, optimizing images, and so on. Good luck!

    People Also Ask

    How fast should a website load in 2020?

    The website load time depends on the hosting server, page design and elements, browser, bandwidth, and the type of the device. But, in most cases, the load time should not be longer than two seconds. Google is aiming to have a load time of less than a second. That’s because less load time means better engagement and a higher conversion rate.

    What is a good response time for a website?

    According to recommendations by Google, a response time of a website should be under 200 milliseconds. In fact, sites should aim for anything lower than 100 milliseconds. On the other hand, a website that takes longer than 500ms has a pretty lousy response time. Still, there are ways to increase the response time, such as using reliable web hosting, configuring caching, optimizing databases, and so on.

    How do I check the loading time of a website?

    Many websites will allow you to enter an URL of a site to check its loading time. For example, you can go to the Developers section on Google and choose PageSpeed Insights. After you click on that option, you will be able to copy the URL of your website. You will then receive its insights and analytics, which include the loading time.

    What is the average website load time?

    The numbers for the website load time tell us that the average time desktop users wait for their page to load fully is around 4.5 seconds. The load time is a bit longer for mobile users, and it’s usually over 5 seconds. When it comes to the wait time, every second counts. That is why a lot of businesses make shortening the website load time one of their priorities.

    Why does my website take a long time to load?

    A reason why a website takes a long time to load might be as simple as having an issue with the local network connection. So, before panicking, you should use another network to access the website. If the issue persists, look for a culprit elsewhere. According to website load time statistics, other common reasons for this problem could be the amount of information in the database and slow web hosting.

  • The Essential Items For Your Coronavirus Survival Kit

    The Essential Items For Your Coronavirus Survival Kit

    Coronavirus has been a significant threat to our well-being. It affects virtually every aspect of our lives, leading to many changes and adjustments to how we act and think.

    Even though vaccines are now widely available, it’s still imperative to know how to protect yourself and your family and choose the right products to carry with you at all times. 

    We did some digging and found excellent items you should consider adding to your Coronavirus survival kit. One thing to keep in mind — we did not add any medicine as that’s up to you and your doctor.

    Keep reading to find out how to stay safe!

    Top 5 Coronavirus Survival Kits

    Face mask

    Because the virus is airborne, it’s paramount we all have good face masks. There are tons of disposable and reusable options, but we recommend sticking to CDC guidelines and advice when choosing masks for your COVID survival kit.

    Reusable Face Mask

    Reusable Face Mask

    Price from $27.89

    Pros

    • Comfortable
    • Ethically made
    • No fogging
    • Different sizes

    Cons

    • Long delivery time

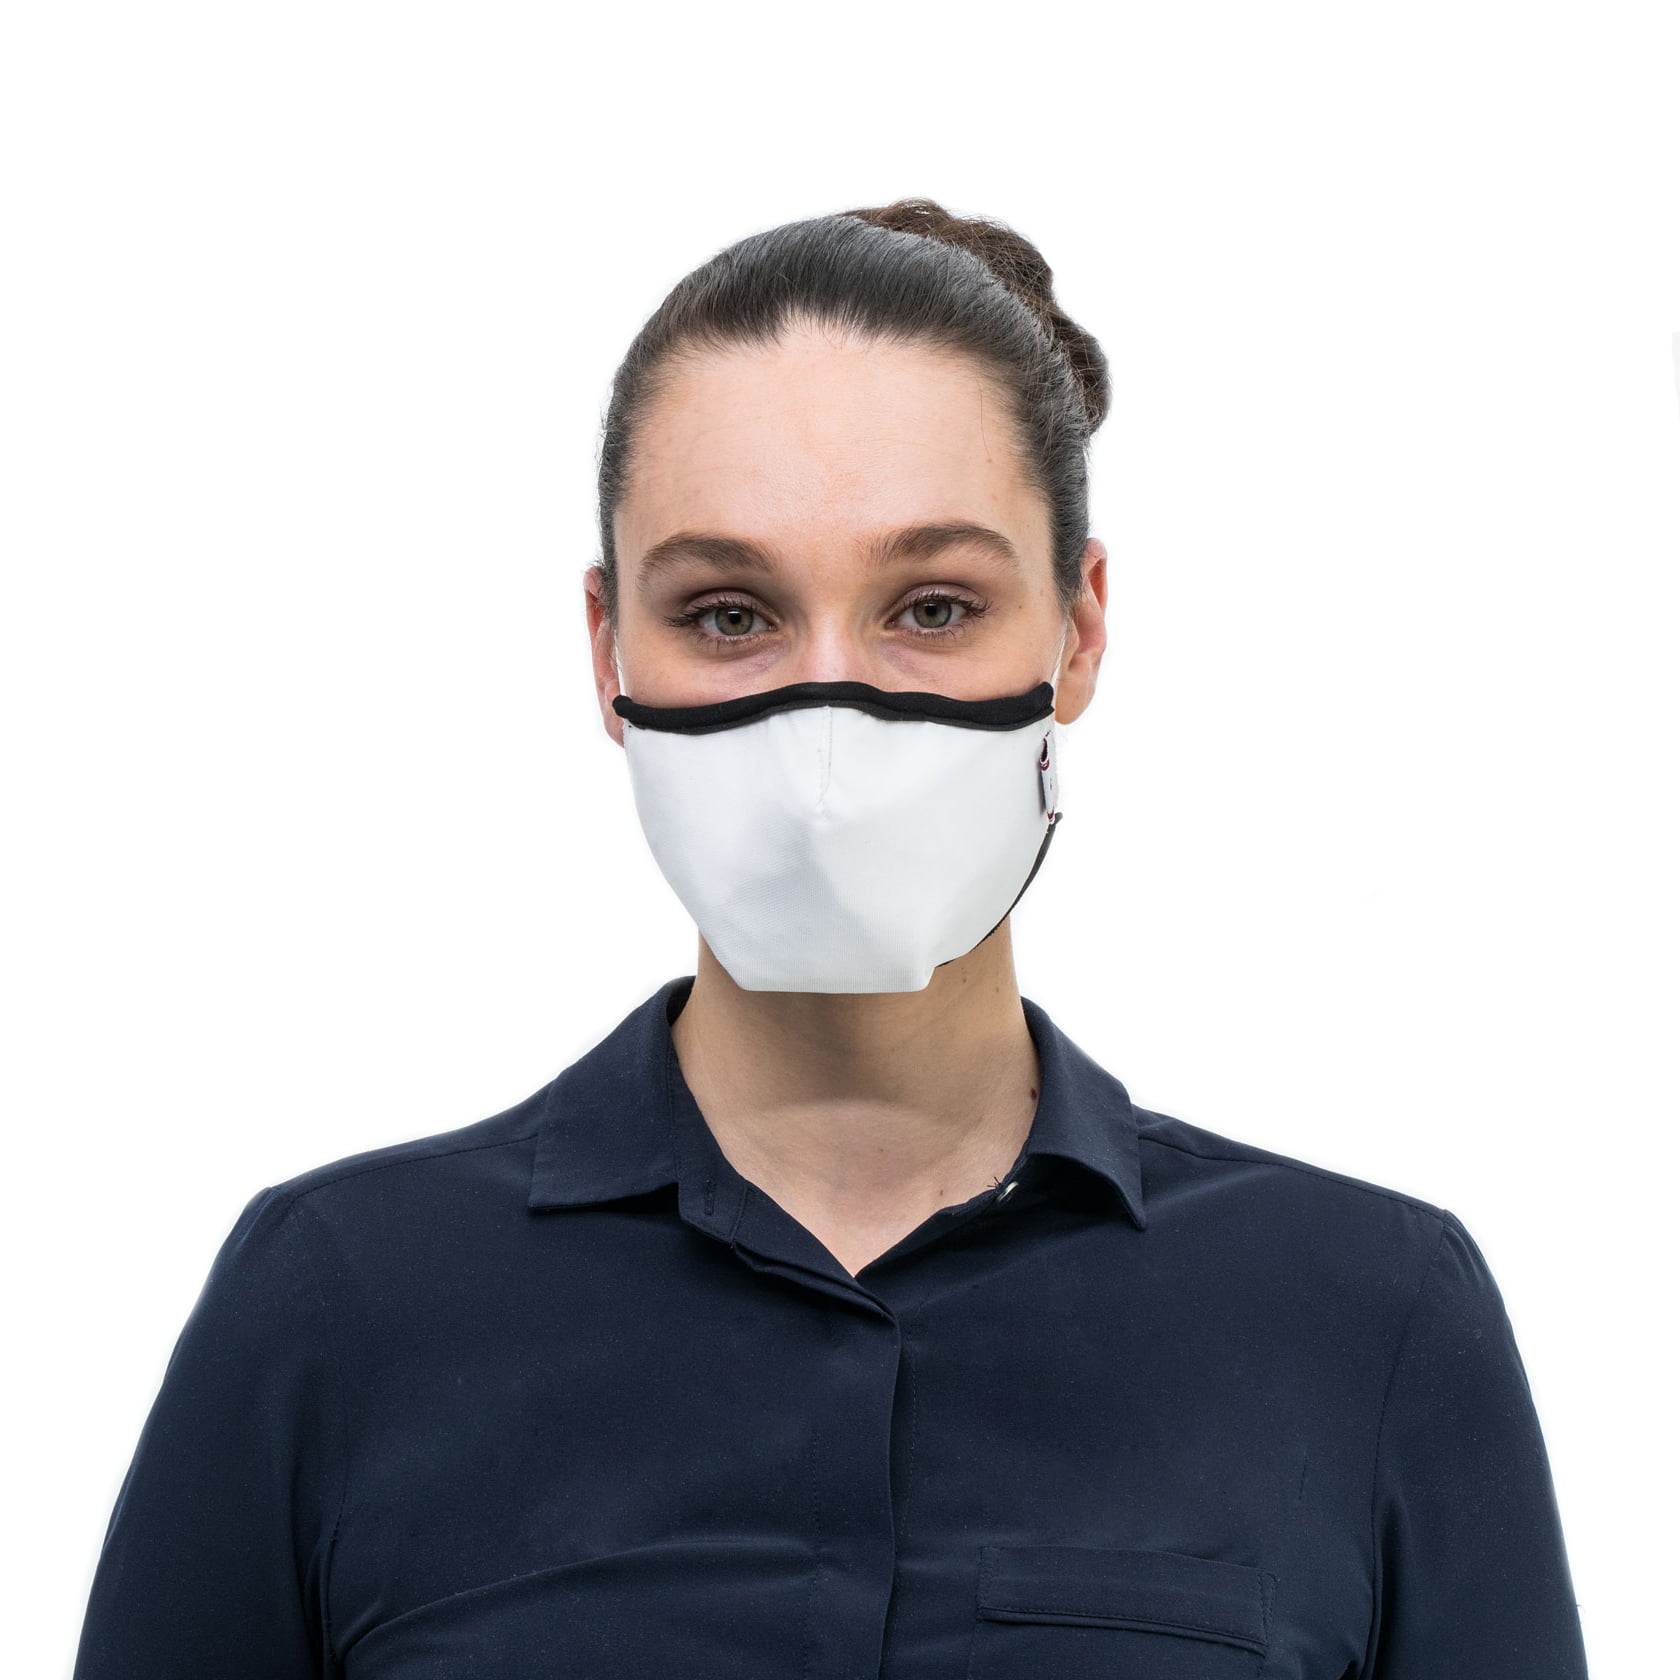
    Ethically designed and manufactured in Canada, these masks provide incredible comfort, excellent breathability, and highly efficient filtering. They’re available in smaller sizes, including for children. 

    The 3D design, with strategically placed flaps, prevents the mask from obstructing your mouth while you speak or breathe. In addition, the unique cushioning on the nose, chin, and cheeks makes them a perfect addition to your family’s COVID essentials kit.

    It has an adjustable nose bridge and elastic ear loops. Moreover, the ëTECH is also an excellent option for people with glasses as it doesn’t fog up. If you’re going to wear your mask for a whole day or in a hot environment, then this feature is of extra importance. 

    This mask follows the ASTM International Standards for workplaces, so you can add it to your back-to-work survival kit for COVID.

    The manufacturer made sure that none of the four layers —  including the outer polyester and inner polypropylene — were not chemically treated. Therefore, these masks are safe for you and for the planet, too. 

    This model comes in different colors, designs, and three available sizes. Furthermore, you can purchase an optional headband or adjustment cord to enhance comfort or enable touchless removal. 

    Mesh laundry bags and canvas bags are also available. Washable storage for your masks is super convenient for every Coronavirus survival kit.

    As the prices decrease with the increasing quantity, you can make a high-volume order, and the company ships across North America. However, delivery time can be longer, up to six weeks, if the item isn’t in stock.

    Frëtt Solution ëTECH mask has three life cycles. First, it serves as a workplace mask, holding shape and keeping efficiency even after 100+ washes. After that, it can be a personal mask. And finally, you can place it into a Zero Waste box so it can get recycled and become part of someone else’s Coronavirus kit.

    Disposable Face Mask

    Disposable Face Mask

    Price from $29.95

    Pros

    • 30 disposable masks
    • N95 quality
    • Reusable mask brace

    Cons

    • Not refundable

    If you don’t like reusable masks or can’t find one that will fit you as snug as you’d like, then this Armbrust the Better Mask High Filtration System is a perfect match for you. 

    Not only do you get 30 disposable masks, but you also get an FTM Essential mask brace for a more secure fit. The mask brace is reusable, so you can use it with other surgical masks you have in your pandemic survival kit to improve their fit and provide a better seal around your face.

    The mask brace has a patent-pending nose cushion design that adjusts to any face shape by applying light pressure across your cheeks, not on your nose. Plus, it comes in three sizes — S, M, L.

    The masks are made of the same material as regular N95 masks and have a particle filtration rate of 98%. As N95 models are always in high demand and can be hard to find, this fantastic mask system can be an excellent alternative for your Coronavirus emergency supply list.

    The Armbrust system complies with F3502 and NIOSH’s new Workplace Performance Plus standards, and the masks are FDA-approved. Everything is made in the US and doesn’t rely on a global supply chain, but it doesn’t offer refunds or exchanges.

    Thermometer

    Thermometer

    Price from $31.19

    Pros

    • Color-coded background
    • Features silent mode
    • Placement sensor
    • Three-year warranty

    Cons

    • No memory for previous readings
    • High price

    The virus is spread through bodily fluids, so it’s best you get a no-touch or forehead thermometer to avoid having to sanitize it in between uses. 

    Our recommendation for a forehead thermometer for your Coronavirus preparedness kit is Braun’s digital no-touch forehead thermometer. It utilizes patented technology that captures two times more body heat than other thermometers, leading to fast and accurate results. 

    Every parent will love this thermometer, especially its silent mode. This feature is particularly useful when you need to take a sleeping baby’s temperature. Additionally, pediatricians highly recommend this model.

    Also, you don’t need to turn the lights on and risk waking up your kid — the LED display is readable in complete darkness. So if you’re building a COVID survival kit gift suitable for parents, this thermometer is a must.

    This model is relatively straightforward to use, providing readings in Fahrenheit or Celsius. The instructions are printed on the box and are easy to follow. 

    To start, remove the protective cap and press the power button to turn it on. After that, place it directly on the forehead or hold it up to two inches away. With this item in your COVID-19 home care kit, you’ll be able to get an accurate reading in less than two seconds. 

    A positioning sensor casts a beam of light on your forehead, so you know the right point for taking temperature. The digital display will show an error if the positioning isn’t proper and indicate if you need to bring the device closer.

    The thermometer displays the reading in different background colors — green for normal, yellow for a slightly higher temperature, and red for a severe fever. That can help you get by even if your eyesight isn’t the best.

    It’s a great addition to the emergency kit for the pandemic, even for the elderly and those with not-so-good vision. What’s more, it beeps ten times if the temperature is over 99.4°F.

    When the battery is at 20%, a flashing battery symbol will notify you. The device comes with two AA batteries and a three-year warranty.

    Keep this in mind, this thermometer doesn’t store previous readings, and it’s a bit pricey. Nevertheless, we’re sure you won’t regret including it in your COVID-19 emergency home care kit.

    Pulse Oximeter

    Pulse Oximeter

    Price from $186.00

    Pros

    • Fast and accurate readings
    • Works for kids and adults
    • Suitable for patients with darker skin
    • Long battery life
    • Four-year warranty

    Cons

    • High price

    A pulse oximeter is a small device that attaches to your finger or your earlobe and measures the oxygen level in your blood painlessly and quickly. Although it cannot detect COVID-19, it is commonly found in Coronavirus preparedness supplies as it can identify low blood oxygen levels early. 

    However, to adequately assess your health, you’ll need to know your blood oxygen baseline level. If you don’t have other symptoms, you should seek medical treatment if the reading falls below 92% or 90%.

    You can receive a pulse oximeter from your doctor or buy one over the counter. OTC oximeters haven’t been FDA-approved because they’re considered wellness or sporting and aviation equipment rather than medical devices.

    American-made Nonin Onyx Vantage 9590 pulse oximeter is an excellent addition to any Coronavirus prep kit. It’s FDA-approved, and it works fast and accurately on adults and children, as well as those with more skin pigmentation or low perfusion. Even if you have nail polish on your nails, it works great.

    It’s powered by two AAA batteries, which will get you up to 6,000 spot checks. The device turns on and shuts off automatically when put on or removed. It has an LED screen you can read from any angle, day or night. 

    Although this pulse oximeter is among the priciest items in our Coronavirus emergency kit, we consider it worth every penny. Rugged construction allows this little device to survive at least 50 drops. 

    A CD with instructions, batteries, a lanyard, and a carrying case are included in the purchase. Turner Medical offers free shipping, and Nonin provides a four-year warranty.

    Gloves

    Gloves

    Price from $19.99

    Pros

    • Latex-free
    • Ambidextrous
    • Durable

    Cons

    • Hard to find in your local stores

    Gloves are a must in a Coronavirus safety kit, as we all know by now. In general, you can go for any disposable gloves from any brand, as long as they fit you and you use them correctly and toss them afterward. 

    Our choice is a pack of 100 disposable Venom Nitrile gloves. Nitrile rubber is powder and latex-free, which is excellent as many people are allergic to latex. 

    Not only are these an essential part of every emergency kit for Coronavirus, but you can also wear them if you have skin conditions, use them in your home or work when cleaning, painting, or handling various chemicals. 

    Mind you, although these are advertised as chemical-resistant, no gloves can give an absolute guarantee. That said, this model is very thick and durable and won’t break easily when exposed to household chemicals and cleaning products. 

    They will handle alcohol and any products from your Coronavirus emergency pack for home sanitization.

    If you’re using the gloves to clean or work around your home, you can reuse them if they’re still intact. You can get Venom gloves in different sizes from your local stores or Amazon. Another benefit is that these gloves are ambidextrous and fully textured for an excellent grip.

    Sanitization Supplies

    Surface Disinfectant

    Sanitization Supplies

    Price from $6.39

    Pros

    • Environment-friendly
    • Non-toxic
    • Effective against COVID-19 and many other viruses

    Cons

    • One bottle can be insufficient

    Envirocleanse-A is an EPA-registered multi-purpose disinfectant for use against COVID-19 on hard surfaces in residential and commercial areas. Not only is it just what you need to survive a pandemic, but it’s also effective against Norovirus, Clostridioides difficile, Listeria, Salmonella, MRSA, and kills odors. 

    The active ingredient is Hypochlorous acid, which is non-toxic, non-corrosive, and non-flammable. The environment-friendly formula is safe to use around kids and pets, and there’s no need for PPE or rinsing. Furthermore, Envirocleanse-A offers a 12-pack.

    Hand Sanitizer

    Planet_Halo_Sanitizer_1Gallon

    Price from $14.95

    Pros

    • FDA-approved
    • Kills 99.9% of viruses, bacteria, germs
    • Doubles as a surface disinfectant
    • Moisturizing formula

    Cons

    • You can’t always get a refund

    A gallon bottle of Planet Halo hand sanitizer should be another staple in Coronavirus emergency supplies. It’s 80% Ethyl alcohol that kills 99.9% of viruses, bacteria, and germs. The formula is FDA-approved and consistent with WHO recommendations. 

    This hand sanitizer is free of fragrance, paraben, triclosan, dye, and preservatives and contains glycerin that moisturizes your skin. It can double as a surface disinfectant, you just need an empty spray bottle.

    The seller offers free shipping and only accepts returns of defective products.

    Antibacterial Wipes

    Antibacterial Wipes

    Price from $19.99

    Pros

    • Cleans 99.9% of all viruses and bacteria
    • Convenient packaging
    • Multi-surface

    Cons

    • Slightly unpleasant smell

    When thinking about how to fight COVID-19 at home, we can’t skip disinfecting wipes. Lysol has a long tradition of doing top-notch cleaning and disinfecting supplies, and they rarely disappoint. 

    These wipes are EPA-tested and proven to eliminate the COVID-19 virus in 15 seconds on hard, non-porous surfaces. They kill 99.9% of bacteria, viruses (Salmonella, Herpes Simplex Type 1, and others), and 95% of allergens. Furthermore, they’re available with three different scents.

    You can come up with practical COVID care package ideas for your loved ones and include a box of these wipes, as Amazon sells packs of six.

    How to Choose a Proper Mask? 

    CDC and WHO recommend that you pay attention to the following when shopping for a mask: 

    Level of Protection

    This feature signifies a mask’s ability to filter harmful airborne particles. There are three levels of protection: 

    • Level 1 — a low barrier that doesn’t protect from sprays, fluids, or aerosols 
    • Level 2 — medium protection from liquids, sprays, and aerosols 
    • Level 3 — maximum barrier protection

    You should look for ASTM-certified disposable masks for your Coronavirus survival kit.  

    Respiratory Protective Equipment Types

    To be able to find the perfect mask, you should know what options to choose from. So, let’s go through the most common types.

    Surgical Masks

    These masks are intended for single use in a medical environment, and they protect against large particles of droplets, splashes, sprays, germ splatters. In addition, they can help shield others from your spit and saliva. 

    However, they are not designed to provide a super-snug fit and are not optimal for virus protection. So, if possible, you should avoid putting these on your Coronavirus survival kit list.

    N95 Respirator 

    This type of disposable mask offers better protection from COVID-19 than surgical masks. It forms a seal around your nose and mouth and prevents the transfer of body fluids, viruses, bacteria, and microorganisms.

    N95 respirators are NIOSH-regulated and commonly used in industrial jobs and health care. 

    Unfortunately, these don’t fit children and may not suit people with facial hair properly. Also, if you suffer from medical conditions that make your breathing difficult, ask your doctor before getting an N95.

    KN95 Masks

    As N95 respirators can be hard to find, your Coronavirus survival kit can benefit from adding KN95 masks. 

    Manufactured in accordance with foreign manufacturing standards, these masks are similar in quality to the previous type and provide equivalent levels of protection. You can use a single KN95 mask up to three times, airing it out in between uses. 

    Reusable (Fabric) Masks

    Reusable masks are non-medical, meaning they don’t provide as much filtration as N95 respirators. That, however, doesn’t mean you can’t use them, as they will indeed protect you from COVID-19 and are environmentally friendly.

    We consider that a high-quality, ethically-made reusable mask is a great item to include in your COVID feel better kit.

    The best thing about these is that you can wear them for some time, wash them, and repeat. Many prefer using this sort of protection as it’s more environmentally friendly. 

    WHO recommends using fabric masks to the general public under 60 years old if they don’t have any underlying health conditions.

    How to Know If a Reusable Mask Is Good? 

    A good reusable mask is one of the essential items in the Coronavirus survival kit. However, it can be challenging to pick the best model for your needs among the multiple options. 

    Reusable masks should have at least two layers of breathable fabric. According to WHO, the innermost layer should be from absorbent material (e.g., cotton), while the middle and outer layers should be non-absorbent (e.g., polypropylene).

    A perfect reusable mask for your Coronavirus emergency list should not leave the space around your nose and mouth uncovered or be ill-fitting. Furthermore, it’s best if it features a nose wire or some other fit-enhancing feature.

    You can test how good a reusable mask is against a candle flame. To do that, hold it in front of your eyes — if you can’t see the light through it, then it’s suitable.

    Another candle test is when you try to blow out the candle through the mask. Again, if you can’t, that’s a good sign, and the mask can be put on your Coronavirus survival list.

    When to Double-Mask? 

    CDC recommends double-masking only if you’re putting a surgical mask first.

    Additional Tips

    • Get a mask brace to improve the fit if you have facial hair;
    • Don’t use N95 with an exhaust valve if sterile conditions are required;
    • Don’t get masks with exhaust valves, so you don’t spread the virus if you are sick; 
    • Children should wear masks that are made for them, so the best fit is achieved.

    People Also Ask

    The best option to test for a COVID infection is PCR (Polymerase Chain Reaction). It’s a molecular technology amplifying the RNA (ribonucleic acid) of the virus. 

    A fluid sample from the nasopharyngeal area is most commonly taken, even though any bodily fluid will do. A long cotton swab is inserted into the patient’s nostril, swirled for ten seconds, and sent to a special lab.

    This particular sample might be the most reliable since the area where the sinuses meet your throat contains the highest volume of the virus. Due to the complexities of the chemical reaction, PCR results come out in one to two days.

    Any soap you have in your house will do the trick. The chemical reaction that happens when soap comes in contact with the COVID-19 molecule can be explained simply. The soap dissolves the lipid (fat) coat on the molecule, thus destroying the virus.

    So you can keep on using the brand you like and have without any worries about its efficiency.

    Coronavirus can’t be transmitted through food or food packaging. However, you should keep a distance from other shoppers and avoid touching your face or eyes after handling different items in the store, especially carts, trolleys, and baskets. 

    Use hand sanitizers whenever possible, as many stores offer those upon the entrance. Also, don’t forget to wash your hands when you get home and after you’ve unpacked the items you’ve purchased.

    Because the Coronavirus is transmitted through cough or sneeze droplets, the immediate area around an infected person could be a source of contact transmission. Research shows that the virus survival time varies depending on the surface and other factors. 

    While it can survive up to 72 hours on stainless steel, but it lives only up to four hours on copper surfaces. It’s important to note that this research is conducted under controlled lab conditions, so the results may vary in the real-life environment. You can kill the virus within a minute using rubbing alcohol or sodium hypochlorite — essential items in your Coronavirus survival kit.

  • 30 Gruesome Seat Belt Statistics to Make you Buckle Up

    30 Gruesome Seat Belt Statistics to Make you Buckle Up

    Seat belt statistics clearly show that wearing a seat belt saves lives. Luckily, the rate of seat belt usage grew in the last 15 years. A rough estimate is that 17,452 people died from not buckling up, and if they had, most of them would’ve lived. 

    These are just some numbers that point to the importance of seat belts and many other statistics that show how important it is to use them. 

    If you’re a driver who ignores the seat belt, read these facts and stats below. They can literally save your life, even while you’re using Uber or Lyft. 

    Seat Belt Safety Statistics and Numbers (Editor’s Choice) 

    • The first iteration of the three-point seat belt occurred in 1955
    • In 2019, victims 15–20 didn’t wear a seatbelt in over 45% of US motor vehicle fatalities 
    • Car crashes are a leading cause of death for people under 25
    • Georgia is the state with the highest seat belt usage — 97.10% 
    • Seat belt can reduce moderate to critical injuries by 50%
    • People can name around 15 reasons why they don’t use a seatbelt
    • Every year, three million Americans experience seatbelt failure injuries
    • Nearly 2,500 US teenagers lost their lives on the road

    Seat Belt Facts

    Seat belts were primarily used by pilots in gliders, but people quickly realized how essential they could be to saving lives. Those who patented them actually went so far that they gave them to the world for free. 

    1. The first form of seat belt was invented back in the 1800s

    (Americanfivestartransmission)

    These seat belts were far from what people use today in their cars. George Cayley was the first man to consider making pilots safe in their gliders by introducing some type of seat belt. However, in 1855, Edward J. Claghorn patented his kind. Those were used in New York cabs to keep passengers safe. But, according to the seat belt article, they weren’t widely used until the US emergency physicians started testing out their efficacy in the 1930s. 

    2. The first iteration of the three-point seat belt took place in 1955

    (Gomechanic)

    In 1955, two Americans, Roger W Griswold and Hugh DeHaven had the idea to create the three-point seat belt, which reminds us of the seat belt we know today that can protect the torso. 

    3. Seat belt that we know today was introduced in 1959

    (Americanfivestartransmission)

    1959 was the year when Swedish inventor Nils Bohlin improved the existing design of the three-point seat belt. Today, this invention is in every car and, if used properly, can save lives. Another thing Nils did was to give the seat belt to the world for free. Even though he could have earned millions, he realized the importance of seatbelts and decided that lives are more important than money.

    4. Seat belts became mandatory in America in 1966

    (Americanfivestartransmission Gomechanic)

    American car manufacturers offered seat belts as an accessory until 1966. They could be purchased in gas stations. Australia was also among the first countries to make seat belts compulsory in 1970. Other countries followed suit. Still, people weren’t obligated to wear them, according to seat belts facts.

    5. New York required people to wear a seat belt in 1984

    (Americanfivestartransmission)

    It took a lot of time for drivers to realize the importance of seat belts. New York was the first state to require passengers to use them in 1984. By 1995, every state besides New Hampshire had the “Click It or Ticket” laws. 

    6. The rate of seat belt usage grew from 81.7% to 90.7% in the last 15 years

    (NCSL)

    It’s estimated that 90.7% of US adult front-seat passengers used a seat belt in 2019. This represents a slight increase in seat belt use. There’s also a slight difference in seat belt use among rural and urban areas. 90.8% of urban passengers used seat belts compared to 90.4% of rural vehicle occupants, according to seat belts statistics.

    7. FMVSS 209 outlines the testing requirements for seat belts

    (Gwrco)

    Federal motor vehicle safety standard was the first standard to become effective on March 1, 1967, which specified the seat belt testing requirements and more. In 1973, NHTSA made amendments to the FMVSS 209 and issued a regulation for occupant crash protection. A crash test became one of the requirements. 

    To briefly answer how seat belts are tested—the dummy is strapped in the car that’s moving, only to hit an obstacle. This tests out how the vehicle and the passengers would react upon collision. 

    8. Car crashes are a leading cause of death for people younger than 25

    (NCSL)

    Around 37,000 Americans die in car crashes each year, and these accidents are a leading cause of death for those younger than 25. 

    9. All 50 States and the District of Columbia have some form of child safety law regarding seat belts

    (NCSL)

    NHTSA recommends that state child passenger laws include kids up to 16 years of age and cover all seating positions. In 2019, 15 states strengthened child safety laws when it comes to height, weight, and age. 

    10. Georgia has the highest seat belt usage of 97.10% 

    (I-lawsuit)

    According to the most recent data and seat belts safety facts, Georgia has the highest seat belt usage rate of 97.0%. Hawaii has the second-highest rate of 96.90%, and Oregon is the third with 96.80%. 

    11. People have about 15 reasons why they don’t use a seat belt

    (Zerodeathsmd)

    Some claim to be in a hurry, others forget, and many say they were driving a short distance. In addition, passengers complain that seat belts are uncomfortable, or that they have a medical condition. Other arguments against seat belts include the need to exit the vehicle quickly or the fear of being stuck in an accident. Good reflexes, bigger vehicles, and airbags are also poor excuses for not using a seat belt while driving. 

    12. New Hampshire has the lowest seat belt usage rate of 67.60%

    (I-lawsuit)

    Massachusetts and South Dakota are right after New Hampshire, with 73.70% and 74.80%, respectively. 

    How Effective Are Seat Belts?

    Many doubt the effectiveness of seat belts, but the sentiment is changing for the better. The data show seat belts reduce the risk of severe injuries by 50% and cut the risk of death by 45% for front-seat occupants. 

    13. Motor vehicles are the leading cause of death for children aged two to 14

    (NCSL)

    When it comes to children, 14 years and younger, over 1,000 die in motor vehicle accidents each year. Over one-third of the children who died were unrestrained. NHTSA is continuously researching how many lives are saved by seat belts each year. According to its studies, when a seat belt is used properly on a child, it can reduce fatal injuries for over 70% in infants and 54% in toddlers. 

    14. 17,452 people died because not wearing a seatbelt 

    (Thezebra)

    The last available data show that out of 37,133 people who died in car accidents, 17,452 didn’t wear a seat belt. This is a mortality rate of about 47%, and seat belt statistics point out how serious people should be about using it. 

    15. Seat belt can minimize moderate to critical injuries by 50%

    (NHTSA)

    Not only does wearing a seatbelt prevent vehicle occupants from flying out of a car, but it also prevents moderate to critical injuries by 50%. To be effective, passengers must use it properly, not just place the upper strap under the arm or have children who are not tall enough use it on their own. 

    Seat Belt Safety Stats

    Nobody wants to risk being ejected from a car in an accident. This is why seat belts are mandatory, and drivers or passengers shouldn’t have an excuse not to use them. This is especially important for teens since 50% died because they didn’t buckle up. 

    16. Passengers who don’t buckle up are 30x more likely to be ejected from a vehicle

    (Teendriversource)

    Based on the seat belt safety statistics, those who don’t use it while in the moving vehicle have 30x more chances to be ejected upon collision. More than three out of four people who are ejected die from injuries. 

    17. In 2019, 46% of motor vehicle crash victims aged 15–20 didn’t wear a seatbelt in the US, as per seat belt death statistics.

    (Teen Driver Source)

    That year, around 1,603 young people between the ages of 15 and 20 died in such crashes in the United States. Moreover, four in ten high school students in the US reported not always using a seatbealt in the last 30 days in 2019. 

    18. Almost 2,500 teens in the US were killed on roads

    (CDC)

    2,500 teens aged 13 to 19 died on roads across the US. In addition, about 285,000 were treated in the ER for injuries in car crashes. This means that at least seven teenagers die each day, and several hundred suffer injuries. Teens aged 16 to 19 are also at the highest risk of a car crash than any other age group, based on the last available seat belt crash statistics. 

    19. Male drivers aged 16-19 have a 2x higher death rate than female drivers

    (CDC)

    Male teenage drivers seem to participate in more car accidents and have a higher death rate than their female peers. Driving with other teens also increases the risk of a car crash. Friday, Saturday, and Sunday are also the days when more than 50% of accidents happened, the latest available seat belt death statistics show. 

    20. Parents should provide 50 to 60 hours of driving with supervision

    (CDC)

    Car crashes are preventable, and parents have a huge role in teaching their children how to behave on the road. According to traffic experts, parents should provide about 50 hours of supervised driving practice. In addition, they should take their teen across a variety of roads and discuss and teach them about potential hazards. 

    If a child asks why it is important to wear a seatbelt, parents should be ready to answer with facts and numbers to teach their teens how important seat belts are. 

    21. Cumulative lives saved by seat belts are 374,276

    (Injuryfacts)

    This is the total number of all lives saved from 1975 until today. The trend of seat belt use is increasing, while the trend of unrestrained victims of traffic accidents is decreasing. This shows that more vehicle occupants are aware of the statistics about seat belt safety and the importance of wearing one. 

    22. Seat belt failure causes injuries in 3 million US residents each year

    (Peakefowler)

    Even though seat belts are installed for protection, sometimes they can fail. About 3 million Americans suffer injuries because of a faulty seat belt. Unfortunately, 40,000 vehicle occupants die as well. Seat belt failure is the primary factor contributing to severe injuries, according to the latest data about car crashes without seatbelts. 

    23. General Motors recalls almost 840,000 vehicles in the US because of a suspension and seat belt problem

    (News4jax)

    GM stated the seat belt brackets weren’t secured to the seat frame. This could’ve caused severe injuries, failing to restrain people in car accidents. In addition, the seat belt recall included Chevrolets and GMCs, while pickups with bucket seats weren’t affected, according to the seat belt failure statistics.

    24. November 14 is the National Seat Belt Day

    (Wtov9)

    National Seat Belt Day is used to promote seat belt usage. It’s a great way to teach vehicle passengers about the importance of using seat belts. Even though most drivers and passengers realize why it’s important to buckle up, some refuse to do so. It’s a fact that a seat belt saves lives, and statistics clearly show that most of the sustained injuries in a car crash wouldn’t have happened if passengers had worn a seatbelt.

    25. 28% of people who use rideshare vehicles admitted not using seat belts 

    (Thenewswheel)

    According to the latest survey done on 1,000 Americans, 28% admitted that they don’t buckle up while riding in Uber or Lyft. However, nine out of 10 US residents use a seat belt in their own car, seat belt usage statistics show. This makes rideshare less safe than advertised. 

    26. Rideshares might be responsible for 3% increase in fatal traffic accidents

    (Thenewswheel Chicagoboot)

    The fact that many Americans believe that the backseat of their Uber is so safe they don’t need a seat belt caused a 3% increase of fatal car accidents with rideshares. Before rideshares became accessible, the trend was going downwards. However, there was a break in the downward trend in 2010, right around the time when rideshares appeared. 

    Seat belt deaths statistics point out that the 3% increase in auto deaths meant 987 lives lost each year across various age groups. The rideshare fatalities also cost more than $9 billion. Passengers aged 45 to 54 and those aged 18 to 24 were least likely to buckle up. The safest age groups were people aged 25 to 34 and 35 to 44. 

    27. Fines for no seat belt range from $10 to over $162

    (Cashcarsbuyer Etags)

    According to seat belt use statistics, some drivers still don’t use their seat belts even with Click It or Ticket enforcement. If they’re caught, there’s no doubt they’ll have to pay a fine, which may also affect their insurance. However, each state is different, and so are the costs of the fines. In Wisconsin, for front and rear seats, the fine is $10, but in California, it goes up to $162. 

    Seat Belt Injury Statistics

    One of the common excuses drivers use when they don’t buckle up is the belief that seat belts will prevent them from leaving a burning car or cause injuries. While the seat belt syndrome is severe, there’s nothing worse than flying through the windshield. 

    28. Seat belts cause ruptured aorta in 37% of cases 

    (Millerandzois)

    Many seat belt injuries have delayed symptoms, and early treatment is necessary to alleviate all consequences of a car crash. For example, ruptured aorta happens in 37% of cases; Bilateral lung contusion in 31.1%, ruptures of the heart in 28.4%, and lung lacerations in 15.5% of cases. These injuries are usually caused by high-speed accidents, according to seat belt injuries statistics. 

    29. Children should be at least 4’9’’ tall to avoid the seat belt syndrome

    (Saferide4kids)

    Fitting a seat belt properly to children means minimizing the seat belt syndrome or being thrown out of the car in case of an accident. Seat belt syndrome is a term that includes specific injuries related to the use of seat belts. The injuries most commonly happen in the abdomen area and can be severe, based on the seat belt accident statistics.

    30. Unrestrained rear site passengers are 8x more likely to sustain a severe injury

    (IIHS)

    Seat belts are saving lives regardless of the seating position. For example, passengers in the back seats who don’t buckle up have an 8x higher chance of sustaining a severe injury upon collision. 

    Conclusion 

    Seat belts are designed to keep people in place upon collision and thus reduce injuries. People who use it significantly reduce the risk of coming in contact with the vehicle interior or being ejected through the windshield. These seat belt statistics point out how important it is for everyone in the car to use them properly. 

    People spent decades testing out the effects of seat belts, and the idea that it will keep a user strapped in after an accident is unacceptable as an excuse. Seat belts are the number one safety measure in vehicles, and they are irreplaceable. 

    People Also Ask

    Who invented seat belts?

    Back in the 1800s, George Cayley considered making pilots safe in their gliders by introducing a type of seat belt. In 1855, Edward J. Claghorn patented his kind of seat belt used in the New York taxis to keep passengers safe. The first iteration of the three-point seat belt happened in 1955 when the two Americans, Roger W Griswold and Hugh DeHaven, had the idea to create the three-point seat belt. Nils Bohlin improved this design, and those are the seat belts we know and use today. 

    What year did cars require seat belts?

    American car manufacturers offered seat belts as an accessory until 1966, but the US made them mandatory after that. However, people still weren’t forced to use them at all times. It was in 1984 that New York started requiring all passengers to buckle up. By 1995, every state besides New Hampshire had the Click It or Ticket laws, and those who didn’t buckle up were issued fines. 

    Why should we wear safety seat belts in a car?

    The total number of all lives saved by seat belts from 1975 until today is 374,276. Unfortunately, those who don’t use them while in a moving vehicle have 30x more chances of being ejected upon collision. This is more than three out of four people dying because of injuries. Seat belts are saving lives regardless of the seat they’re using. Passengers in the back seats who don’t buckle up have an 8x higher chance of sustaining a severe injury upon collision. 

    What percentage of lives are saved by seat belts?

    It’s estimated that 90.7% of adult US front-seat passengers used a seat belt in 2019. This represents a slight increase in seat belt use, meaning more lives were saved. In addition, many Americans have become aware of the positive sides of wearing a seatbelt and are using it properly. As a result, in the US, approximately 15,000 lives are saved annually just by using a seat belt in vehicles. 

    How many deaths do seat belts cause?

    Seat belts don’t cause death—they help prevent it. One of the excuses for not wearing a seat belt is a belief that they’ll trap a car occupant in place while the vehicle is burning or sinking. While these accidents do happen, the numbers are almost insignificant, compared to the number of saved lives, both in adults and children. Drivers can always purchase a seat belt cutter and hang it with the car keys if they fear that seat belts will malfunction. 

    What percentage of drivers killed in car collisions were not wearing seat belts?

    More than 1,000 14-year-olds and younger die in motor vehicle accidents each year. Over one-third of the children who died were unrestrained. If a seat belt is used properly on a child, it can reduce fatal injuries for over 70% in infants and 54% in toddlers. However, 17,452 adults died from not wearing a seat belt, according to the latest available information. This is a mortality rate of about 47%, which is high, considering that all cars now have seat belts. 

    Are lap seat belts legal?

    Whether someone can use a lap belt depends on the car manual. The three-point seat belt should be used by adults and children of a proper height, and it’s made of the lap and the shoulder belt strap. Booster seats are for babies and younger children, and their manual explains they should be used with a lap and shoulder belt. Lap belts are also used in aircraft seats. 

    How does a seatbelt prevent injury?

    When a vehicle moves and abruptly stops, the kinetic energy suddenly gets transferred to the passengers. The instant deceleration of the car makes the bodies of the people inside want to move. Seat belts prevent movement and save the passengers from hitting the insides of the car or being ejected from it. When car occupants stay in place, their injuries are minimized. 

    What happens to a seatbelt after an accident?

    If a seat belt worked properly during the seconds of the accident, it would have to be replaced or recalibrated. After the accident, the mechanism that helps keep passengers in place will stop working. The retractor mechanism needs to deploy at the right moment, at all times. If a car goes through an accident, mechanics will do a diagnostic and read the codes that show what needs to be repaired, according to seat belt statistics.

  • 20+ Eye-Opening College Campus Safety Statistics to Learn

    20+ Eye-Opening College Campus Safety Statistics to Learn

    Getting into college is a cheerful occasion, but college campus safety statistics are something to keep in mind. Often, many young adults feel that leaving home gives them more freedom to behave however they want, which can cause many issues. 

    While burglaries are the most common problem among students, alcoholism, sexual assaults, scams, drug abuse, campus shootings, and cyberbullying are also common occurrences. 

    With the arrival of COVID-19, many students also worry about their health. They want to remain safe once they’re back on college grounds. Yet, most of them fear their peers might not follow the safety guidelines. 

    College Campus Crime Statistics (Editor’s Choice)

    • Over 50% of college students consumed alcohol in the previous month 
    • The cost of illegal Adderall is $5–$7 per pill
    • Over 75% of hate crime in college derives from religion, race, or sexual orientation
    • 13% of all students face rape or sexual assault
    • 22 out of 1,000 students are affected by property crime 
    • Over 85% of campus law enforcement officials are authorized to make an arrest
    • People aged 18–24 are three times more likely to face a student scam
    • Students can buy a safe for their valuables for a minimum of $120

    Campus Safety and Security 

    Crime is common on college campuses, but other things can endanger students’ life as well. With the rise of Coronavirus cases, students have one more thing to worry about besides burglaries and alcohol abuse. 

    1. 1 in 3 students don’t feel safe going back to campus because of COVID-19

    (Prnewswire)

    Coronavirus has affected the entire world, and many institutions were closed during the lockdown. Once the lockdown was over, and people started getting back into the routine, students were expected to come back to classes. However, according to the most recent campus safety and security survey, one in three don’t feel safe enough.

    2. 78% of students believe the health facility in their college can’t provide enough care

    (Prnewswire)

    With the Coronavirus still roaming around, these fears are entirely justified. Also, researches show that at least 11% of students were misdiagnosed in the past. This increases the students’ doubts about college health care facilities.

    3. 34% of students believe their peers won’t hold proper distance

    (Prnewswire)

    According to the recent campus safety statistics, 34% of students worry their classmates won’t follow the guidelines for social distancing. In addition, female students trust others less than their male peers. 

    4. 53% of college students consumed alcohol in the previous month 

    (NIAAA)

    Regardless of the pandemic, alcohol became a serious issue among college students. Peer influence, accessibility, and pressure caused 53% of students to consume alcohol in the past 30 days. According to United States college statistics, 33% of students also binged alcohol during the same timeframe. 

    5. 1,519 college students aged 18 to 24 die from alcohol-related injuries

    (NIAAA)

    Consuming alcohol in college can lead to severe consequences. 1,519 college students aged 18 to 24 die from alcohol-related injuries that mostly include vehicle crashes. Other consequences include suicides and suicide attempts, injuries, or vandalism, making alcohol one of the most essential college campus safety issues to tackle. 

    6. Young adults aged 18 to 24 are 3x more likely to be victims of a student scam

    (Whnt)

    Students and their parents often fall victims to scams. According to the most recent data, young adults aged 18 to 24 are most likely to end up being scammed. Most common college-related scams include fake credit cards, rental scams, scholarship and grant scams, and employment scams. Unfortunately, college campus safety statistics show that 41.6% of students reported losing money after being scammed. 

    7. Illegal Adderall can cost $5 to $7 per pill

    (Psycom)

    Many students buy illegal stimulants from their peers. The most common reason for taking it is exams and homework. Students feel high pressure and fear underperforming, so they decide to boost their focus and get higher grades. College campus safety articles point out that students should primarily try natural methods to increase their productivity. If that doesn’t work, they should become more informed about the drugs before deciding to test them out. 

    8. 1 in 5 college students abuses prescribed stimulants 

    (Affordablecollegesonline)

    College can be stressful. The change of environment, new friends, and some added stress often cause the fear of failure among students. That’s why some decide to increase their chances of success with stimulants. One in five students admitted using prescribed stimulants, such as Ritalin or Adderall. 

    College campus crime statistics

    All sorts of things happen on college campuses. It seems fraternities, sororities, and parties are a great way for students to vent. However, these statistics suggest that the institutions and the students must take college campus crime seriously and work on prevention and sanctions. 

    9. Almost 10 out of 1,000 students are victims of crime in Marquette University

    (Silive Valuepenguin)

    According to the latest data, Marquette University is one of the least safe college campuses in the US. Violent crimes are less common, but property crimes are high. Vanderbilt University has second place with 8.6 per 1,000 students experiencing violent crimes, and the University of California, LA is in third place with an 8.3 mark. 

    10. There were at least 67 gunfire incidents in schools in 2020

    (Everytownresearch)

    Gun-related violence in schools has increased, and colleges are no exception. According to college campus shootings statistics, there were 67 gunfire-related incidents on school grounds in the US. Eight college students died, nine were hurt. In addition, there was one suicide incident with no intent to harm others and one police intervention where nobody was hurt. 

    11. Total of 17,454 VAWA crimes were reported across 11,013 campuses 

    (OPE)

    The Violence Against Women Act addresses domestic violence, sexual assaults, dating violence, and stalking, many of which happen around campuses of US colleges. Unfortunately, considering the latest campus VAWA crime statistics, these numbers are on the rise. According to the available data, there were 17,454 VAWA offenses reported on more than 10,000 campuses. 

    12. 77% of hate crime in college derives from race, religion, or sexual orientation

    (NCES)

    College students often pass judgments based on race, religion, or sexual orientation. Sometimes, the judgment turns into a hate crime. Based on the numbers of crime on college campuses, 77% of reported hate crime on campuses is motivated by race, religion, or sexual orientation. Based on the last available information, race was the cause for 43% of hate crimes, religion for 18%, and sexual orientation for 16%. 

    13. Forcible sexual offenses make 32% of reported crimes in college

    (Criminallawfirmtexas)

    Sexual assault statistics show that this type of crime is common in college. 32% of reported crimes are forcible sexual offenses, according to college campus violence statistics. Young adults find themselves outside their homes for the first time, and this can change their behavior. Besides being common, another problem with sexual assaults is that some of the students involved are still minors. 

    14. 97,000 students report alcohol-related sexual assault or rape

    (NIAAA)

    Students often consume more alcohol than they can stand, and one of the negative consequences is becoming a victim of alcohol-related sexual assault. Rape statistics in colleges show that about 97,000 students aged 18 to 24 have experienced these types of assaults or date rape from their peers. 

    15. 696,000 students were assaulted by another drunk student

    (NIAAA)

    Many college students turned to excessive drinking because of the Coronavirus pandemic. It increased the existing stress among students. Unfortunately, some young adults may turn violent when drinking. According to campus assault statistics, 696,000 students were assaulted by another drunk student across colleges in the US. 

    16. 13% of all students experience rape or sexual assault

    (RAINN)

    The number of sexual assaults in colleges has been on the rise in the last four years. For example, non-consensual sexual contact by use of physical force happens to 13% of students. The prevalence depends on gender and the ability to consent due to being incapacitated. College violence statistics point that female undergraduate students are three times more likely to be victimized than female graduates. Undergraduate men are also twice as likely to report sexual assaults. 

    17. 22% of college students experience cyberbullying

    (Affordablecollegeonline)

    The internet is useful to students in many aspects of their life. They use it to finish homework, attend online classes or socialize. But, unfortunately, with social media comes the problem of cyberbullying. Campus violence statistics show that about 22% of students experience bullying online, and 38% know someone who was cyberbullied. 

    18. Property crime affects 22 out of 1,000 students

    (Valuepenguin)

    Property crime statistics say that this is the most common crime students are dealing with on college campuses. Property crime mostly comes down to burglary, with the intention to commit theft. According to college crime rates, it’s far more common than violent crimes and hits on average 22 students per 1,000. 

    Improving College and Campus Safety

    Even though there are many challenges when it comes to the safety of college campuses, many colleges across the US are working on improving the students’ safety. Video security systems and law enforcement officers are just a small part of what colleges could do, based on the Clery Act. 

    19. 86% of campus law enforcement officials have the right to make an arrest

    (Ravemobilesafety)

    Safety on college campuses can be improved, and many crimes can be prevented with on-campus law enforcement officers. Most academic institutions employ armed officers, and 86% of sworn officials have a legal right to arrest outside campus grounds. 

    20. The University of Connecticut reported 826 safety-related in 2019. 

    (Collegefactual) (UCONN)

    The University also has a web page with detailed instructions on how students can take action against crimes and similar events. Still, there were 826 safety-related incidents that involved students in 2019. 

    According to college campus safety rankings, out of the total 3,990 colleges and universities that reported crime and safety data, 3,935 of them reported fewer events. 

    21. There were 207,383 disciplinary actions across 6,104 institutions and over 10,000 colleges 

    (OPE)

    Colleges started taking crime seriously. There were over 200,000 reported disciplinary actions taken and 44,567 arrests on college campuses. Even though these numbers show a slight decrease in trends, college crime is still something to worry about.

    22. Average self-defense class cost ranges from $30 to $200

    (Verywellfit)

    Because of increased college campus crime and violence, many women decide to opt-in for a self-defense class. Some colleges even offer such classes as a part of the curriculum. Sometimes they can be credit classes, sometimes taken for fun, but they offer a sense of safety among college students. Another alternative is buying a stun gun, taser, or pepper spray.

    23. In 2019, students showed a significant increase in the knowledge of definitions and procedures in sexual assault compared to previous years

    (AAU)

    According to the latest available campus crime stats and surveys, the biggest change is reflected in students’ familiarity with sexual assault and misconduct definitions, with 11.5% of undergraduate women and 12.5% of undergraduate men. 

    24. Students can purchase a safe for their valuables for as low as $120

    (Safeandcosy)

    Many students consider bringing a safe to their dorms, and it seems a smart idea because of all the thefts that happen around campuses. For just $120, students can purchase a small safe and increase their college campus security. 

    25. The Clery Act from 1990 is still in use and brings many positive effects 

    (Thebestcolleges)

    The Clery Act was named after a student, Jeanne Clery, who was raped and murdered in her dorm. This Act raises awareness of the crimes and requires the schools to publish their annual crime statistics, disclose the places of the incidents, issue warnings, compile fire safety reports, deal with missing students, and instantly respond to dangers. The Act is highly effective and increases universities security. 

    26. 75% of 4-year academic institutions employ armed officers

    (RAINN)

    According to the latest available information, 75% of 4-year academic institutions employ armed officers, which is a 10% increase in the last decade. In addition, 70% of law enforcement officers have memorandums of understanding with the local law enforcement. With this agreement, these two parties cooperate and work on enhancing the college campus safety.

    27. When it comes to video security in educational institutions, 7% of survey respondents claimed they lack staff

    (Campussafetymagazine)

    More and more campuses decide to increase their video surveillance, but some are having difficulties. They are dealing with more maintenance and integration-related issues than K-12 institutions, according to public safety reports. Video surveillance data loss has a severe impact on the ability of the institutions to intervene during and react after the incidents happen appropriately. 

    Conclusion 

    College should be a fun time for everyone. Students experience living in a different setting, gain new friendships, and enjoy their opt-in classes. But, unfortunately, college campuses aren’t the safest places. Living in a dorm may expose students to violent crimes. 

    While burglaries are the most common problem, excessive alcohol intake can cause many negative consequences among students and their friends. Luckily for future students, colleges are obligated to reveal their college campus safety statistics, following the Clery Act. 

    By learning which campuses are the safest in the US, students can carefully consider their options and apply to colleges they believe will be the best selection. However, with the Coronavirus pandemic, chances are many students will attend online classes for the time being. 

    When the campus’ doors open again, institutions will probably have to deal with enforcing social distancing and other guidelines to minimize the spread of the virus, on top of other issues. 

    People Also Ask

    Why is campus safety important?

    College safety is of utmost importance for both parents and students. Young students should be able to study and work on their careers at peace, finish college, and get a job without having to worry about being attacked or raped. Since college crimes are a major issue, campuses act proactively to provide students with a sense of security. 

    Do college students feel safe on campus?

    Overall, most students feel safer on-campus than off-campus. However, some are also worried about alcohol abuse, violent attacks, rapes, and property safety. Another thing that students started worrying about is the Coronavirus pandemic. Many colleges are back to regular classes, and students are fearful that their peers won’t follow the guidelines to prevent the spread of the virus on campus. 

    What is the most dangerous college campus?

    Marquette University is one of the most dangerous universities in the US, with about 10 out of 1,000 students becoming victims of crime. Even though violent crimes are less common, property crimes are high. Other less safe colleges are Vanderbilt University and the University of California. On the other side, some of the safest ones are the University of Connecticut and Brigham Young University. 

    How can I improve my campus safety?

    Students can look into safes to protect them from property crimes and help them save their belongings. The relevant institutions also recommend learning about reported crimes, evacuation paths, self-defense, and sexual assault prevention. Keeping an eye on the drinks, not mingling alone around campus, and having friends you trust is the best thing to do. Minimizing alcohol intake and drug abuse, and dealing with the stress in a more natural way, are also advised. 

    What is the most common crime on college campuses?

    Property crimes are the most common crimes on college campuses. Burglary, with the intention of stealing, is what worries many students. However, those peers who decide on such an act don’t consider the implications of their actions, and it can easily cost them a career down the line. Other common crimes include forcible sexual assault and other alcohol-related offenses. 

    How can students stay safe on a college campus?

    With the Coronavirus present in everyone’s lives, students can do their best to adhere to the CDC guidelines and maintain social distance and personal hygiene. They should also take the time to know the campus, especially the location of the campus safety office. Having a plan in case something happens is a good idea and awareness of the college campus safety statistics.

  • 15 Informative Self Driving Cars Statistics

    15 Informative Self Driving Cars Statistics

    Autonomous vehicles are here to stay, and if you are like most people and don’t know how to feel about them, these self driving cars statistics will help you decide if you love or hate them.

    More and more companies are joining the race to build the ultimate autonomous vehicle (AV).

    Although they are still in test phases, the odds are that we will be seeing them more in the future.

    So, you will have to get used to seeing driverless cars around, as eerie as it may sound.

    Important Self Driving Cars Statistics (Editor’s Picks)

    • Only 12% of people in the US would feel safe taking a ride in a self-driving car
    • Self-driving vehicles could save up to 50 minutes used to spend driving daily
    • In California, there are over 35 companies with 676 autonomous vehicles 
    • Compared to Uber, Google’s Waymo has 28,000 lower disengagement rates
    • Waymo cars didn’t have any single-vehicle accidents in over 6 million miles covered
    • Research notes that a group of driverless vehicles may improve traffic flow by 35%
    • Over 50% of people in the US are comfortable with these vehicles delivering groceries
    • As per estimates, current driverless cars won’t avoid 66% of most common accidents

    Interesting Self Driving Cars Safety Statistics

    1. 43% of people with disabilities believe that autonomous vehicles’ advantages overshadow the disadvantages, while only 34% of people without disabilities feel the same way.

    (PAVE)

    It’s quite understandable since automated vehicles would enable them the mobility they could’ve only dreamed about a couple of years ago. This would also help them feel more independent, thus improving their quality of life.

    2. Only 12% of American drivers would feel safe riding in a self driving car.

    (AAA)

    Although autonomous vehicle technology is continually evolving, only one in ten American drivers would feel safe riding in a fully autonomous vehicle, the latest AAA research shows. Furthermore, 72% would feel safer if they could take control at any moment, and 68% stated that a backup human driver would be a good idea.

    3. More than half of Americans are comfortable with automated vehicles delivering groceries.

    (AAA)

    The statistics on self driving cars show that 53% of people wouldn’t mind AI (artificial intelligence) vehicles being in charge of low-speed and short-distance transport like people movers in airports and theme parks. Also, about 44% of people are okay with their groceries and packages delivered by self-driving vehicles. But only 20% would allow their families to be transported by these vehicles.

    4. Approximately 94% of all vehicle crashes are caused by human error. Therefore, automated vehicles are expected to reduce overall traffic incidents by eliminating the human factor.

    (NHTSA)

    Besides saving lives, the benefits of self-driving cars include enormous savings in the economy. For example, as a result of traffic injuries in 2010, we have spent more than $242 billion in reduced economic activity and $594 billion due to loss of life and reduced quality of life.

    5. NHTSA concluded that current driverless cars wouldn’t be able to avoid almost two-thirds of the most common accidents.

    (IIHS)

    Although we put a lot of faith in the future of self-driving cars, the facts may be telling us a different story. NHTSA stated that even though AI drives much better than us at reduced visibility, has shorter response time, etc., it cannot predict events. For instance, people would choose not to overtake a bicycle rider before a corner and slow down when they see people going near the pedestrian crossing.

    Interesting Facts About Self Driving Cars and Their Benefits

    6. Approximately 36% of Americans believe that improved road safety is the most significant benefit automated vehicles will bring.

    (PAVE)

    Furthermore, 45% think that AVs can save lives, while 36% are unsure. People are aware of the benefits the new technologies bring. And considering the current traffic fatality rates, they know how hard it is to see improvement.

    7. Automated vehicles could free up to 50 minutes a day for average users. Moreover, they will be able to spend this traveling time any way they like.

    (McKinsey & Company)

    This is one of those autonomous vehicle statistics that brightens up our day and the online business managers’ too. The odds are, we will be spending those free minutes staring at our phones. That’s why the other part of the research concludes that online businesses will see a $6 billion revenue increase per year for every additional minute we spend online while in the car.

    8. As per research, a group of driverless cars can enhance the flow of traffic by around 35%. 

    (Science Daily)

    This is one of the driverless car statistics from research conducted by researchers from the University of Cambridge. In detail, they programmed a fleet of model robotic cars and put them on a multi-lane track, noticing traffic flow changes once a vehicle stops. 

    Facts About Self Driving Car Accidents

    Autonomous vehicles have been around for several years, but they are still a new technology that has to prove itself. And people are not that well informed about it.

    Accidents involving AI cars get a lot of media attention, and the flashy headlines about killer robots on the streets do not help much in educating the public. Every time an incident involving AVs happens on the streets, it revives a public debate on self-driving cars pros and cons. 

    This can make us think that these accidents happen all the time. But could you imagine what your news feed would look like if we had media coverage for every fender bender humans caused?

    9. DMV California stated that 36 companies with 676 vehicles drove a total of 2,880,612 miles and had 9,338 disengagements in 2019.

    (DMV), (The Verge)

    The term “disengagement” is used for occasions when a human driver has to take control to avoid some potentially dangerous situation. The lowest rate of disengagement was reported by Baidu, with one intervention every 18,050 miles. The self driving car statistics show that Google’s company Waymo had the second-best result, with 13,219 miles per disengagement. The average is one driver intervention per every 308 miles of autonomous drive. 

    10. Waymo reported no single-vehicle accidents in more than 6.1 million miles traveled.

    (Waymo), (IIHS)

    Waymo is Google’s subsidiary and a leading company in autonomous vehicle developments. Their autonomous cars statistics show their vehicles have traveled about 6.1 million miles in past years, without any single-vehicle accidents. Just to show you how important that is—53% of traffic fatalities in 2019 came from single-vehicle crashes. 

    11. Waymo autonomous vehicles had just 18 minor incidents per 6.1 million miles traveled.

    (Waymo)

    Waymo recently revealed how many self driving car accidents they have had—18 low-severity incidents in 6.1 million miles traveled. The result would be even better if it weren’t for humans’ unforeseeable actions. Namely, many of these incidents were other drivers’ fault, such as cars and bicycles hitting the AVs from the back. The other significant cause for incidents was that an AI was caught off guard when people committed traffic violations. One of the most surprising facts about driverless cars is that they assume the human drivers will do everything by the book.

    12. Google’s Waymo had 28,000 lower disengagement rates than Uber.

    (Statista)

    Waymo had 0,09 disengagements per 1,000 miles, while Uber had 2600. It is so because Waymo is conducting its tests over a wide area, while Uber is more concentrated on urban areas with much denser traffic. In these circumstances, human drivers have to intervene more often.

    13. Uber’s autonomous vehicle has caused one death.

    (Waymo), (NBC)

    There is no sufficient data to calculate the driverless car accident rate since the fatalities are calculated by 100 million miles traveled, and the autonomous vehicles haven’t traveled that much. The fatality rate in the US was 1.1 in 2019. To put things in perspective, Waymo, one of the industry leaders, traveled a total of 20 million miles by January of 2020. Uber just reports “millions of miles.” There was one unfortunate pedestrian death in March of 2018, caused by Uber’s autonomous vehicle. For now, we can say that due to this death, AVs have a worse fatality rate than humans.

    Ways to Improve Self Driving Cars Statistics

    14. BMW and Daimler are joining their forces and allocating more than 1,200 experts to speed up autonomous cars’ development.

    (CNBC)

    Although fierce competitors, the two automotive giants decided to join forces and, along with nine other companies, published a white paper on driverless technology called “Safety First for Automated Driving.” The main goal is to establish safety standards in the industry and improve self driving cars statistics.

    15. NHTSA announced the expansion of its AV-TEST pilot initiative, and it now includes 52 companies, governments, and associations.

    (NHTSA)

    The program started in 2020 with nine participants, and this latest expansion should significantly improve and speed up the work on AV development and identification and collection of relevant data. This will all be available to the public on a daily updated dedicated webpage. It will go a long way in introducing the technology to the public, keeping them informed on the progress, advancement, safety implications, and positive facts about self-driving cars.

    Conclusion

    Autonomous vehicles are still uncharted territory, and we discover something new every day. And surprisingly, the more we find out about artificial intelligence, the more we find out about ourselves, and here’s why. 

    Self driving cars safety statistics show that most of the accidents happened because cars didn’t know how to react when people were violating traffic regulations. And we tend to do that a lot. Just take a look at the fatality numbers and their causes. Should we program cars to think like humans? But then that might imply they will act without thinking much.

    However, the number of autonomous vehicles is constantly increasing, and pretty soon, we will have to share our roads with them. So it will be interesting to see how we will interact. 

    People Also Ask

    How many accidents are caused by self driving cars?

    There is no centralized national or international database about autonomous vehicles. However, California is one of the states that require companies to send their data. And their DMV stated that 676 vehicles from 36 companies traveled a total of 2,880,612 miles and recorded 9,338 disengagements in 2019. That makes an average of one driver intervention per every 308 miles of autonomous drive. Baidu had the lowest rate of disengagement, with one intervention every 18,050 miles.

    How many fatalities have been due to self-driving vehicles?

    Autonomous cars have caused six fatalities. One happened on March 18, 2018, in Tempe, Arizona. The vehicle failed to recognize a 49-year-old woman pushing her bicycle across the street and hit her. The official reports say that it was because she was jaywalking, and the car’s computer wasn’t programmed for that eventuality. The car was in fully autonomous mode, and the safety driver was distracted by her phone at the time. There were also three fatalities in Tesla vehicles, but they were not fully autonomous.

    How many self driving cars are on the road in 2020?

    Although the Guardian had predicted back in 2015 that we will have 10 million autonomous vehicles by now, the real numbers are much lower. According to the latest data, there are more than 1,400 self-driving vehicles of all categories currently in testing by more than 80 companies. They are scattered across 36 states and the District of Columbia. However, the bulk of them is in California, where 62 companies are conducting tests.

    How many self driving cars are on the road now?

    Although many manufacturers had visions of grandeur and Tesla even planned to have 1 million driverless taxis on the streets by the end of 2020, the facts tell a whole different story. The US Department of Transport stated that 82 companies in the US currently test their 1,400 vehicles. As far as commercial use is concerned, Lyft uses the Waymo fleet to transport passengers in Las Vegas, and they’ve performed 100,000 paid rides in autonomous vehicles.

    Are self driving cars safer than cars driven by humans?

    There’s no sufficient and conclusive data to claim that AVs are safer or less safe than human drivers. The companies are not obligated to send their data to some centralized database. Waymo, one of the industry leaders, reported 18 minor incidents per 6.1 million miles traveled and on driver intervention per 13,219 miles. Baidu has the best result with one disengagement per 18,050 miles traveled.

    What is the cheapest self driving car?

    This technology is not cheap, so cars equipped with it are not really affordable. You should be aware that these cars all require human supervision, and none of them is listed as fully autonomous (level 5). We are not even close to level 4. Many producers list partial self-driving capabilities, so it’s hard to compare. The first manufacturer to publicly announce mass production of level 3 autonomous vehicles is Honda, with its Legend model, available from March 2021.

    How accurate are self driving cars?

    Self-driving cars are much more accurate than humans when it comes to receiving information about their surroundings, thanks to the number of sensors. They are not impaired by alcohol, drugs, drowsiness, poor weather, and similar. But they cannot still perceive human actions. For instance, they are not prepared for people jaywalking. Most of the incidents that Waymo has had were other cars and bicycles hitting them. In human drivers vs. self driving cars, statistics indicate that most of the accidents were caused by people who were violating traffic regulations.