Author: Damjan Milenkovic

  • Burglary vs Robbery — Understand the Differences

    Burglary vs Robbery — Understand the Differences

    Burglary and robbery are two very different crimes, but people often confuse them. When thinking about burglary vs robbery, we should know that the former stands for the unlawful entry of a structure with the intent to commit a felony. In contrast, robbery represents taking something from someone by force or threat of violence.

    No one wants to become a victim of either of these crimes. However, it’s essential to make clear distinctions between the two to be better prepared.

    What Is Burglary?

    Burglary stands for illegal entry into a structure or onto a property with the purpose of committing a crime. Let’s note that the building in question doesn’t necessarily need to be a home or a commercial one. In addition, there don’t have to be any physical signs of breaking and entering; the culprit can also trespass through an open door or window.

    Burglary Elements 

    Different states have different laws governing burglary, but all of them require three crucial elements to be present.

    • unauthorized entry (breaking and entering, or entering without permission)
    • occupancy (the structure or building in question must be occupied at the time of entry)
    • the intent to commit a crime (there must be proof that the person who committed burglary intended to commit another crime once inside the occupied structure)

    Burglary Sentence

    The penalties for burglary depend on several factors. These include the nature of the crime, the type of property, and whether the crime involved violence. Examples of punishments are fines, probation time, and time in prison.

    First-degree burglary is the most serious and is typically treated as a felony. Penalties can include hefty fines and even life imprisonment in some states. Second-degree burglary charges involve up to 15 years of probation or prison, along with surcharges and fines.

    Those who commit third-degree burglary offenders may have to pay lower fines, face up to five years in prison, or receive probation time. Fourth-degree burglaries are usually treated as misdemeanors, so they typically involve jail sentences of up to three years or fines of no more than $3,000.

    Example of Burglary

    A typical burglary example is breaking into a home or business to steal money or property. Others include breaking into a car to steal valuables or using a false key to enter a locked building.

    Having a home security system, like Frontpoint, helps in these situations. Burglars are looking for easy targets, and a home security system makes your home a much less attractive option. Moreover, statistics show that over 20% of Americans have an alarm system.

    What Is Robbery?

    A robbery is a theft through violence or the threat of violence — the offenders confront the victims directly and use force to steal their belongings. There are three different levels, depending on the level of force used. Moreover, each robbery pertains to a set of elements that need to be present for it to be treated as such.

    You may be wondering: “what is aggravated robbery?” Robberies that involve weapons or the ones where the victims suffer physical injuries are called “armed” or “aggravated,” in contrast to simpler thefts where the victim isn’t harmed.

    Elements of Robbery

    Robbery is a serious crime that involves a person taking another person’s property by force. The elements include:

    • the property must belong to another person
    • the offender must have taken the property from that person
    • there must have been some form of force or threat used to take the property
    • the intent to steal the property must have been present, and the individual must have intended to deprive its owner of it permanently

    Robbery Sentence

    The sentence for robbery always depends on the level of the crime:

    • Level one (robbery with minimal force)
      This could result in a fine or up to a year in jail.
    • Level two (robbery with the use of a weapon)
      This will result in a lengthy prison sentence or even life imprisonment.
    • Level three (robbery involving the use of a weapon or force or a severe injury)
      This is a serious offense, with sentences ranging from three years to life imprisonment.

    What are the penalties for armed robbery charges? If found guilty of robbing while armed, the offender will be subject to a maximum sentence of 30 years in prison.

    If you are caught in possession of items that may be used to commit the crime in question, it could be considered that you were going equipped for theft. Factors such as the nature of the crime and the value of the items stolen also affect the sentence. For example, if the robbery involved a firearm, the prison sentence can be extended by up to 15 years.

    What Is a Robbery? — Examples

    To better differentiate it from other crimes, here are two examples of robberies:

    • A man walks into a bank and demands money from the teller, stating he has a weapon in his pocket. He takes the money and escapes before the police can apprehend him.
    • A group of thieves approaches a man on the street and threatens him with violence unless he doesn’t hand over his wallet and phone. The man quickly surrenders his belongings, fearing for his life. The thieves walk away with the stolen goods and escape before the police arrive.

    Burglary vs Robbery — Similarities and Differences

    Both of these crimes involve stealing from a victim, but they still have some critical differences.

    Robbery typically means taking property from a person by force or threat of force. This can include physical violence, such as hitting or punching the victim or using a weapon.

    On the other hand, burglary typically means breaking into a home or a commercial building with the intent to commit a crime. Examples include picking a lock, prying open a window, or breaking down a door. Moreover, two-thirds out of the 2.5 million annual burglaries are home break-ins.

    However, burglary vs robbery facts also reveal some similarities between these two crimes. For example, both include the intent to steal something, and the former can (but doesn’t have to) involve the use of violence, which is always present in a robbery. 

    Let’s look at these examples to see the differences:

    BurglaryRobbery
    a person breaking into your home with force while you are not there and taking your belongingsa robber forces the victim to withdraw money from an ATM through threats
    thieves entering through a window of a house and stealing jewelry, cash, and other valuables while the occupants aren’t home a masked group holds up a convenience store with firearms

    Home Invasion vs Burglary vs Larceny vs Theft vs Robbery — Most Commonly Confused Crimes

    These five are some of the most commonly confused crimes in the legal system. Keep in mind that each has its own set of elements and penalties. Even though people most often confuse burglary and theft, the other three are similar enough to further add to the confusion. The following sections will provide details on each of these crimes so that you can make a clear distinction.

    Burglary vs Theft

    Burglary is defined as the unlawful entry into a structure to steal something. To charge someone with this crime, the prosecutor must prove that the person intended to commit a crime once they entered the building. On the other hand, theft stands for taking another person’s property without consent, intending to deprive the victim of it permanently. It also often occurs without the victim being aware.

    The difference between theft and burglary is that, in the case of theft, the prosecutor doesn’t need to prove you intended to commit the crime once you took the property; they only need to prove that you wanted to keep it for yourself.

    The penalties for these two crimes depend on the value of the property involved and the state where they occurred. Most often, they are punishable by fines and/or jail time.

    Robbery vs Theft 

    At their core, both of these crimes involve taking or trying to take someone else’s money or property without their permission. However, the main difference is whether the perpetrator uses force or threats of physical harm during the act.

    For instance, in a theft, the offender takes the property without the use of violence and usually without the victim’s knowledge. In a robbery, though, they use force or the threat of force to take the goods from the victim.

    Another difference between robbery and theft is that the robber takes the property directly from the victim. In a theft, the criminal takes the goods while out of sight and while the victim is away. It also stands for all kinds of stealing, such as intellectual property theft, identity theft, and theft of services.

    The penalties for theft and robbery also depend on the property’s value and the crime’s circumstances. This can vary widely between states and countries, so it’s essential to check the laws in your jurisdiction for precise information.

    Larceny vs Robbery

    In general, larceny only refers to the theft of physical items. In fact, it can include the theft of cars or jewelry and theft of services, such as cable TV or Internet service, and can also happen when the owner is not around.

    Both crimes are treated as theft of personal property. However, robbery involves the use or threat of force, unlike larceny-theft. For example, if someone steals your car at gunpoint or intimidates you with a weapon to make you hand over your purse, that’s robbery.

    The critical difference between the two crimes is the use of force or threat of force in robbing a person versus the lack of confrontation in larceny. Both are usually considered felonies, meaning they’re punishable with a lengthy prison sentence.

    Robbery vs Burglary vs Theft

    Robbery, burglary, and theft are all crimes that involve taking property that doesn’t belong to you. However, they differ according to the type of property in question, the location, whether the perpetrator used force or threats, and other circumstances.

    Robbery involves taking something from a person by force or the threat of force through confrontation. On the other hand, the burglary definition states that the criminal has to enter a structure to commit a crime, with or without force, and often with the intent to steal something.

    At the same time, in a theft, the culprit takes the goods without the use of force while the victim is unaware. It also doesn’t refer only to stealing physical items; the goods in question may also include intellectual property and identity.

    Burglary vs Robbery vs Home Invasion

    As mentioned, burglary stands for illegally entering premises to commit a crime. This can be anything from stealing property to vandalizing the building. The perpetrators can use weapons and force to enter the building or rely on more constructive means, such as using a key to enter or tricking the owners into letting them in. In most states, it is classified as a felony offense.

    When comparing robbery vs burglary, it is important to say that the former stands for taking or attempting to take the goods from the victim by using threats, force, or weapons. While it may be part of a burglary, it can also occur in the street and always involves confrontation with the victim. State laws typically consider it a severe offense, so it’s often classified as a felony.

    Moreover, when considering robbery vs burglary in California, we can say that the latter has a shorter minimum sentence of imprisonment — it can result in felony probation or two to six years in prison. On the other hand, robbery may lead to misdemeanor or felony probation or three to six years of jail time. Finally, in terms of fines, offenders of both crimes may need to pay up to $10,000.

    Home invasions are also a type of burglary, but they are more violent. Home invaders tend to be armed and are often focused on specific items or people within the building. They may use intimidation tactics, threats, or violence to get what they want.

    Final Words on Robbery vs Burglary

    These two terms refer to different offenses but are often used interchangeably; burglary stands for the unauthorized entrance of a building to commit a crime, while robbery involves using force or threats of force to obtain the property.

    It is essential to understand the different aspects of these two crimes to stay safe and prevent them from happening. To learn more about them or receive advice on how to stay safe, make sure to speak with a trusted legal professional.

    People Also Ask

    What is aggravated burglary?

    Aggravated burglary involves using a weapon or explosive during the act of stealing. One of the examples is breaking into a home with a gun. The punishments for this type of crime are more severe since it poses a greater risk to public safety. Offenders who commit this form of burglary face lengthy jail sentences and consequences such as fines and community service.

    Is robbery a felony?

    Yes, robbery is a felony. Under federal law, it means taking something of value from another person by force or threat of force. It is a severe offense, punishable by imprisonment, fines, restitution to victims, and other penalties. If you have been charged with robbery, it is crucial to speak with an experienced criminal defense attorney. They can help you understand the charges against you and the consequences.

    Is burglary a felony?

    Except for fourth-degree burglary, which is most often regarded as a misdemeanor, burglary is treated as a felony. This means it is punishable by a lengthy prison sentence and hefty fines. Moreover, the punishment varies depending on the severity of the crime and the jurisdiction in which it occurred. In some cases, the severity may increase if the offender inflicted physical harm or possessed a weapon during the burglary.

    Is burglary a violent crime?

    There is no definitive answer to this question. However, a few factors may influence whether or not burglary is treated as a violent crime. These include the victim’s perception of violence, the severity of the crime, and whether or not the perpetrator used force.

    An example of a violent crime is when a burglar uses weapons or other forms of physical violence against a victim. Cases in which the victim feels threatened or intimidated during a burglary incident can be regarded as violent crimes, too.

    What is more serious, robbery or burglary?

    In general, robbery is a more severe crime because it often involves violence or the threat of violence. Burglary, on the other hand, usually stands for unauthorized entry into a building or structure, and often when the occupants aren’t there, so it doesn’t necessarily include the use of violence. As such, penalties for the latter are usually more severe than for the former.

    When comparing burglary vs robbery, the seriousness of a crime can vary depending on the situation and potential harm to victims. For example, if a firearm or another deadly weapon is involved, the jail sentence can be extended to 15 years.

  • 18 Worrying Package Theft Statistics To Raise Awareness

    18 Worrying Package Theft Statistics To Raise Awareness

    Porch pirates are the opportunists who are lurking around corners, waiting for the perfect opportunity to pick up the package lying on your doorstep. As more and more people are buying online, package theft statistics warn that this problem will only get worse, despite the ongoing efforts to stop and arrest these individuals.

    Online ordering accessibility and free shipping incentives are a double-edged sword. You will certainly find it convenient to order online whatever you need and have it delivered for free. However, all those packages piled up in front of your door will be a perfect pray for parcel thieves. The increasing number of online orders impedes law enforcement agencies across the world to combat this crime.

    Despite what many people believe, their package isn’t at risk only during the holiday season. Sadly, package theft is an all-year-long concern.

    Top Mail Theft Statistics (Editor’s Choice)

    • A staggering 11 million homeowners have had a package stolen in the last year
    • The average value of stolen packages is $50–150
    • 41% of Americans have avoided online purchases just to prevent parcel theft
    • The OIG investigated 1,514 mail and identity thefts in September 2013
    • The number of mail phishing attacks increased by 65% in 2017
    • Almost 20% of phishing attacks included stealing credit or debit card information
    • Americans receive an average of 27 packets every year
    • More than 1 billion packages are delivered between Black Friday and Christmas Day

    Shocking Stats About Package Theft

    1. 11 million homeowners have had their packages stolen from their porch.

    (Parcel Pending)

    A package theft report reveals that a flabbergasting 11 million householders have never received their packages — they all ended up stolen by porch pirates. The report also highlights that 74% of packages have been taken during the day when homeowners were absent (possibly at work) so getting the best surveillance cameras for your home would be a good package theft prevention method. The average worth of packages stolen was $50–100.

    2. 20% of recipients would return home early if they were expecting a parcel. 

    (Parcel Pending)

    According to a survey carried out by Shorr Packaging Corp., even 53% of participants stated they had changed their plans only to be home when a package arrived. What’s interesting is that they didn’t have to sign for it.

    Furthermore, 20% of working people stated they would leave work earlier if they were expecting a package.

    3. To prevent package theft, 41% of interviewees stated they avoided ordering online during the holiday season.

    (Parcel Pending)

    Not all people prefer online shopping during the holiday season. Approximately 41% of survey participants admitted they avoided online purchases for fear of having their package stolen. 

    4. UPS and FedEx shipped over 1 billion parcels between Black Friday and Christmas Day. 

    (Parcel Pending)

    The festive season is rather hectic. The two shipping giants, FedEx and UPS, delivered more than a billion packages during the holiday season, more specifically from Black Friday to Christmas Day. As 70% of householders expect to receive a parcel at that time, there’s no doubt that the festive season brings a colossal flow in deliveries worldwide.

    5. Nearly 19% of Americans have had a package stolen from a porch or a mailbox at least once in a lifetime.

    (Home Security)

    Almost 19% of US residents have been a victim of porch theft. As a result, many homes chose to install security surveillance or join the Neighborhood watch — but with no luck. Many even tried leaving work early or changed their daily plans but still faced package theft.

    The peak starts around Black Friday when over 70% of consumers are awaiting an online order. You’d think that staying home at the scheduled time would be sufficient protection from porch thieves, but sadly, that is not true. Therefore, consider buying a high-quality motion sensor light or alarm that would keep potential thieves from entering your porch.

    6. Around 48% of Americans would stay home to prevent parcel theft. 

    (Package Theft Report)

    Even though approximately 48% of US residents would stay home when their package is supposed to arrive, that doesn’t seem to prevent becoming a part of package theft statistics. The reason is simple — you have only a few minutes to pick up a package since many porch pirates follow delivery vehicles and act instantly. Check out this smart home guide and learn how to equip your house with the necessary tools to easily and efficiently keep track of your surroundings at all times.

    7. The average number of parcels that Americans receive per year is 27.

    (Package Theft Report)

    According to the package theft statistics for 2019, 26% of Americans received packages at least once a week, whereas the same percentage got parcels once in a few months. Similarly, 39% received them once a month, and 5% got parcels only once a year. Moreover, 3% of US residents have never received packages. Americans get an average of 27 packets annually. 

    8. 69% of recipients prefer a shipping service to enter their homes.

    (Package Theft Report)

    The majority of porch theft victims are tech-savvy. As such, online shopping is a part of their daily routine. However, their love for online ordering makes them a bigger package theft target. So their precautionary measures should be more extreme. One of them would be letting a shipping service enter their house through an app, notwithstanding where they are. 

    Another alternative to prevent thieves from stealing packages is to pick up the parcel later or send it to the store. Besides, many couriers offer the “leave a note” option. It allows customers to let the delivery man know about the secret safe place where parcels can be left hidden. 

    9. 80% of US householders prefer investing in technology that enables them to see everyone standing in front of their door.

    (Package Theft Report)

    Staying home when expecting a parcel delivery is one way of package theft prevention. However, it seems that, with technology updates, people are becoming aware of more advanced precautionary measures.

    Installing a full home security system or a simple security camera and video doorbell proved to be a more effective way of detecting people stealing packages. This way, victims can have visual proof of their robber, leaving them with better chances of retrieving their goods.

    Also, many use the video security system to monitor their front porch while waiting for the delivery man.

    10. Boston, MA, is among the 10 most-affected metro areas.

    (SafeWise)

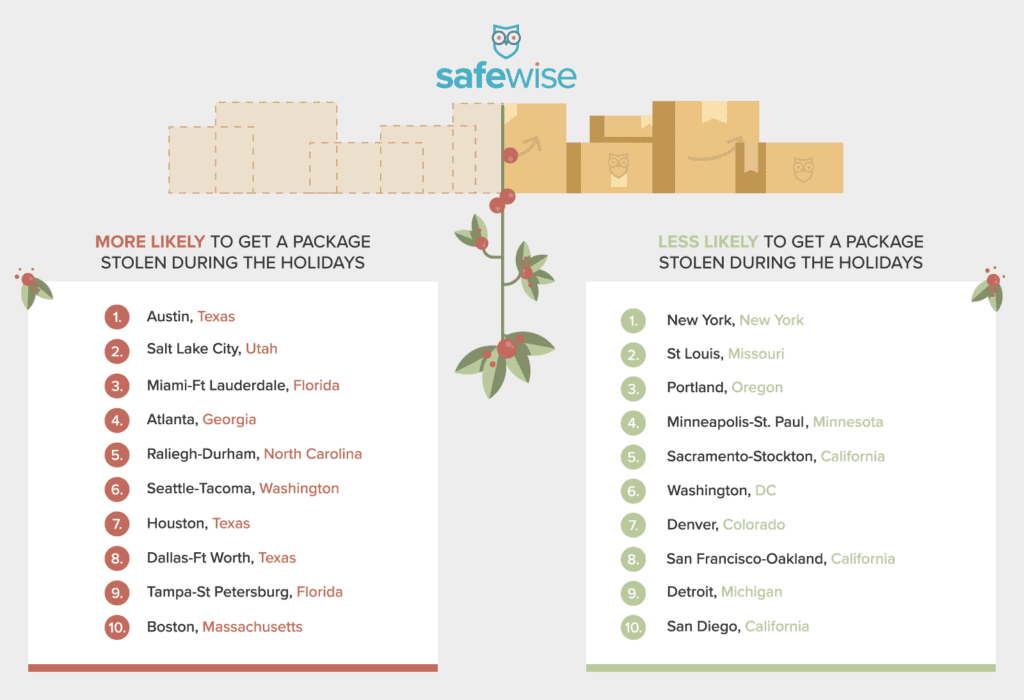
    In a study conducted by the SafeWise website, customers can check what the most attacked areas are and where the highest rate of packages stolen is. Afterward, they can decide whether online shopping is the right fit for their needs. Check out the following and see if you are living in the dangerous waters, or you can take advantage of your safe harbor and become a regular online shopper:

    Holiday Season Package Theft Data

    One can’t help but notice that Texas takes three spots while Florida occupies two on the list of the affected areas. The three metro areas in the state of Texas are Austin, Houston, and Dallas-Fort Worth. It seems that Texas has the greatest incidence of package theft, especially during the holiday season. When it comes to Miami-Fort Lauderdale package theft statistics, the data varies. All year round, Florida scores zero in the package theft field, but they become the third most affected state during the holiday season.

    But what is more surprising is the following data found in the study: 

    Package Steals Likeliness

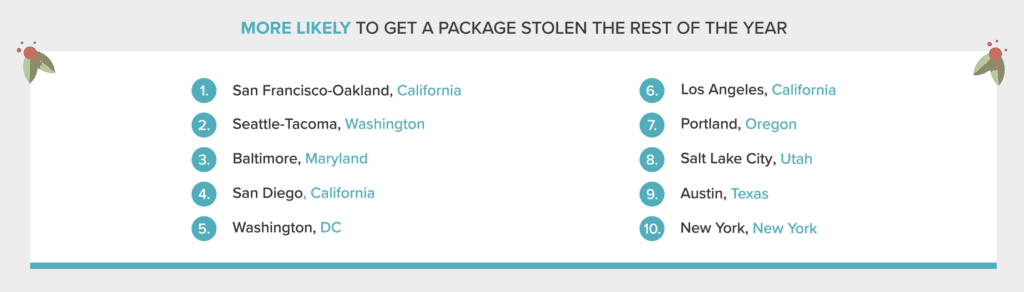
    New York earned its spot as one of the areas where you are less likely to get a package stolen during the holiday season. Regarding the rest of the year, California is more likely to become the desired state of package thieves.

    Surprising Courier Stats Compared

    So, are you a UPS, USPS, or Amazon user? The vast majority of US households have online packages delivered to their home regularly, so courier providers’ choices are substantial. 

    We’ve managed to find the data about the most popular courier providers so that we can answer the following — where is the highest rate of package theft? Check out their numbers:

    11. UPS manages to process over 15.8 million daily shipments, and 88% of those parcels see on-time delivery to recipients.

    (Bit Rebel)

    It seems that UPS manages to avoid parcel theft consequences to a great extent. However, you should bear in mind that this refers to the packages ordered via express delivery service. There are no records of package orders via free delivery or Saturday delivery mode. Also, it is important to note that many cases have ongoing UPS lost package investigation, so the numbers are unavailable at the moment.

    12. The search query Amazon package stolen was entered approximately 210 times per month.

    (Bit Rebel)

    Andry Kerns, a creative director of Digital Third Coast, conducted research to collect data for further analysis and reveal the approximate number of stolen Amazon packages. In California, the search query Amazon package stolen was inserted nearly 210 times a month across a population of 884,363. Kerns used these numbers to calculate a searches per capita value, and here is the ranking of the top 10 cities where Amazon packages were stolen:

    1. San Francisco, California

    2. Seattle, Washington

    3. Minneapolis, Minnesota

    4. Boston, Massachusetts

    5. Portland, Oregon

    6. Washington, D.C.

    7. Oakland, California

    8. Baltimore, Maryland

    9. Atlanta Georgia

    10. Sacramento, California

    It is hard to determine the safest city for packages and to rate the courier’s service, especially since, according to Amazon, the vast majority of their deliveries have reached their customers successfully and on time.

    The courier constantly emphasizes the availability of their 24/7 customer service and their stack of options, including Amazon Map feature, Amazon Locker, and Amazon Key, which help their customers battle with lost packages. Lastly, we had to drive the conclusions ourselves since we could not access the official Amazon package theft statistics report.

    Mail Theft Statistics Report

    However, package theft is not the primary concern of US households. Mail and identity theft have been reported as the number 1 white-collar crime these days. If you think about the fact that the US Postal Service handles over 207 billion pieces of mail every month, you will realize this is 207 billion opportunities for identity thieves to obtain your personal information. 

    In fact, your mailbox is the riskiest non-technological point for identity thieves. Now that we have you a bit worried, let’s share some numbers on the topic. Check out the data compiled in 2013.

    13. OIG conducted 1,514 mail identity theft investigations from October 2012 to September 2013.

     (Rapid City Journal)

    Mail and identity theft aren’t that rare as you might think. OIG performed over 1,500 investigations in less than one year, during which USPS OIG special agents arrested 339 postal employees and contractors for theft, delay, or destruction of mail in FY 2013. The overall number of mail theft arrests made by USPS OIG special agents and postal inspectors is 2,876.

    Find out how to deter identity theft.

    14. Phishing attacks grew by 27.5% in Q3 2018.

    (TechRadar, Dashlane Blog)

    Mail fishing statistics reveal that, in Q3 2018, the number of phishing attacks rose by over 27.5%. However, there were far more phishing attempts throughout the same year, as their number grew by 65%.

    15. 19.1% of breaches involved the theft of credit or debit card information.

    (ID Theft Center)

    According to the IRTC report in 2017, these numbers coincided with identity theft growth and numerous data breach reports.

    So, the numbers were gradually rising, starting from 2013 when they were extremely low. Since 2017, no matter if it was USPS package theft or Amazon or UPS failed to deliver the package directly to the customer, 19.1% of breaches included theft of credit and debit card information for the purpose of committing a credit card fraud. Throughout 2017, there were over 930 data breach incidents involving Social Security Numbers. 

    Usually, customers are not aware of how one can use their Social Security Number, their home address, or phone number. A simple USPS mail theft can easily retrieve these details since many companies still use the Social Security Number as an authenticator. That information can be extracted during simple mail theft. 

    The US Postal Inspection Service offers tips to help you protect yourself from being a victim of mailbox identity theft. However, if you become a victim, here is how to report identity theft.

    What is Mail Phishing?

    There is one more method of gathering personal information you should be aware of. Phishing is a venerable, increasingly sophisticated method of cyberattack that targets email users. You usually get a false message from a bank or company, and you need to click on some link or download the attachment.

    This way, you are providing all the information your attackers need to be able to steal your identity or access your bank details and commit internal mail theft.

    To be more aware of these widespread attacks’ severity, see the following:

    16. Nearly 30% of breaches included phishing. 

    (CSO)

    Concerning identity and mail theft statistics, almost one-third of breaches in 2018 included phishing. Regarding cyber-espionage attacks, the figure climbed to 78%. One of the most far-reaching phishing attacks throughout modern history occurred in 2016, when hackers tricked John Podesta, Hillary Clinton’s campaign chairperson, to give his Gmail password.

    17. A hacker could face five-year imprisonment and pay $250,000. 

    (Tech Crunch)

    Phishing and mail theft penalties can be higher than what people think. Hacker Ryan Collings could receive a sentence to five years in prison, together with a fine amounting to $250,000. In his phishing attack, he managed to hack Apple servers and steal celebrities’ nude photos. The hacker had access to over 120 Gmail and iCloud accounts. He was charged with violation of the Abuse Act and Computer Fraud. 

    18. 305,000 payment cards were exposed in one NY scam. 

    (Democrat and Chronicle) 

    Scams and mail fishing in NYC are quite frequent. Recently, New York residents have been warned about a phishing scam in emails coming from the city’s Department of Finance. The authorities successfully stopped the mail phishing in NYC by implementing more advanced security measures. 

    Other scams involved a well-known store operator, DiBella’s Subs. Namely, its computer systems underwent a very sophisticated data breach and exposed 305,000 payment cards.  

    Final Thoughts

    If you live in the areas shown on the package theft map, you are in great danger of becoming a package pirates victim.  Plus, you can easily become a mail phishing scam victim if you’re not careful enough. Phishers target both weak and robust victims. Implement appropriate security measures for mailbox theft prevention and stay informed about cyber trends since your attackers are surely keeping up with this information. 

    And if you’re wondering about what those measures are, make sure to read our follow-up story!

    People Also Ask

    How much mail is stolen each year?

    The US Postal Service announced that over 60,000 complaints of mail theft are reported annually.

    How many packages are stolen each year?

    The most recent parcel theft report states that nearly 29 million Americans (around 8%) have reported that their delivery package was stolen from a front porch or doorstep.

    How many packages were stolen in 2018?

    According to the Schorr report analysis, nearly 26 million package theft complaints were reported.

    How common is mail theft?

    According to the US Postal Service mail theft report, the undelivered mail number was assessed at nearly 4.7%, and the lost mail number is unknown.

    How to prevent mail theft?

    It is important to pick up your mail daily, upgrade your mailbox with mailbox fishing devices, and avoid sending cash and personal information via the mail.

    Is mail theft a felony?

    Mail theft is seen as a felony crime that is sanctioned with up to five years in federal prison, along with a penalty of up to $250,000.

    How to prevent package theft?

    Make sure to follow these measures for parcel theft prevention:
    – Add delivery instructions to keep packages off your front porch.
    – Choose the “pick me later” or “pick me up at the store” delivery method if you cannot be at home at the scheduled time.
    – Install a security camera or a video doorbell.
    – Enlist your neighbor’s house as a second delivery address or have a package delivered directly to your office.
    To prevent becoming yet another figure in package theft statistics, you should follow all these precautionary measures.

  • 29 Informative US Crime Statistics

    29 Informative US Crime Statistics

    Crime rates have a significant impact on a country’s sense of security and economy. When the number of crimes such as fraud, theft, money laundering, and embezzlement increase, it can negatively impact a country’s economy. This is why the FBI and law enforcers struggle to create programs crucial to decreasing the country’s crime rates. Equally important is to determine how effective these programs are in reducing crime rates. One way to do this is by identifying key crime statistics.

    We will discuss some essential facts, figures, and crime rates in the US to find out just how effective law enforcers are in holding back criminal activity.

    Interesting US Crime Statistics — Editor’s Choice

    • The most common property crime in 2020 was larceny-theft, with over 4.6 million cases
    • Almost 80% of Americans believe that crime rates are higher than in the past
    • The US crime rate decreased by 1%
    • In 2020, the murder cases rate increased by 21.8% in 36 US cities
    • The rate of violent crime victims was 16.4 per 1,000 people in 2020
    • The US clearance rate for violent crimes is 45.5%
    • Nearly 54% of homicide victims are Blacks
    • When the pandemic struck Chicago, the crime rate in the city dropped by 10% 

    United States Crime Statistics

    1. Crime statistics show that by 2019, crime rates in the US had decreased by more than 50% since their peaks in 1991.

    (State of the Union, Pew Research)

    Both property crimes and violent crimes in the US have seen a drastic decline in the number of cases. Their crime rates hit an all-time low in 2014, and the numbers have remained low until today.

    However, between 2019–2020, the murder rate grew 30%, translating to the largest single-year increase in over 100 years.

    2. In 2020, the most common property crime in the US was larceny-theft, with over 4.6 million cases.

    (Statista, FBI)

    In detail, theft of items from motor vehicles was the most prevalent among larceny-theft incidents. 

    Moreover, national crime statistics 2019 reveal that the larceny-theft rate was 1,549.5 per 100,000 residents in 2019.

    3. 78% of Americans believe that national crime rates are higher than in previous years.

    (Gallup)

    The belief that crime rates are consistently increasing compared to prior years is becoming a trend among Americans. However, most of the time, this public perception is out of sync with federal criminal records.

    4. Most recent data shows that the US crime rate dropped by 1%.

    (DOJ)

    The FBI proudly reports that the crime rate in the US has declined in the last three years. It appears that the bureau’s initiatives and projects, like Project Safe Neighborhood, Project Guardian, and Operation Legend, are reaping all the efforts.

    5. According to crime statistics in the USA, the crime rate significantly dropped at the onset of the pandemic.

    (USA Today)

    As the pandemic forced businesses to shut down and millions of people to stay at home, the police forces have seen a dramatic decline in crime rates across the country. The number of reported thefts and burglaries is lesser than before the pandemic as fewer stores and shops are open.

    However, the double-digit decline in crime rates doesn’t mean Americans are safer in their homes. In fact, calls reporting domestic disturbance and violence increased by 10% to 30%.

    6. In 2020, the rate of violent crime victims was 16.4 per 1,000 people.

    (Bureau of Justice Statistics)

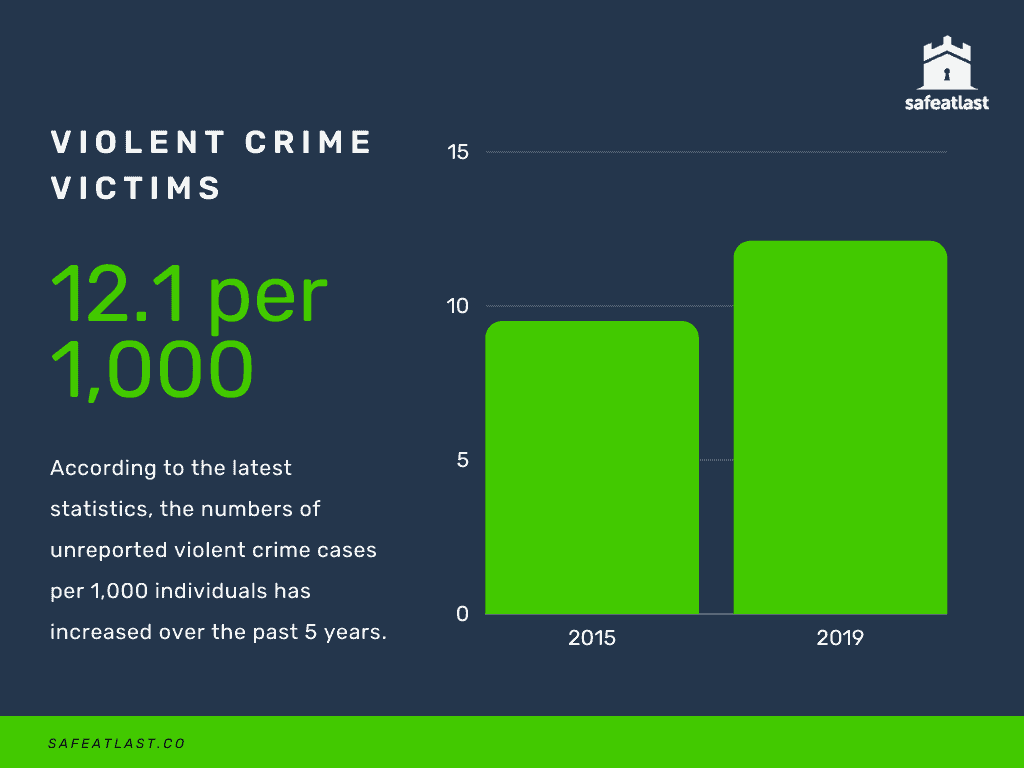
    The number of unreported violent crime cases in 2020 decreased from 2019. According to the crime statistics for 2019, the rate back then was 21.0 victims per 1,000 persons. 

    Moreover, around 40% of violent victimization cases were reported to the police in 2020.

    7. According to the latest info, the clearance rate for violent crimes in the US is only 45.5%.

    (FBI UCR)

    The FBI’s national crime statistics indicate that more than half of violent crimes reported to the police don’t get cleared. Out of 1,147,991 reported violent crimes, only 45.5% ended with a suspect’s arrest. The clearance rate for burglary is even lower — only 13.9%.

    8. The national crime rate in the United States is 47.70 per 100,000 individuals.

    (World Population Review)

    The US crime rate is slightly higher than the world’s average crime index of 47.43. However, this is considered a drastic improvement since violent crime rates in the country have decreased in the last 25 years.

    9. The number of crimes in the US declined by 20% in mid-March.

    (Yale)

    Tobin Center for Economic Policy at Yale University conducted a study that discovered a decrease in criminal trends as the pandemic started to affect major cities. Though most people assumed that the high unemployment rate would foreshadow a high crime rate, this prediction didn’t come true, as the country experienced a 20% decline in the crime rate.

    Researchers think that lockdown and social distancing reduced criminals’ opportunities to commit violations.

    10. The murder cases rate was up by 21.8% in 36 cities in the US in 2020.

    (The Baltimore Sun)

    The recent crime statistics on violent crimes and murder reveal an unusual situation in the country. While reports indicate an overall steady decrease in the violent crimes rate in the last several years, the murder rate seems to move in the opposite direction.

    This isn’t unheard of as it has happened four times since 1960; the numbers just show how significant the disparity is. In the past, the difference between the two statistics was only 2.2%. In 2020, it was a double-digit number, as the murder rate was up by 21.8% in 36 cities across the US.

    Safe At Last - Violent Crimes Statistics 2021

    Crime Statistics by State

    11. The violent crime rate in Alaska is 885 cases per 100,000 residents.

    (USA Today)

    Most recent crime statistics by country show that Alaska is the most dangerous state to live in. The violent crime rate is more than twice the national rate of 380.6 per 100,000 people. The state also has the highest rape rate in the country, with 161.6 reported cases.

    12. Detroit, Michigan, has a violent crime rate of 1,965.33 crimes per 100,000 citizens.

    (Statista)

    Newest crime statistics by the city show that Detroit, Michigan, has the highest violent crime rate, making it the most dangerous city in the US. These cases include murder and non-negligent manslaughter, forcible rape, robbery, and aggravated assault.

    13. Franklin, Massachusetts, has the lowest crime rate of 1.9 crimes per 1,000 residents.

    (Neighborhood Scout)

    According to neighborhood crime statistics, Franklin, Massachusetts, is the safest city in America. Data shows that the total crime rate is 1.9 cases per 1,000 residents. This means that the chances of being a victim of a crime are 1 in 524.

    14. The crime rate in Chicago declined by 10% when the pandemic struck the city.

    (The Guardian)

    Chicago was one of the most dangerous cities in the US. But even this violent city saw a drastic decline in drug arrests (42%), apart from an overall decline in the number of crimes (10%). Law enforcers hope that this trend will continue even after the pandemic is over.

    Crime Statistics by Category

    15. 57.6% of hate crime victims were targeted because of their ethnicity.

    (FBI)

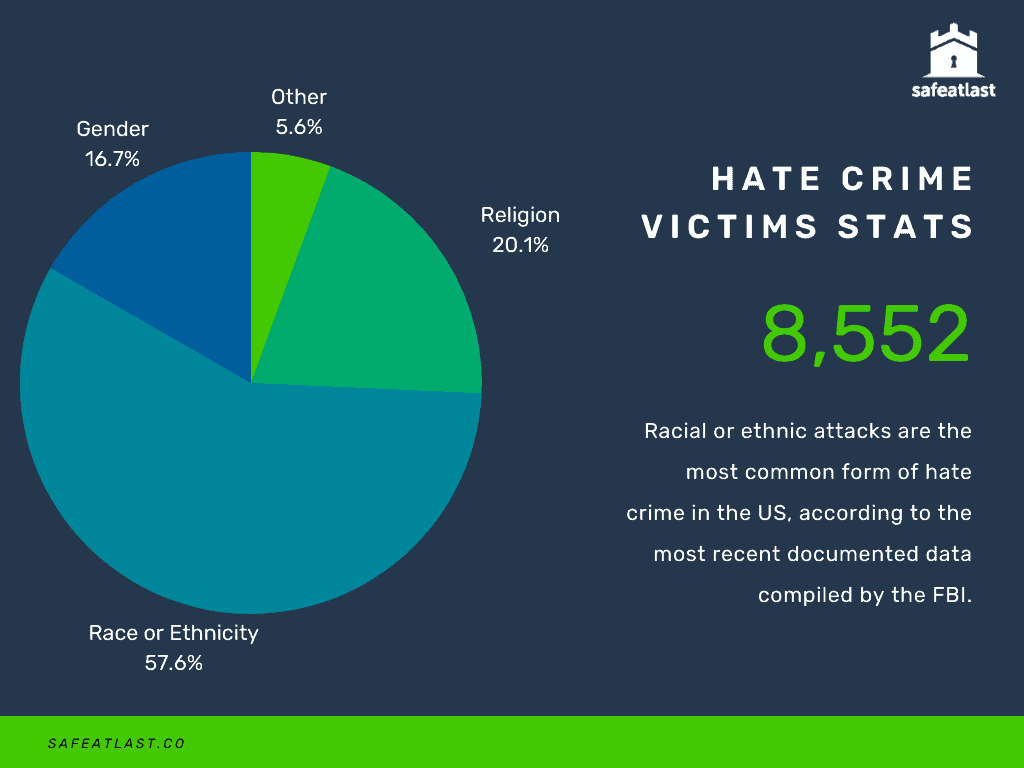
    The most recent hate crime statistics documented 8,552 victims of hate crimes. More than half of this number, or 57.6%, were the crimes committed because of the victim’s race or ethnicity. Simultaneously, 20.1% of the victims were targeted because of the attackers’ bias toward their religion, while 16.7% were attacked due to their gender.

    16. Juvenile crime statistics show that peak hours of juvenile crimes are from 2 PM to 6 PM.

    (Strong Nation)

    An analysis of juvenile crime records shows that the prime time for juvenile crimes is between 2 PM and 6 PM. Members of Strong Nation believe that these hours are crucial because they are after school hours when parents aren’t around to supervise their children’s activities. They think this problem can be solved by providing meaningful afterschool activities.

    17. According to online dating crime statistics, Americans lost $201 million due to scammers on dating apps.

    (Market Watch)

    Statistics show that more and more Americans flock to online dating apps to find their soulmates. In fact, 60% of adults regard dating apps as an excellent way to meet new people and interact with them conveniently. 

    Sadly, dating apps also make it easy for scammers and fraudsters to commit crimes. Most recent info suggests that Americans lost approximately $201 million to scammers, with a median loss of $501 per victim. To avoid this, it’s best to conduct a personal background check on your chatmate before committing to anything.

    18. White collar crime charges decreased by 41.9% compared to the previous year.

    (Trac Reports)

    White-collar crime statistics show a significant drop in the number of charges compared to the previous year. Moreover, the recorded 437 prosecutions are lower by 51.3% than the levels in 2015.

    19. The latest trends suggest that homeless people are 11 times more likely to be incarcerated.

    (Texas Criminal Justice Coalition)

    Many factors affect crime rates, and poverty is one of them. According to poverty and crime statistics, 65% of low-income households are at a greater risk of becoming homeless. Data further shows that incarceration and homelessness are inextricably linked. Homeless people are 11 times more likely to be incarcerated than the general population, and previously incarcerated people are ten times more likely to become homeless.

    20. Newest violent crime statistics suggest that the number of male and female violent crime victims was almost the same.

    (Statista)

    A graph of male vs. female crime statistics shows that the number of male and female violent crime victims was almost the same. But when the data was compared to the numbers from 2005, something troubling came up. The number of male victims decreased, while the number of female victims increased by almost 100,000 cases. It’s no wonder more and more companies are creating stun protection devices for women.

    Safe at Last - Hate Crimes in the US 2021

    Crime Statistics by Race

    21. African Americans are 3.23 times more likely to be killed during police encounters than White Americans.

    (PLOS ONE)

    Researchers from Harvard T.H. Chan School of Public Health conducted a study to determine if race and color are related to police crime statistics. Their analysis of 5,494 police-related deaths found that Black Americans are 3.23 times more likely to be killed by the police during an encounter than White Americans.

    22. Most recent black on black crime statistics suggest that offenders were black in 70% of crimes committed against Black victims.

    (Bureau of Justice Statistics)

    The research found out that an offender was usually of the same race as a victim. For instance, White people committed 62% of violent crimes against White victims, and Hispanic offenders committed 45% of incidents against Hispanic victims.

    23. According to the most recent black on white crime statistics, Black offenders murdered 566 White Americans.

    (FBI UCR)

    The FBI’s Uniform Crime Reporting program showed that, out of 3,299 White murder victims, only 566 were killed by Black offenders. The majority of the offenders were White persons. This is consistent with the FBI’s report that most homicide and murder cases are intraracial.

    24. The latest FBI data shows that 53.7% of homicide victims are African Americans.

    (FBI UCR)

    According to violent crime statistics by race, more than half of the victims are African Americans — 7,484 out of 13,927. This figure includes all Black homicide victims, regardless of their gender and age.

    25. Most recent info suggests that less than 15% of law enforcement agencies report hate crimes.

    (NBC)

    Proponents of civil rights continue to criticize the FBI’s crime reports as they don’t accurately show the national statistics on crime. Out of about 15,000 law enforcement agencies, only 2,172 reported hate crime data to the bureau; that’s less than 15% of the total number. However, even with incomplete data, the bureau still found a 20% increase in hate crimes motivated by gender-identity bias.

    FBI Crime Statistics

    26. Approximately 33,000 violent street gangs exist in the United States.

    (FBI)

    One of the functions of the FBI is to deal with threats to national security. But the Bureau also plays a crucial role in combating violent crimes in cities and states. FBI statistics on crime show that 33,000 criminally active organized groups terrorize neighborhoods in the US. These gangs use violence to control people and boost their illegal activities such as gun trafficking, prostitution, and human trafficking.

    27. The US aggravated assault rate in 2020 was 279.7 cases per 100,000 inhabitants.

    (Statista)

    That was a substantial increase from 2019. More specifically, FBI crime statistics from 2019 show that back then, the rate was 250.4 cases per 100,000 inhabitants, also indicating an increase from the year before.

    28. The violent crime rate decreased in the first six months of 2020. 

    (FBI)

    The FBI crime stats for 2020 show that the first half of the year saw a significant decline in the overall number of violent crimes compared to the same period of the previous year. Moreover, the cities with populations of less than 10,000 people reported the largest decline of 7.2%. The FBI also recorded a decrease in violent crimes in three out of four regions in the country.

    29. 26.6% of arrested individuals in 2019 were African Americans. 

    (FBI UCR)

    Crime statistics from 2019 show that 6,816,975 arrests were made that year. Out of that number, 1,815,144 people were African Americans, while the majority of arrested, most precisely 69.4% of them, were White Americans. The rest were people of different races and ethnicities.

    Safe at Last - Arrest Numbers 2021

    Conclusion

    The FBI divided crimes into two categories — property crimes and violent crimes. In recent years, the US has experienced a progressive decline in both types of crimes. However, crime stats show that the number of murders has increased in the current year compared to the previous years. This suggests that further study might be needed to understand this increase and develop strategies to lower the murder rate.

    People Also Ask

    What is the most common crime to occur within families according to statistics?

    Domestic abuse is one of the most common and pressing issues in the United States. This includes child abuse, elder abuse, and intimate partner abuse. Statistics estimate that 10 million people fall victim to domestic abuse every year. The figure is so large that, at some point, every healthcare professional and provider will evaluate or treat a victim of domestic or family abuse.

    What are the statistics of black on black crime?

    Despite the general opinion, intraracial crimes, or crimes where a victim and an offender are of the same race, are more common than interracial crimes. Moreover, data shows that Black offenders committed more than 85% of crimes against Black Americans. The same can be said about White American victims and their offenders — most offenders are also white.

    How does poverty affect crime statistics?

    Researchers have found several factors that can affect the change in crime rates, such as population density, age, unemployment, poverty, and mental illness. Out of all these factors, poverty has the most obvious influence on crime rates. If the poverty level rose by 1%, the number of total crimes would increase by 135 cases and the number of violent crimes by 25 cases.

    What can crime statistics tell us about the crime picture in America?

    The latest statistics on crime in the US show that violent crime and property crime rates have decreased in the last couple of years. Some researchers believe that this downward trend results from the collective efforts of the FBI, law enforcers, and communities across the country. Moreover, despite the widespread opinion that the US is a crime-ridden country, violent crime in the country is extremely localized.

    How to find crime statistics for an area?

    Statistics and crime levels in a certain area or community can be determined in several ways. One of the best ways to do this is by checking out crime mapping services that display information on the crimes committed in the neighborhood. These services are also able to register the types of crimes and their dates and notify you about future crimes in the area.

    Who commits white-collar crime statistics?

    White-collar crimes are classified as non-violent crimes. They usually involve money laundering, investment fraud, bribery, corporate espionage, and financial information falsification. Due to the nature of this type of crime, it is usually committed by educated, gainfully employed, middle-aged men with high social status. Many of these men commit their first white-collar crime in their late thirties or mid-forties.

    How do crime statistics help law enforcement?

    Crime statistics help law enforcers battle against criminals. They also assist them in determining the effectiveness of implemented programs designed to lower the crime rate. These statistics show a predominant type of crime in a given city or neighborhood, which helps the police lower the risk of the specific crime type and allows them to focus more on high-risk neighborhoods and efficiently allocate police forces.

    What causes the most deaths in terms of overall crime statistics?

    Murder and homicide are the leading types of crime that cause the death of people from all age groups and demographics due to their violent nature. According to the most recent crime statistics, more than 18,000 Americans have died in a single year due to assault. That’s approximately 5.8 deaths per 100,000 people. Moreover, almost 14,000 were firearm homicide cases.

  • 27 Surprising Workplace Stress Statistics

    27 Surprising Workplace Stress Statistics

    One of the leading causes of stress among adults comes from their workplace. Due to increased stress levels, anxiety, and depression that occur thanks to a workplace environment, more people are now struggling with mental health. Moreover, workplace stress statistics show that workplace-induced stress further causes troubles with employees’ happiness, relationships, productivity, and tenure at both their company and outside in the real world.

    The data we’ve uncovered can give you an in-depth insight into the challenges people face at work. Hopefully, you will find them both fascinating and alarming, which might encourage you to help someone handle their stress levels in a better way.

    Key Stress in the Workplace Statistics (Editor’s Choice)

    • 4 in 10 employees report their job as very or extremely stressful
    • More than 6 in 10 Americans claim work is their primary cause of stress
    • Up to 80% of work accidents happen due to sleepiness caused by stress or increased stress levels
    • Almost 20% of people reported both verbal and physical bullying at the workplace because of increased stress
    • A stressful working environment adversely impacts the quality of work, according to 91% of workers
    • In the US, the age group that experiences the most stress in the workplace is people 25–35 years old
    • Around 66.7% of millennials claim to skip lunch to get ahead at work
    • Almost 60% of people have considered leaving or left a job due to negative office politics

    Overall Workplace Stress Statistics 

    A working environment with a lot of stress does not harm only an employee but an employer as well. It can cause less productivity, happiness, employee turnover, and more.

    1. 80% of Americans claim their stress comes from at least one factor at work.

    (SHRM)

    Stress is a common occurrence for American workers. In fact, 33% of them report regularly feeling stressed at work. The top five factors that cause stress at work are low salaries, lack of opportunity for growth and advancement, too heavy a workload, unrealistic job expectations, and long hours.

    2. 41% of workers in medium- to high-paying jobs have reported a negative working environment.

    (SHRM)

    Moreover, people working low-paying jobs have reported that their jobs negatively affect their stress levels. A stunning 51% of employees have stated stress management at the workplace is hard to maintain due to the nature of their work.

    3. 78% of working adults report having a positive relationship with their colleagues.

    (SHRM)

    Moreover, nearly three-quarters (72%) have a good relationship with their boss. However, the quality of these relationships has declined in the last three years.

    4. 6 in 10 Americans state their work-related stress levels were higher during the 2020 pandemic.

    (APA)

    Americans have experienced increased job stress levels in 2020 due to the global COVID-19 pandemic. Around 63% of American workers have reported that the current economy causes them stress on a more significant level.

    5. Americans aged 25–35 experience more chronic stress than other age groups.

    (Everyday Health)

    That is a combination of impacted mental health, physical health problems, and a mixture of socio-economic and environmental factors.

    6. More than 20% of employees spend around five hours a day thinking about their stressors.

    (Colonial Life)

    Stress and productivity do not go together, so stress has a negative impact on both employees’ productivity levels and mental health.

    7. 40% of employees have reported their job was very or extremely stressful.

    (AIS)

    Although 80% have declared they feel stressed about their jobs, approximately half say they need help in learning how to manage stress and 42% think their coworkers need such help. Furthermore, 25% of them target occupational stress as their number one stressor.

    8. 61% of Americans claim their work is their number one stressor.

    (APA)

    When talking about the main stressors in American people’s lives, the future of the nation, the economy, and money are among the highest-ranking stressors. On the other hand, the current political climate (57%) and violence and crime (51%) are considered less important factors.

    Targeted Workplace Stress Statistics

    Work-related burnout is a serious matter that we shouldn’t underestimate.

    9. 91% of workers reveal that feeling high levels of stress negatively impacts the quality of their work.

    (Deloitte)

    Naturally, immense amounts of stress can negatively impact anyone’s workload and the quality of work. Furthermore, 83% claim that burnout they experience daily at stressful workplaces has a negative impact on their relationships.

    10. 2 in 3 millennials claim to skip lunch to get ahead at work.

    (BioSpace)

    Millennials claim that their high-pressure jobs make them work harder and stay longer to get ahead. However, 60% of recently promoted millennials claim they can take lunch breaks, which means they can afford to take them.

    11. Top five stress factors are the inability to advance, low salaries, long working hours, heavy workload, and unrealistic job expectations.

    (SHRM)

    The majority of working Americans have reported that many work-related factors influence their stress levels at work. Statistics on stress in the workplace show that it is most often caused by few to no opportunities for growth, low salaries, long working hours, and unrealistic job expectations.

    12. 15% of people admitted they were looking for a new job because of stress.

    (Colonial Life)

    Employees are aware that the stress levels they experience at their office make their performance worse. In addition, 41% claim work stress makes them less productive, while 33% think it makes them less engaged.

    13. 58% of people have thought about leaving or have left a job due to negative office politics.

    (Randstad)

    In addition, 86% would not continue to work or apply for a company that has a bad reputation with the general public or former employees, and 65% would probably leave if their employers were negatively portrayed on social media or in the news due to a crisis or employee stress. On top of that, they say they would even work for a smaller salary if that meant working for a great boss.

    Workplace Stress and Its Impact on Health

    Stress is a significant factor in people’s lives, both professional and personal. Thus, the stress in the workplace not only impacts the working environment but also harms the person’s physical and mental health.

    14. 19% of people reported both verbal and physical bullying at the workplace.

    (Stress.org)

    Unfortunately, dealing with work stress goes hand in hand with bullying, both verbal and physical. Furthermore, 35% of employees think their job affects their emotional or physical health, while 42% claim job pressure affects their relationships.

    15. 66% of people have reported having difficulty sleeping due to stress related to work.

    (Inc)

    Stressful situations in the workplace lead to people taking their stress home, resulting in a less peaceful home life. Sleep deprivation has a negative impact on the critical thinking skills and problem-solving abilities you need for success at work.

    16. 44% of people reported having trouble with their eyes.

    (CWM)

    Whether you’re a stressed office worker, teacher, writer, or your position requires any contact with computers, you will probably report having some work-related health problems. Some of the most common stress-related symptoms are neck pain (60.2%), hand pain (38%), and sleep problems (34%).

    17. 31% of male and female workers handle stress at work by consuming more caffeine.

    (ADDA)

    There are several ways employees handle causes of stress in the workplace. In fact, 27% of them smoke, 23% take prescription or over-the-counter medication, and 20% consume more alcoholic beverages.

    18. 65% of employees claim workplace stress has caused difficulties.

    (AIS)

    Moreover, more than 10% say stress can have major effects. Another 42% report verbal abuse as a common occurrence, while 29% of workers have yelled at their colleagues due to stress in the workplace. Some of the most stressful jobs even lead to physical violence (10%) and damage to machinery equipment (14%).

    19. 62% of people end their working day with neck problems.

    (AIS)

    In addition, more than half often spend 12 hours at work and the same number frequently skip lunch due to the stress of job-related duties. Nearly one in five respondents (19%) quit a previous position because of stress in the workplace, while almost one in four have been driven to tears because of it.

    Stress in the Workplace Statistics Regarding Violence and Accidents

    20. 60–80% of accidents at work happen due to increased stress levels or sleepiness caused by stress.

    (EKU)

    According to the American Institute of Health, stress affects approximately 50% of American employees. While 48% of them can’t sleep well at night because of stress, 42% have changed their job for the same reason.

    In addition, the stress in the workplace stats confirm that 52% of employees have called in sick because they were unable to cope with pressure at work, while many developed some psychological symptoms of stress like nervousness (45%), irritability/anger (50%), waiting to cry (35%), and lack of energy (45%).

    Moreover, physical symptoms of work-related stress include headache (44%), fatigue (51%), upset stomach (34%), muscle tension (30), and appetite changes (23%).

    21. 42% of employees have reported yelling or verbal assaults at work.

    (AIS)

    Current statistics about stress in the workplace report that verbal assaults and yelling are common occurrences. In fact, around 42% of people working in offices or job sites have reported that. On top of that, 29% of people have admitted to yelling at coworkers due to increased stress.

    22. 14% of people admit they have felt the need to strike a coworker but haven’t.

    (AIS)

    The latest statistics on workplace stress show that people have felt the need to strike a coworker or supervisor. That was due to the stress they felt while performing their job. In addition, 2% of workers have actually struck someone at work.

    23. About 25% of people felt the need to shout or scream due to stress in the work environment.

    (AIS)

    As numerous studies show, stress in the work environment evokes different feelings in people. Around 10% of workers state they’re afraid of a coworker and their potential violent outbursts due to increased stress.

    25. 40% of people say they need help in managing stress.

    (AIS)

    Around 80% of people feel stressed at work, with nearly half of them reporting that they would like to learn how to cope with high-stress levels. On the other hand, 42% of people have stated that they would like their coworkers to learn how to manage stress.

    People Also Ask

    How is workplace stress measured?

    Naturally, stress levels are challenging to measure, but the most commonly used tool for measuring them is the Perceived Stress Scale (PSS). It is a widely used psychological instrument for measuring the perception of stress. It measures the degree to which situations in one’s life are evaluated as stressful, meaning it can be applied to workplace situations and further help determine workplace stress levels.

    What percentage of the population is stressed?

    According to recent data, around 33% of adult Americans feel extreme stress, while 77% experience stress that affects their everyday life. Moreover, 73% of workers claim stress affects their mental health, while 48% have trouble sleeping due to stress. People who experience particularly high rates of stress are women, ethnic minorities, single parents, and people responsible for their family’s health care decisions.

    What are the 3 signs that you are stressed about your work?

    There are plenty of signs that can help you determine whether you’re stressed about work. Some of the most common indicators are insomnia leading to tiredness, irritability or outbursts of anger, and low productivity accompanied by feelings of low achievement. Other signs might include consuming too much caffeine or alcohol, low mood, regular absence, a higher sickness rate, and being accident-prone, cynical, or defensive.

    What do I tell my doctor to get stress leave?

    If you want to solve your problem, it’s best to be completely honest about your symptoms with your doctor. You should note that it is crucial to be upfront and open about your feelings and work-related stress. Remember not to leave out any details, and listen to your doctor’s advice. Give an example of a work-related stress incident and explain why you’re feeling that way.

    Can I quit my job due to stress?

    Naturally, you can quit your job for any reason, one of them being stress. Stress has a detrimental effect on health, so if you feel it is starting to affect your health, it might be time to quit or even ask for fewer responsibilities. If a simple break from work doesn’t help you manage your stress levels, then you’d better seriously think about what you should do, workplace stress statistics show.

  • Everything You Need To Know About the Types of Burglary

    Everything You Need To Know About the Types of Burglary

    Burglary is a felony most often associated with theft and can refer to many situations, even shoplifting. It is defined as a criminal offense of breaking and entering a place illegally with the intent of committing a crime, and it happens more often than you’d think. There are several types of burglary, and each of them comes with its charges and repercussions. Statistics show that these crimes occur most often during the daytime and within minutes.

    This article will explain what kinds of burglary exist, what elements constitute it, how to burglar-proof your home, and what to do if it happens to you. Read on and learn some of the most important facts about this crime.

    Degrees of Burglary

    The laws of a state determine the kinds of burglary. However, all of them require the following elements to prove the crime:

    • The person entered the property without authorization
    • The structure in question is not abandoned
    • The person had a goal of committing a crime

    The sections below show the overview and the states’ requirements for each degree of burglary.

    What Is First-Degree Burglary?

    The first degree of burglary is the most severe and covers all residential and commercial burglaries. More specifically, it means breaking and entering a dwelling or a commercial building with the intent of committing either a violent crime or theft. Dwelling refers to a person’s place of residence, including freestanding houses, trailer homes, apartments, and condos. FBI states that burglary usually lasts from 90 seconds to 12 minutes.

    Charges for burglary differ from state to state. The first-degree burglary sentence, for example, can be anything from felony probation to life in prison. For instance, under California law, burglary in the first degree is always a felony, leading to probation or two, four, or six years in California state prison.

    In Florida, for example, burglary in the first degree is sometimes punishable by life in prison. At the same time, perpetrators can get 7–20 years of jail time in Oklahoma and 7–21 years in Arizona.

    Burglary 2nd Degree

    Burglary in the second degree covers nonresidential burglaries and is almost always considered a felony. Depending on the state, it may involve an unarmed break-in where no one is injured. Second-degree violations are:

    • breaking into an office, barn, shed, car, or boat, with the intent of committing a crime
    • committing a crime with no violence or when the victim isn’t present
    • possessing a weapon during unlawful entry
    • commercial building entrance with no authorization

    According to burglary sentencing guidelines, a person convicted of burglary in the second degree will be sentenced under applicable local laws. For instance, the penalty in Oklahoma is up to seven years of imprisonment.

    Burglary in the second degree can carry a penalty of up to 15 years in prison or on probation, as well as fines and surcharges. The maximum fine is usually $20,000.

    For a burglary of a building in Texas, the punishment involves six months to two years of jail time since it is considered a felony. However, habitation burglary is often more severe than this, and a person can get between two and 20 years in prison for invading another person’s home. As we have mentioned, the punishment depends on each state’s laws and what kinds of burglaries they consider second-degree.

    Burglary 3rd Degree

    Third-degree burglary involves two elements:

    • The perpetrator enters and stays in a building without authorization
    • While in the building, they intend to commit a crime

    The main difference between the third and the first two degrees is that there aren’t any aggravating factors present in the former, such as the use of weapons and violence.

    Overall, third-degree charges are less severe compared to the first two. Examples of third-degree burglary punishments include imprisonment, probation time, restitution, conditional discharge, or community service, depending on the state and the severity of the case. First-time offenders can receive up to five years in prison, while repeat offenders receive no more than 10. Moreover, the fine for burglaries in the second degree can go up to $5,000.

    Third-degree burglary can sometimes be charged as an unlawful entry offense, which is often treated as a misdemeanor instead.

    The three different types of burglary we have mentioned are present in many states, such as Arizona, Florida, and Kentucky. What’s more, California and Georgia laws recognize only first and second-degree burglaries. However, states like Maryland and Iowa have the so-called fourth-degree burglary, which is often treated as a misdemeanor rather than a felony. Let’s take a look at how this degree differs from the previous three.

    4th Degree Burglary

    Fourth-degree burglary most often refers only to the intent of committing the crime. For instance, if a person is found near a building with burglar’s tools, like a crowbar or a rock, they can still be charged with the crime. However, some states’ laws treat breaking and entering as fourth-degree burglary, even if the perpetrator doesn’t intend to commit further crimes.

    The types of burglary charges for this level are the least severe among the four. People who carry out fourth-degree burglaries can face prison sentences from six months to three years. Moreover, they will have to pay fines of up to $3,000. However, the charges still depend on each state’s jurisdiction, while most states don’t even have a separate degree for these kinds of burglary.

    What To Do If Someone Breaks Into Your House

    Burglary is a crime that can happen to anyone, anywhere. In fact, home burglary occurs every 30 seconds in the US. A burglar can use forcible or non-forcible means to enter a place. For example, a forcible entry burglary occurs when someone kicks down the door, breaks the window, or uses another break-in method.

    On the other hand, a non-forcible entry occurs when someone uses deception or other constructive means to enter a place without permission. This includes using a key hidden under the doormat, calling and claiming to be from the cable TV company, or pretending to be lost and asking to use the phone.

    Of course, no matter how carefully you try to avoid these two types of burglary, they can still occur. If you come face to face with a burglar, the best thing to do is stay calm and try to remember as many details about the person. Then, call the police right away and let them handle it.

    Another option is to call your home insurance company, which will compensate for the stolen property and pay for the repair or replacement of damaged items.

    Elements of Burglary

    Each type of burglary has its own set of elements in order to be treated as such. For example, suppose the property in question is not a residence or a commercial building and is, instead, a farm or vehicle. In that case, the elements will be different.

    However, some common elements must be present for each instance, regardless of the types of burglary involved. These elements include:

    • Entry into the property: The perpetrator must enter the property for the action to be considered burglary. If they merely attempt to enter but are unsuccessful, it will be classified as an attempted burglary.
    • Unlawful entry: The perpetrator must enter the property unlawfully. This means they don’t have permission from the owner or any other legal authority to be there.
    • Altered property: The perpetrator must have modified the property in question. For example, if they break into a home or apartment but don’t take anything or cause any damage, most often, there wouldn’t be any burglary charges.
    • Property of value: Finally, the property must be valuable enough to count as burglary. This means that it must have some monetary or sentimental value. The difference between theft and burglary is that theft often does not count as burglary if the stolen property isn’t worth much. If the items aren’t recovered, the stolen goods are appraised through physical proof, such as receipts and order forms.

    Understanding these elements and how they apply to the specific degrees of burglary can help you report the crime to the police in detail and protect yourself from potential legal repercussions.

    Burglary Prevention

    It’s important to know how to protect yourself in case someone breaks into your home or apartment. Here are some tips on how to prevent burglary attempts:

    • Keep your home well-lit at night.
    • Don’t hide your keys outside.
    • Install good-quality locks; the most common burglary example involves the owners leaving their doors and windows unlocked.
    • Install motion-sensor lights outside and inside your house.
    • Keep your valuables in a safe or out of plain sight.
    • Work with neighbors to keep an eye out on each other’s homes and belongings, especially when you are away on vacation or extended trips.
    • Consider a home security system, like Frontpoint.
    • If someone breaks in, it couldn’t hurt to have a self-defense weapon like a stun gun or a taser.

    Summary: How Many Degrees of Burglary Are There and What Can You Do?

    There are four different levels of burglary and several tactics to carry it out.

    Regardless of the degree, it’s essential to take precautions to prevent or minimize the damage. This might involve locking doors and windows, investing in high-quality security systems, or installing alarms. In fact, only 22% of people in the US report having an alarm system at home.

    Understanding different burglary types and tactics can help you keep yourself, those close to you, and your property safe from harm. It’s also crucial to report any suspicious activity immediately and work with the police to bring the criminals to justice.

    People Also Ask

    What are the three classifications of burglary?

    According to the FBI, there are three classifications of burglary:

    1. attempted forcible entry (forcing one’s way into a structure without success)
    2. forcible entry (use of physical force or threats during the burglary attempt)
    3. illegal entry without force (entering through an open window or an unlocked door)

    Cases where the burglar enters through an unlocked door or window and then threatens the residents or makes them go outside still count as forcible entries.

    What is the most common type of burglary?

    The most common type of burglary is residential, which involves breaking into or entering a private home. The burglar’s main purpose is to steal property, but this doesn’t prevent them from committing other crimes.

    In addition, the most common kinds of burglary involve people leaving the doors and windows unlocked. That’s why it’s essential to double-check whether you locked the door and install good-quality locks on your doors and windows.

    Which is the most serious type of burglary?

    Overall, burglary in the first degree is the most severe one — it covers all residential burglaries. More specifically, it’s defined as breaking and entering a person’s dwelling to commit either a violent crime or theft.

    Burglaries which involve only home break-ins are also very serious but are still less severe than those involving theft and violent crimes. In general, the aftermath determines the severity of this crime; losing your belongings through burglary is worse than having your house broken into but with all your goods in place.

    What are the major characteristics and varieties of burglaries?

    The four primary dimensions of burglary are the degree of organization, amount of violence, the value of the stolen goods, and the burglary counts. Four additional characteristics are unconnected offenses, connected offenses, pending charges, and attempted burglaries.

    Depending on the severity of the burglary, the perpetrators can receive sentences from 6 months to 25 years in jail. In the most serious cases, they can face life imprisonment. Apart from jail time, they also have to pay fines.

    Understanding these elements and the types of burglary is an integral part of effectively responding to these crimes. In addition, you can burglar-proof your home with motion sensors or a home security system in case you need extra security.

  • 25 Reliable Life Insurance Statistics for Your Peace of Mind

    25 Reliable Life Insurance Statistics for Your Peace of Mind

    If there’s one positive thing about the pandemic, it’s the people’s renewed interest in life insurance. It’s no secret that the number of insured individuals has been on a slow downward spiral. Shortly after the pandemic hit, people’s restored interest in life insurance quickly translated to multiple Google searches and appointments to insurers.

    Life insurance statistics revealed that, during the first half of 2020, life insurance applications rose by 1.5%. People desperately wanted a means of protecting their families from financial fallout in case of the worst outcomes. So, they turned to life insurance.

    If you want to know what the recent studies suggest or what financial planners think about the state of life insurance, please read on.

    Life Insurance Statistics (Editor’s Choice)

    • The leading life insurance premium writing country in 2020 was the United States
    • In the US, 747 life insurance companies operated in 2020
    • The number of nonelderly uninsured people reached 27.4 million in 2020
    • Online insurance purchases have jumped from 17% to 29% in the last decade
    • In 2022, life insurance premiums will increase by 3.9%
    • Over 40% of Americans prefer meeting with an advisor and buying insurance in person
    • In Australia, the average time for a claim to be accepted is 1.7 months
    • By 2028, life insurance premiums in China are forecast to increase by 9.3% annually

    General Life Insurance Facts

    1. The US was the leading life insurance premium writing country in 2020.

    (Statista)

    Its total value of life direct premiums written surpassed $630 billion. Moreover, the second place for largest life insurance markets took China. The largest insurer worldwide is Berkshire Hathaway. 

    2. In 2020, 747 life insurance companies operated in the US.

    (Statista)

    Most recent US life insurance market statistics reveal that the number of life insurance companies has decreased since 2001. 

    No one knows exactly what factors make life insurance lose its appeal. Some people trace it back to the increase in life expectancy that clearly influences people’s decision to get insured. As the estimated lifespan extends and is now closer to 100 years, more people think they don’t need life insurance anymore.

    3. 16% of Americans say they need insurance but don’t have it.

    (LIMRA)

    Several studies have been conducted to determine the accurate statistics of people with no life insurance. One of LIMRA’s studies found that 41 million US residents were uninsured, although many said they needed life insurance. The perceived cost of insurance and joblessness are the two main reasons that prevent millions of Americans from buying life insurance.

    4. In 2020, the number of nonelderly uninsured people reached 27.4 million.

    (KFF)

    Nonelderly adults accounted for over 84% of the nonelderly uninsured. Moreover, around 62% of the uninsured people were people of color, and most of the uninsured (40.1%) were Hispanic.

    In addition, the uninsured rate among nonelderly adults who work less than full-time full-year grew to around 16%. 

    5. The market penetration for life insurance is 54%.

    (BestLifeRates)

    The life insurance industry remains stable, with a 54% market penetration rate, as confirmed in several US life insurance industry statistics. Although the ownership gap rate increased to 16%, it’s still relatively low compared to other lines of insurance.

    Life Insurance Purchases Statistics

    6. The life insurance purchases amounted to $357 billion in California.

    (Statista)

    Most recent life insurance statistics by state reveal that the greatest number of life insurance policies was sold in the Golden State. Texas came second with life insurance purchases worth close to $276 billion, followed by New York, Florida, and Illinois. Alaska was at the bottom, with purchases worth only $7.36 billion. 

    7. In the last decade, the percent of online life insurance purchases almost doubled, from 17% to 29%.

    (LIMRA)

    In 2011, 64% of Americans preferred to meet with a consultant before buying an insurance plan. In 2020, only 41% felt that way. Insurers have automated underwriting practices to simplify the process of buying insurance. This kind of convenience has compelled more people to go online for insurance.

    The latest US life insurance statistics uncover that the rate of people who purchase insurance online has doubled. During the lockdown months, the rate of online insurance applicants increased by 1.5%.

    8. Most recent info shows that the value of policy purchases reached approximately 27.8 million in the US.

    (Statista)

    Life insurance statistics in the United States showed that homeowners, business owners, and parents were most likely to buy a life insurance policy. They purchase insurance plans for various reasons. In general, they want to cover debts or provide financial support to their families in case of their untimely death.

    9. Life insurance market statistics reveal that the total share of direct written premiums reached more than $174 billion.

    (BestLifeRates)

    If you want to get insured, one of the most important decisions you have to make is to choose an insurance company. By researching the market data share, you’ll know how well a company has been doing over the years.

    The recent life insurance industry statistics showed that the total market penetration rate is 54%. The top five insurance companies that displayed the best marketability were Northwestern Mutual, New York Life, Metropolitan, Lincoln National, and Prudential Life. The sum of these five companies’ market shares took up almost 30% of the entire written premiums.

    Life Insurance Facts on Ownership and Cost

    10. In just ten years, life insurance ownership has dropped by nine percentage points to 54%.

    (LIMRA)

    LIMRA life insurance statistics 2020 briefly illustrate the decline in insurance ownership over the past decade. According to researchers, the nine points dip is caused by the large decrease in employer-paid group life insurance benefits.

    11. The latest life insurance data recorded only 54% of insured Americans.

    (Statista)

    People with risky jobs need life insurance for two primary reasons — as a replacement income and to cover burial and final expenses in case of their death.

    Again, the most usual reason for not getting any coverage is the high cost. However, some insurance companies nowadays offer flexible and affordable term insurance policies so that everyone can get insured.

    12. Four in ten people who have life insurance regret not purchasing policies when they were younger.

    (Life Happens)

    Even though it’s better to get a life insurance policy at a younger age, life insurance facts reveal that many people don’t. The primary reason for that is the perception of the policies’ cost. 

    Some of the other reasons people don’t own life insurance are having other financial priorities, not feeling they need any, or not knowing how much/what type to buy. 

    13. In 2020, 36% of Americans said they intended to invest in life insurance in the next 12 months.

    (LIMRA)

    The declining rate of employer-sponsored life insurance didn’t stop Americans from getting coverage. Interesting life insurance facts 2020 show that 36% of them intended to buy life insurance coverage in the next 12 months.

    Researchers believe that COVID-19 has shown there is a need for life insurance. While the purchase intent is at an all-time high, researchers say that only a fraction of Americans actually follows through with buying life insurance.

    14. 29% of baby boomers, 32% of Gen Xers, and 28% of millennials prefer researching and buying insurance policies online.

    (No Exam)

    An interesting fact about life insurance ownership by age is that many baby boomers currently between 56–74 years old buy insurance policies online. Previously, boomers would prefer a face-to-face meeting with an agent, but now, their buying preferences have changed.

    One of the emerging life insurance trends is purchasing insurance plans over the web, regardless of age. During the quarantine months, the number of people sending online applications for life insurance has increased.

    15. 41% of Americans prefer to meet with an advisor and buy insurance in person.

    (BestLifeRates)

    According to life insurance sales statistics, Americans have different preferences for purchasing insurance policies. The majority (41%) like to meet an advisor in person, and 29% buy a policy over the phone. About 11% of consumers get insured through their employers, and 8% are open to purchasing insurance plans via email.

    16. Besides the breadwinner, 80% of Americans believe that other family members should get insured as well.

    (AIG)

    If a primary earner in a family passes away under some unfortunate circumstances, the family will go through a financial tragedy. That’s why it’s essential to have more than one insurance policy.

    Life insurance stats confirm that people often feel they don’t have enough insurance. The solution to this is to add more policies. Financial planners advise policyholders to review existing plans and upgrade them when needed.

    17. 73.7% of uninsured individuals blame high costs for not having any insurance.

    (KFF)

    Several statistics about life insurance mention that the cost stops people from buying a policy. Many people think that insurance is costly, but it doesn’t necessarily have to be. Apart from expensive ones, you can also find various affordable insurance plans that fit your budget.

    18. More than 50% of Americans overestimate the cost of a term life insurance plan at more than three times its actual price.

    (LIMRA)

    Individual life insurance statistics show that the perceived cost of insurance plans stops people from getting the coverage they need. More than half of Americans assume that term insurance policies are expensive, but they couldn’t be more wrong. In fact, the actual price of insurance is only a third of what most Americans estimate it to be. This is why asking an agent for assistance is helpful. You can get advice on which plan works well for your budget.

    19. 92% of Americans don’t realize the full range of benefits permanent life insurance can provide them.

    (AIG)

    The AIG study shows that only 25% of the respondents understand that permanent life insurance is another option to save for the future. Meanwhile, 21% know that they can withdraw from the cash value. A mere 17% understand that they can use permanent life insurance as tax-deferred supplemental retirement income.

    Most policyholders don’t care about understanding the array of benefits that their plans bring. What’s more important to them is that they have insurance, and they’re covered with a specific sum in case of death. As a policyholder, it’s your responsibility to know the benefits of your insurance policies.

    20. In 2019, 47% of Americans favored simplified underwriting over traditional underwriting.

    (LIMRA)

    LIMRA life insurance statistics from 2019 cited that nearly half of American consumers found simplified underwriting more convenient than traditional underwriting that included a very elaborate process.

    When people buy something, they want a comfortable and easy buying experience and not the opposite. This applies to buying insurance as well.

    Worldwide Life Insurance Statistics

    21. Global life insurance premiums are projected to grow by almost 4% in 2022.

    (Deloitte Insights)

    In the US, the insurance industry’s net premiums reach $1 trillion every year. Globally, the life insurance premiums sale dropped by 6% in 2020 due to the pandemic. However, this fall appears to be temporary. 

    Life insurance statistics around the world have projected that the total life insurance written premiums will have a 3.9% growth in 2022.

    22. Most recent info suggests that Momentum recorded an increase of 30% in claims.

    (Moonstone)

    Life insurance claims statistics reported a 30% increase in claims from Momentum, one of the leading insurance companies in South Africa by brand. It was also found that the top three causes of death claims in South Africa were cardiovascular diseases, cancer, and unnatural deaths, like accidents and suicides.

    What’s more disturbing is the 65% increase in suicide claims, where 88% of victims were male. The escalating number of critical illnesses and murders is considered the primary driver of the rise in paid benefits within the country.

    23. Most recent life insurance claim statistics reveal that the average time for a claim to be accepted in Australia is 1.7 months.

    (Insurance Watch)

    The time needed to process a claim differs depending on the insurance company and country. In Australia, the industry average acceptance rate for insurance claims is 1.7 months. Insurers need to review the papers before the company releases the payout.

    24. The last accessible data shows that the average payout on a life insurance policy in the UK is $105,129.

    (Drewberry)

    The Association of British Insurers (ABI) publishes the figures for life insurance claims every year. According to their latest data, 97.4% of all filed claims have been paid, amounting to more than $3.93 billion. On average, insurers pay $105,129 for each filed claim.

    25. Life insurance premiums in China are projected to increase by 9.3% per year until 2028.

    (SwissRe)

    The life insurance industry in China is steadily growing. An increase in demand leads to a continuous need for coverage. Furthermore, insurance sales agents also expand to online channels to attract more people and sell more insurance policies.

    Conclusion

    Life insurance statistics reveal a problem regarding purchasing life insurance during the pandemic. According to financial planners, the fear of COVID-19 shouldn’t be the determining factor for buying life insurance. Nevertheless, the pandemic has taught us a lot of valuable lessons, and one of those is the importance of investing in a life insurance policy.

    Paying less than a hundred dollars to have a financial fallback plan won’t hurt your budget. Something similar or worse than the pandemic may happen in the future. Thus, saving for an inevitable rainy day is a smart move. Hopefully, these life insurance facts and statistics will motivate you to include an insurance policy in your long-term financial plan.

    People Also Ask

    Which is better, term or whole life insurance?

    Term and whole life insurance are different types of insurance, and each offers unique benefits. If we look at the life insurance statistics for the US, term insurance is more affordable than whole life. 

    However, whole life insurance provides cash value, while term insurance doesn’t. Simply put, what term insurance has, whole life insurance lacks, and vice versa. Therefore, it’s hard to say that one is better than the other.

    What are the statistics of men’s life insurance rates by age compared to women’s?

    Gender is a major factor in determining insurance rates due to several reasons. Some are life expectancy, jobs, and lifestyle. Women have a life expectancy of 81.2 years, while men have an expectancy of only 76.2 years. When it comes to employment, men have riskier jobs compared to women. They also tend to drink and smoke more. All these risks contribute to higher insurance rates for men by several percentage points.

    Regarding a 20-year term life insurance, the average annual rate for men is $229, while for women is $193. As people age, this difference further broadens. At the age of 50, men pay $842 for annual premiums, while women pay only $654.

    Can you have two different life insurance policies?

    It’s completely acceptable and legal to have multiple life insurance policies. For example, some people have both life insurance coverage through their employer and their own term life or permanent life insurance policy. Moreover, about one in five policyholders say they don’t have enough coverage. Adding more insurance plans is not necessary, but it’s encouraged. They can be your fallback in times of uncertainty.

    Should a 20-year-old get life insurance?

    Absolutely. The best time to get insurance coverage is in your 20s because premium rates are low. Besides, it’s great to make an investment like an insurance plan as soon as you start working. According to life insurance statistics, there’s no minimum age for getting insurance. But you’ll need to be at least 18 to file for an insurance policy.